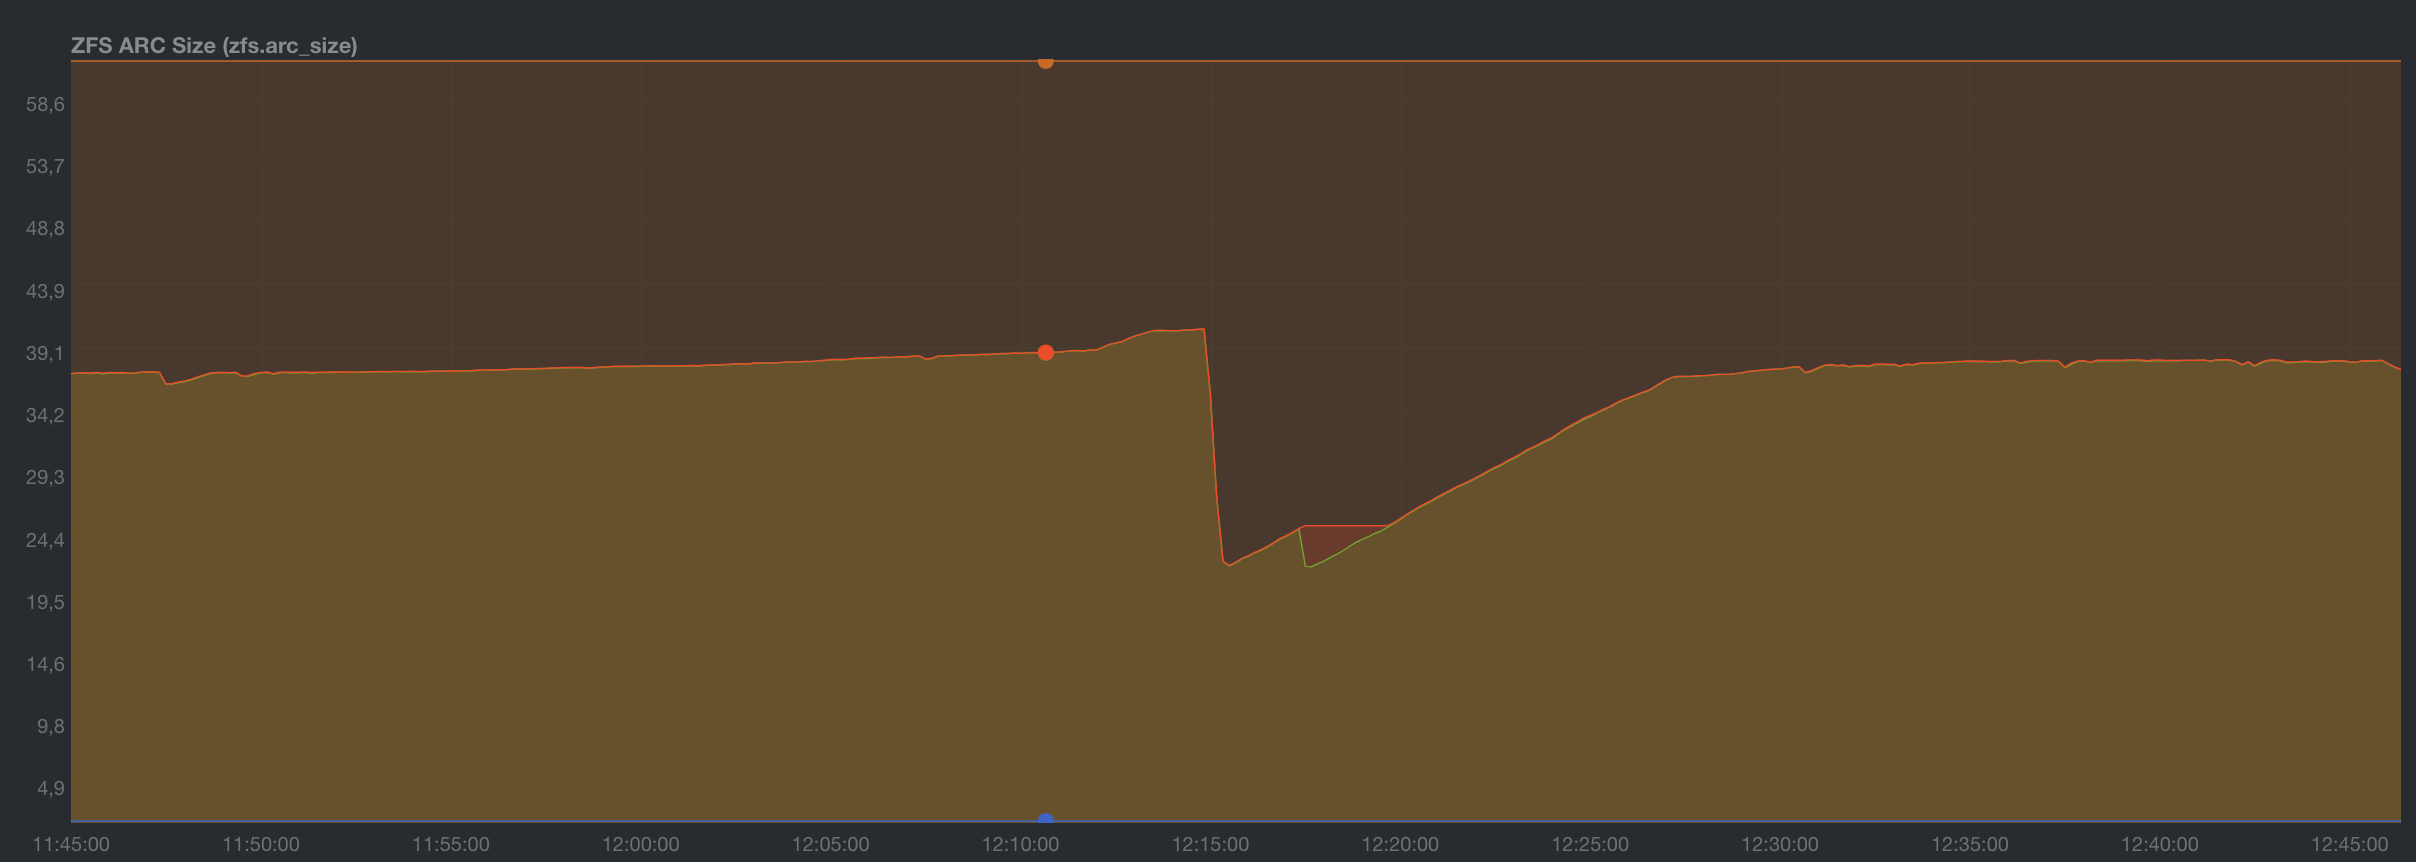
Those ARC evictions look aggressive.
3 Likes
I fear that I am wasting developer time, but just in case I raised a ticket here [NAS-130348] - iXsystems TrueNAS Jira
Hopefully it’s a productive one as I am sure they’re very busy.
It is possible that this is a result of a TrueNAS custom setting for ZFS (which would be a TrueNAS issue), but if it is a bug then IMO it is more likely to be a ZFS one.
Are there any other ZFS settings that might impact global ARC flushing? Frequency, aggressiveness, high / low watermarks?
From the @sfatula graph only, it looks to me like there is a 65% high watermark and a 40% low watermark, and when it hits 65% stuff gets flushed until it goes below 40%. If so, these seem quite aggressive to me - suggesting that the cache flush is a heavyweight action, and perhaps (wild guess) 90% / 75% would be better values.
1 Like
Mine always seem to appear in the evening looking back a week. I am wondering if it might be Emby. So, large videos which are used at night mainly for Olympics right now. We watch them each evening at different times. Maybe we watch a 4 gb recording, then another 4, and then another 4. I don’t see why it would evict though, it should more replace.
Maybe - maybe not.
ZFS is not a FIFO cache or an LRU cache - it is more intelligent than that.
And the ZFS cache is block oriented. It probably knows about metadata blocks vs. file blocks, but not much more than that, and so it should flush blocks from the 4GB video file as blocks and not flush the entire file at once.
Ok so I received a reply for my ticket raised. If I read this correctly, the devs are taking a precautious approach to balance the linux requirements with the desire to optimise the ARC cache. This is the quoted response with the issue being assigned to the TrueNAS Backend Triage team.
Interactions between ZFS ARC and Linux kernel are historically very difficult. Before TrueNAS SCALE 23.10 ARC was hard limited to only 50% of RAM and same time barely reacting on memory pressure signals. In 24.04 we’ve increased maximum ARC size to almost a RAM size. Since the limit of 50% was in ZFS on Linux from the day one, we are effectively a pioneers in this area (it will be changed in coming ZFS 2.3). But to avoid Out Of Memory situations we have to make ZFS much more obedient to Linux kernel memory pressure signals, reported via shrinker KPI. Unfortunately Linux kernel considers that KPI secondary its own memory pressure mechanisms, that may cause excessive evictions in some cases and still OOMs in some others. So we have to carefully balance between having not enough memory and some extra free memory. While the first is often fatal, our choice is obvious. We are still working on this problem from the both sides of Linux kernel and ZFS, hoping the situation to get better in upcoming TrueNAS SCALE 24.10.
It seems my ticket wasn’t a complete waste of their time ![]()
4 Likes
Yeah, I know, but it’s sure a coincidence for my use case at least. There are no cron jobs or other activity during those times, that’s after hours entertainment time. Not saying it’s definitely that just looking for a pattern. In the end it won’t matter as IX is correct on their response to the ticket. And, it appears other than the chart not looking flat with max, no real performance affect based on my arc stats, etc.
My understanding is the ARC is now dumped when kernel requests memory. Ie if the kernel required a very large lump of memory then it gets it.
The problem is some “apps”
Make excessive memory requests expecting them to fail.
Then they don’t. And you have an ARC dump.
Or alternatively, you fail them and you get an OOM.
The issue is apps/services making poor memory request decisions.
Ix appears to be going after the kernel stuffs which do this and working actively to improve the kernel memory handling situation going forwards.
Basically anything above 50% is an improvement from where we were. But with 24.04.2 I think ARC dumps are triggered by your workload. At least it should be the LRU etc data.
Maybe Emby is using tempfs for its transcodes. Tempfs is memory backed. Which seems silly to me.
Jellyfin uses a dataset.
Transcodes go to whatever directory you assign them to, or, in container of course as default, should be same as Jellyfin. No tmpfs though I suppose you could intentionally assign one. There could indeed be an app asking for a lot of memory, but based on the pattern thus far there’s only one candidate for what app! There are no services/jobs being used at night, until after midnight.
I of course never transcode (and no GPU as it’s not necessary), so, never an issue. Slightly not true as when on a trip, I do transcode when remote watching but that’s not what I am looking at here). It’s just playing back what was recording, so, recordings of course happen during the day (Olympics) and I watch them at night.
In the end it doesn’t matter, I’m just curious more than anything. I figure my system is simpler than many given a consistent use pattern with only a couple of us users. There really isn’t anything else on my system at least that is happening in the evenings, it all happens during morning/afternoon and after midnight. It’s relax time in the evening, system is otherwise idle. Emby is as of right now using .5GB memory according to the apps screen, and it’s recording 2 things from antenna, using an entire 2% cpu.
But yes, I am glad they are also going after kernel “stuff”!
Just for fun, I might monitor the graphs at the point in time we start watching them tonight to see if it’s a pretty quick arc drop, or, my imagination!
I did just delete a 6gb recording from last night as I forgot to last night, and… the arc went from 65.1GB to 57.9GB. Which makes sense, but, that isn’t the huge drops of 40GB or so. I never ever delete that much stuff in one day.
1 Like
So, I went from 65.5GB arc at 8:26pm to 15.5 at 11:11PM, in many steps. I do see one recording ended at 8:32PM, and, recordings are done in a temp folder (not tmpfs). It ALSO writes it out to the final destination folder (something to do with watching an in progress recording vs live tv). So, that would use a lot of space in the arc. The temp file is deleted when recording is done, and, the recording of course stays where it is. The deletion would thusly shrink the arc. When you have a bunch of recordings going on with different times and lengths, it can make a number of steps. So, it’s likely Emby on my system since I record antenna.
1 Like
To add a data point. I’m stress-testing the system after updating from Bluefin to Dragonfish. I have a multi-user plex via docker running, using hw transcode with an intel iGPU. I set transcodes to write to tempfs(mounted /dev/shm into docker container).
While throwing multiple 4K streams at it, a time machine backup, multiple client heavy smb i/o activity smb, this happend:
ARC dropped from 41 to 22 GiB in 30 seconds.
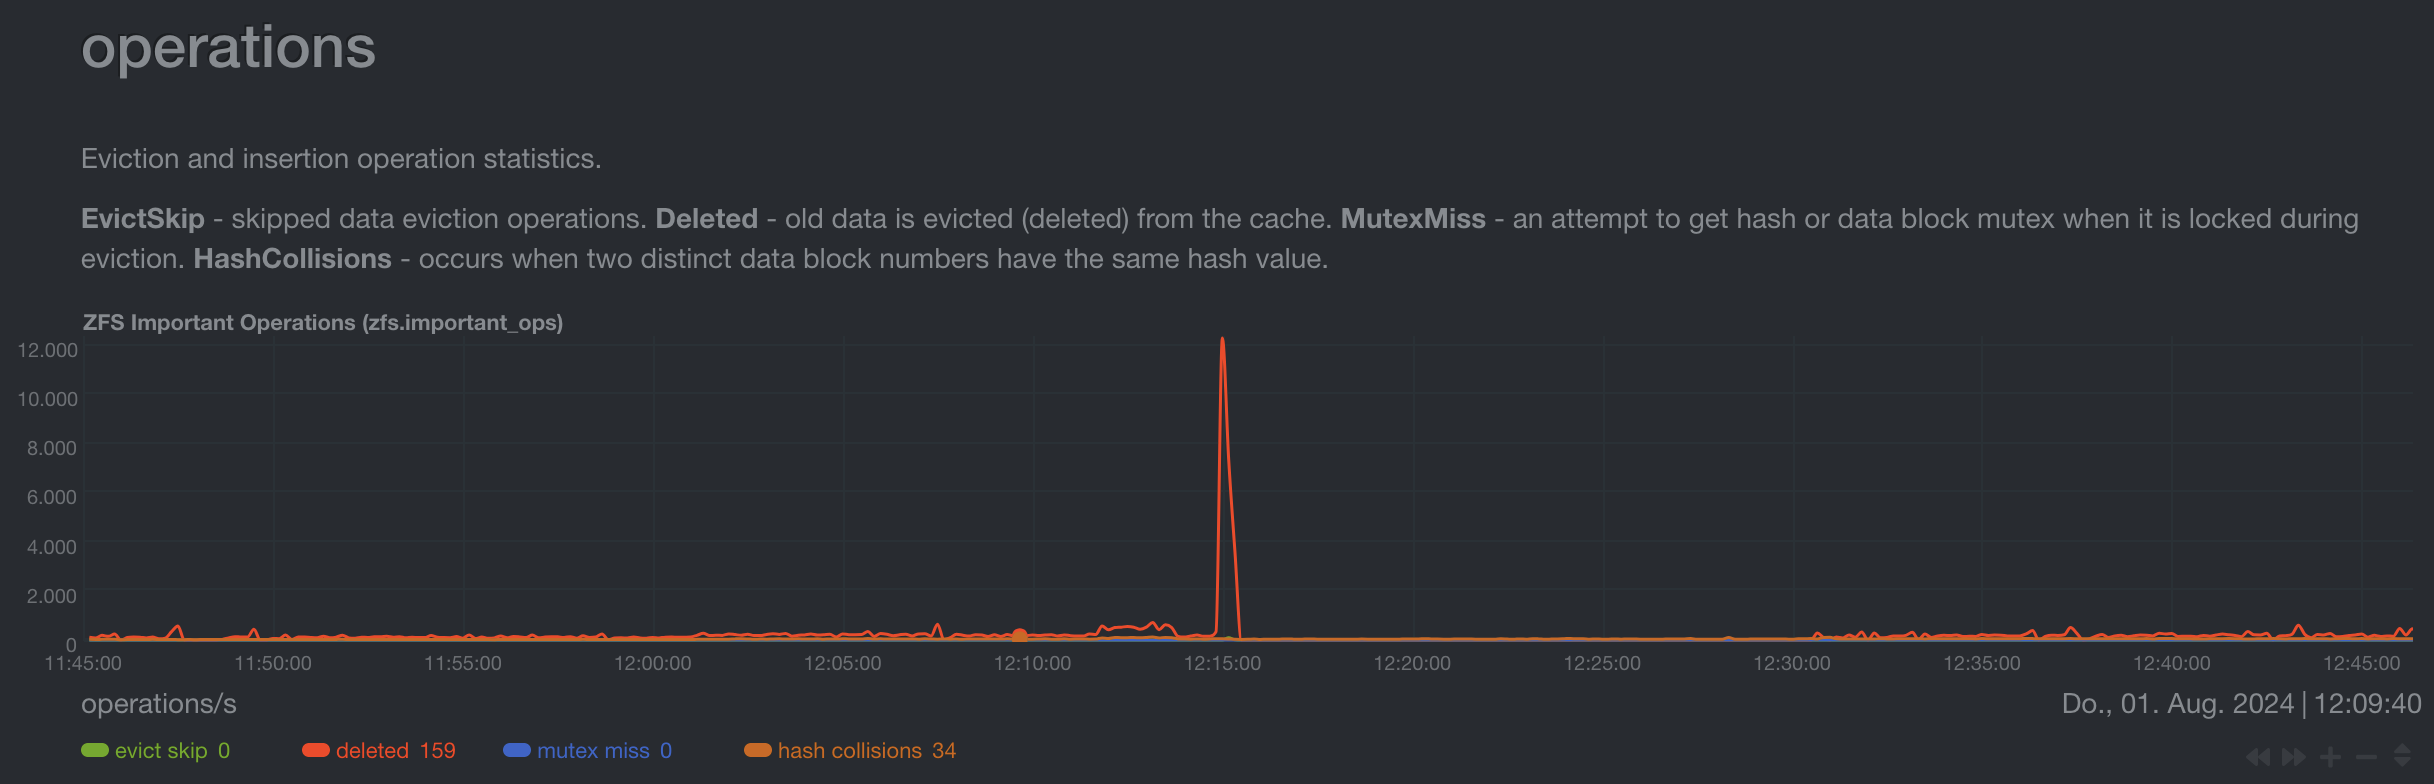
over 12K evictions in an instance.
System remained stable though.
1 Like
I assume everyone realises that this ARC cache eviction when you use tmpfs storage is to be expected because tmpfs is a memory resident file system.
1 Like
I really doubt tmpfs is the culprit in any of this as it still wouldn’t show as “free” memory.
as for the use of tmpfs on certain apps and not others, blame ix for hiding the options on their charts, and making these hidden pre-set settings wildly inconsistent between apps. unraid for all it’s faults doesn’t hide all the options on their ‘community’ apps like the ix-charts, ix’s approach forces use of the custom app button if you want to do anything useful/maintainable. (ix please… don’t make this mistake again with the docker ui…)
also I really only notice this when I run a copy/move, it eviscerates my ARC from 200+GB to <20GB in a minute or two… just starting a copy using the included mc. replications (between the same pool, of the same data) don’t create this behavior. something more is going on here other than “apps being bad”
Depending on where SMB clients are located, if some are via loopback mounts on same NAS, and particulars of application generating traffic, then there are potentially situations where an smb session’s AIO write queue grows to painfully large levels. This will manifest as RES memory of the smbd process growing to extremely large values. You can exert backpressure on clients and maybe get better arc behavior by disabling aio writes. midclt call smb.update '{"smb_options": "aio write size = 0"}'
I will work on putting in some backpressure mechanism in EE to more gracefully handle this so if you go this route, try removing the parameter on EE upgrade.
3 Likes
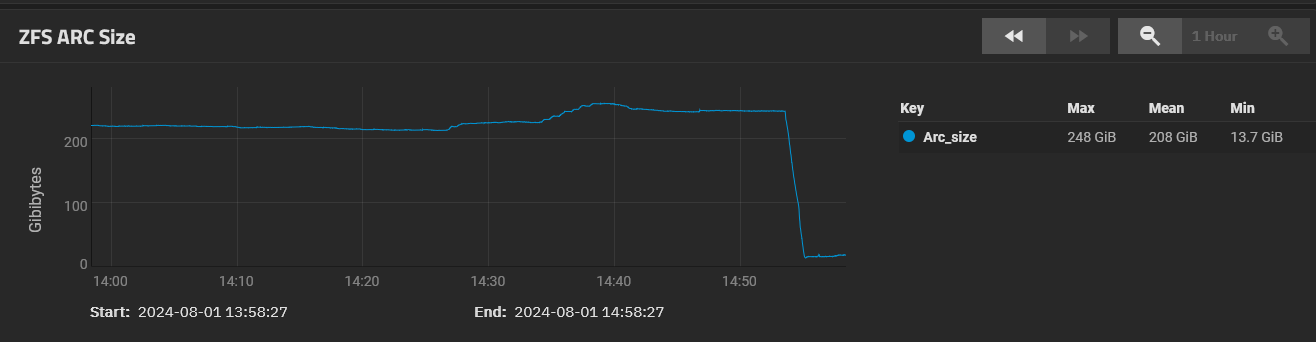
Hi - before raising in a new thread, I wondered whether the experts here think this is the same issue?
This is the ARC size comparison between my two boot environemnts - the only change is an upgrade from 24.04 to 24.04.2. I did raise this in the upgrade announcement forum a few weeks back, but was knocked back on the basis that no one else had experienced the same.
Would welcome opinions on this new behavior from the latest update.
Thanks
CC
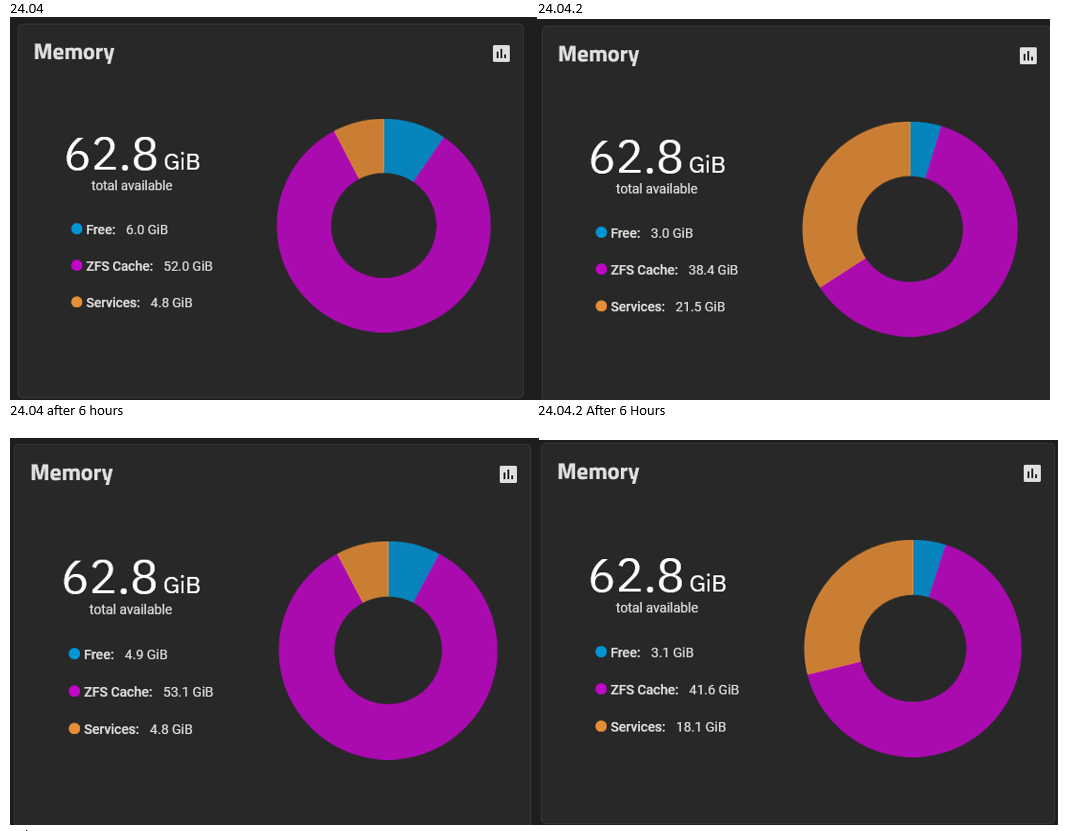
I’d say that what you’re seeing there is expected behavior with respect to ARC and free memory. Though I don’t know why the “Services” amount would be so much greater.
Firstly, I would say that the memory chart works like this:
- Total memory, Free memory and ZFS Cache sizes are easily gathered from the O/S and ZFS.
- The Services memory is calculated by taking the Free and ZFS away from Total.
If this is the case then tmpfs might well fall into Services because it isn’t part of either Free or ZFS.
My guess about “Services” is that it includes:
- Base O/S memory usage
- TrueNAS service processes like SMB (as shown on the System Settings/Services UI page)
- Your apps and VMs
- TrueNAS’ own Kubernetes usage
- tmpfs
- …
I guess a few SUDO shell commands can give you more insight into what is using memory.
But in the end only @ClimbingKid can work out what is using the memory on this specific system.
Finally, 4.8GB for Services seems normal - my own is at 5.9GB with c. 1GB of apps and SMART, SMB, UPS and SSH services running - if my system tried to use 21.5GB (out of my 10GB of actual memory) then I think it would crash.
1 Like
Thanks @Protopia - This is repeatable behavior, where there appears to be less ram available for ZFS cache. Easily repeatable, and this is consistant over days, nit just eth first few hours - on 24.04.2 I never seem to get teh majority of RAM available to teh ZFS cache as I did in previour 24.04
Happy to do further diagnosis - but quick;ly ehausted my knowledge to track down what was using all the “System Memory”. Can you give me any tips to try?
Many thanks
CC
Underneath TrueNAS SCALE is Debian - so all the Debian diagnosis tools should be available to you and there should be a wealth of suggestions if you Google for them.
So as the OP I thought I would update you all. I have received further feedback from the developers on the ticket I raised as follows:
Looking on the debug, I see that 3.2GB of ARC size is used by dnodes. It likely means that your workload includes large number (millions) of accessed files. We’ve recently tested somewhat similar configuration and also noticed some excessive free memory during benchmarks. Memory reported as “services” may be a related OS overhead of inodes/dnodes/etc. In our case we’ve noticed positive effect from this patch now waiting for upstream review: . I expect it to be included into next 24.10 release, but there can be more to this problem, since it is pretty difficult area since the beginning of ZFS, that just complicated by some Linux specifics.
I read that as my potential issue is an actual issue that is probably going to be patched in 24.10. Happy days.
3 Likes