some more BIOS fiddling done and now i await the next crash!
1 Like
Did you mount your own CPU? Those numerous tiny pads seem like excellent points of failure if not installed PERFECTLY. Good luck!
FWIW, I blew off my CPU and motherboard pads thoroughly and then checked for dust/hair/etc with a magnifying glass before installing the CPU. I found a tiny hair and speck of dirt, so rinsed & repeated the above several times. I’d feel better buying the MOBO+CPU directly from a clean room. ![]()
PS: Is there some reason you’re not up to date on the OS? I think that truenas 24.10.0.2 is considered the stable release now, no?
2 Likes
I’m on dragonfish now after rolling back from electric eel, the OG post was at the beginning of October. At this point i honestly don’t think its the CPU or hardware related as it doesnt crash at all unless i am running docker apps/services. Unsetting the pool gave me 4 days of testing uptime (no crash) vs 12-14 hours (with a crash). I have also ran 10 memtests in a row with no errors so i know it isnt the RAM.
I’m planning on once again reseating the CPU and blowing it off to make sure thats not it. I am definitely not confident in putting this in to production (home lab). I may end up buying a 1U supermicro server off ebay and slapping it on there.
I also discovered that the intel microcode that TrueNAS is using is not the very up to date, its v2.2 instead of 3.2+
2 day check in after wiping the system and moving back down to DragonFish from Electric Eel, reimported my pool and have not experienced any more crashes in this time with mostly the same services running in apps. Weird.
Probably Is worth open a ticket there. Have seen some ppl thread about kernel problem with dragonfish (like hanging on shutdown/reboot), solved updating to EEL… If you can’t find the cause you risk to Stick on dragonfish
Second bugxfix of dot-zero release. Conservative users may want to wait for .2 or .3 before dipping a toe into a new version.
1 Like
As demonstrated by my system issues, dipped my toes in to early lol
probably not a good thing that i didnt really save many logs, though i have some that were sent to my Synology NAS. I’ll open a ticket.
1 Like
There are still far too many reports on here of people experiencing Python exceptions in the middleware for me to install 24.10. I will wait a few months and see what people’s experiences with 24.10.1 are before I even start to research how I deal with my couple of minor TrueCharts apps.
Heh. Well, I guess this is yet another reason for me to separate my tasks completely. My true ass box is a critical piece of infrastructure for serving and preserving files. I’m not sure what the middle wear is, but if it’s not ZFS ensuring data protection, or NFS (Or, alas, SMB because NFS isn’t being served properly) then it has no business Being on my server. That’s what raspberry pies are for! ![]()
Running apps / VMs on TrueNAS is a tradeoff.
Pros
- Fast access by apps / VMs to data - on the same box, no physical network needed.
- Fewer servers needed - less electricity, less space, less maintenance
Cons
- All eggs in one basket (but if data is on TrueNAS and TrueNAS dies, all apps are affected anyway).
- Marginally higher risk of TrueNAS server crashing due to more things running
P.S. Middleware is essentially the TrueNAS UI and TrueNAS API. These essentially configure and coordinate the underlying O/S services (like Cron, ZFS, Docker, etc.).
1 Like
Looks like it happened again, shortly after deploying jellyfin and plex apps, was all good until the wee hours of the morning. I’m pulling these apps off, and doing another wait and see.
It also looks like my motherboard had my PCH voltage set at 1.050, so i set it to 1.000, and disabled any optimizations the board might be doing on its own (ASrock timing optimization?)

Seeing these errors from syslog around that time

Consider cleaning the contacts with isopropyl alcohol / contact cleaner and ideally DeOxit as well. My wife’s car rear cluster kept going on the fritz despite the shop addressing known issues like bad grounding wires. I took the cluster apart, cleaned every contact, then slathered all with a thin layer of DeOxit. No more issues since.
1 Like
What job runs soon after midnight each day? Because whatever it is, the CPU increases, and a long running CPU intensive “nice” job stays running and eventually either the reporting infrastructure hangs and eventually gets rebooted or the entire system hangs and eventually gets rebooted. The two later outages don’t see to have the same precursor CPU load, and not sure what that tells us. The CPU graph doesn’t tell us much, nor the syslog tell us much about outage 2, and nothing about outage 1 which we should be looking at first.
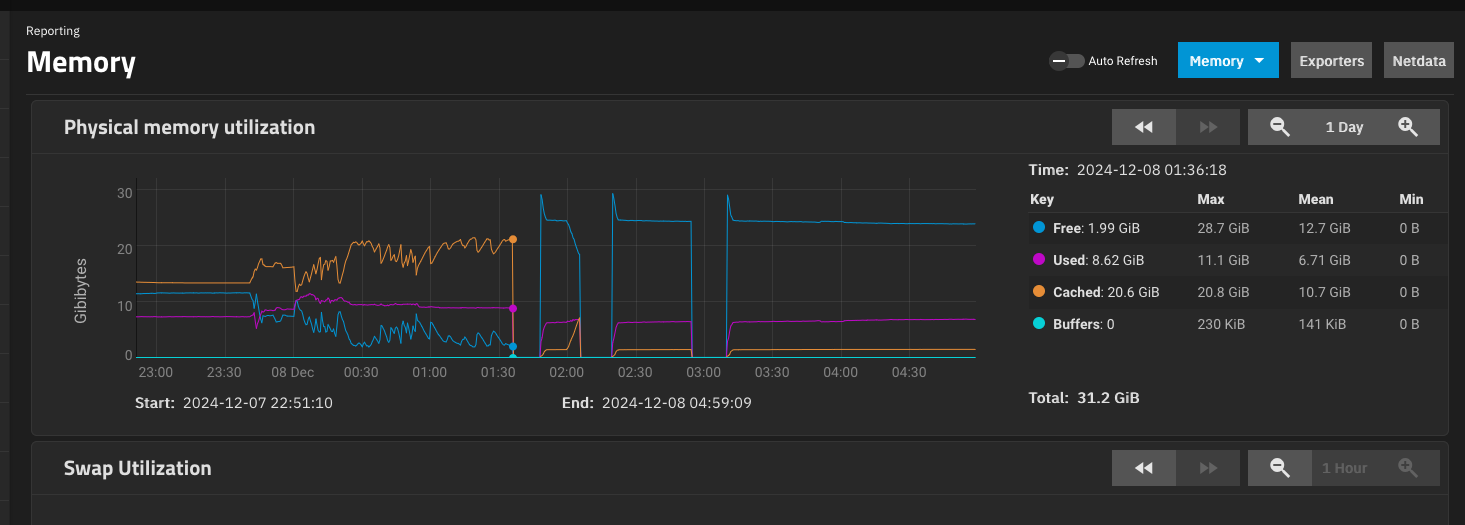
I am not sure whether the memory usage chart for the same period would tell us anything about possible memory exhaustion, but it’s worth a look.
Ok - definitely looks like 3 reboots on the trot rather than just reporting services crashing. But nothing yet to explain it.
What about CPU temp, disk temps, I/O rates for the same period?
(I am beginning to think that high CPU and high I/O was resulting in overheating somewhere.)
Temps look good nothing over ~60C, load doesnt look bad either the case is a fractal node 804 with 3x 120mm with good thermals.

some deeper data from netdata

Yes - I agree that CPU temps don’t seem to be a problem. And I/O load before the first reboot is almost zero, so it would seem unlikely that e.g. an I/O controller was overheating.
A couple more potential theories for folks here to mull over…
-
I/O has stalled and cache is growing due to TXGs not being written until everything stalls and some sort of watchdog timer reboots the system. But whilst that might be the cause of the first reboot, the systems don’t seem to occur before the 2nd and 3rd reboots.
-
I am wondering whether these 2nd and 3rd reboots are also watchdog timer reboots, but this time because something that tells the watchdog that the system is still running has failed to start. It does look from the graphs that the up-time before the 3rd reboot is twice that of the uptime before the 2nd reboot - but that could be a coincendence. But I can quite imagine writing watchdog code so that after the 1st reboot it allows a 2nd one, and then after double the time a 3rd one and then it disables the watchdog for a period.
One thing you could try is that if you do have watchdog functionality, then disable it completely so that if the system hangs you can look at the hardware console / IPMI screen to see what the last few system messages are.
Anyone else got any ideas?
I’ll have to check the BIOS again to see if i have watchdog functionality, but i cant say i recall seeing it.
I went and found the MB manual here. This is what is says about hardware monitoring:
- Temperature Sensing: CPU, Chassis/Water Pump Fans
- Fan Tachometer: CPU, Chassis/Water Pump Fans
- Quiet Fan (Auto adjust chassis fan speed by CPU
temperature): CPU, Chassis/Water Pump Fans - Fan Multi-Speed Control: CPU, Chassis/Water Pump Fans
- CASE OPEN detection
- Voltage monitoring: +12V, +5V, +3.3V, CPU Vcore
Nothing about a watchdog timer - so another theory trashed.