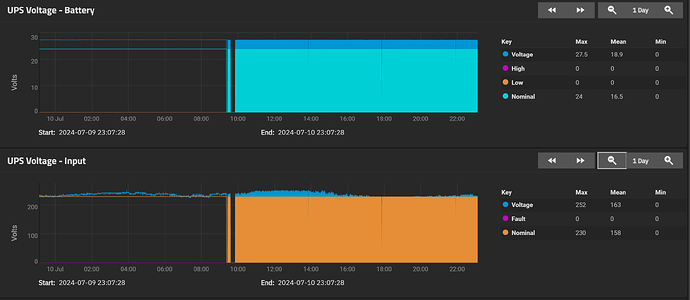
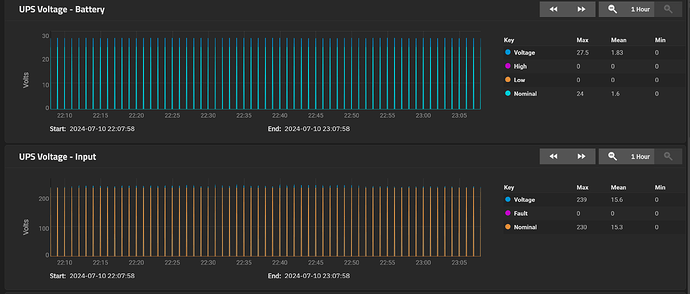
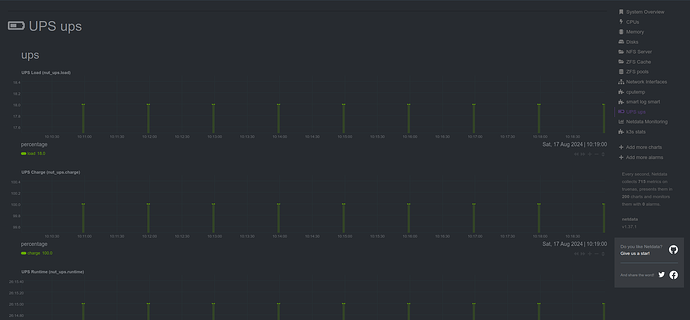
Anyone else seeing this weirdness in the UPS report since the upgrade to 24.04.2? I’m using an APC UPS with usbhid-ups
You can see where I updated this morning, and its affecting the mean and minimum stats.
Did you figure it out? I have the same issue.
No, I went back to the previous version to test and it was OK, switched back to
24.04.2 and its broken
Seeing the same thing with an Eaton UPS. Look like they changed the polling rate with Dragonfish.
Since I’m new to TrueNAS I thought it was my fault.
Mine is a Nilox UPS using blazer_usb driver, but from CLI I can sample as I want, i.e. upslog -s ups -l - -i 2 gives data every 2 seconds.
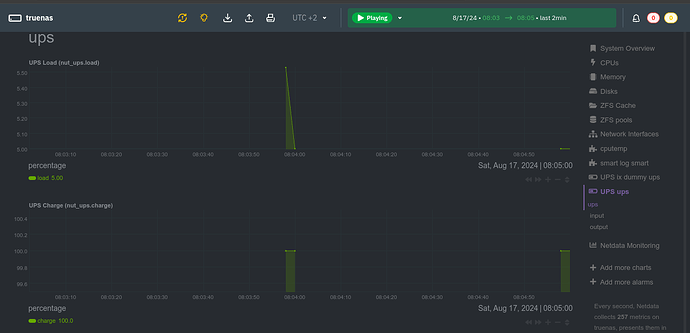
Looking at netdata it seems like it takes just 2 data samples per minute, one at second 58 and the other one at second 0
(which is similar to a policy of sampling every 2 seconds, limited to a maximum of 2 samples per minute)
Did you file a bug for this issue?
UPDATE: I forgot to mentions that I tried adding a pollinterval = X to Auxiliary parameters for ups.conf without success.
I have the exact same behaviour.
No, I did not file an bug report. Will do that now.
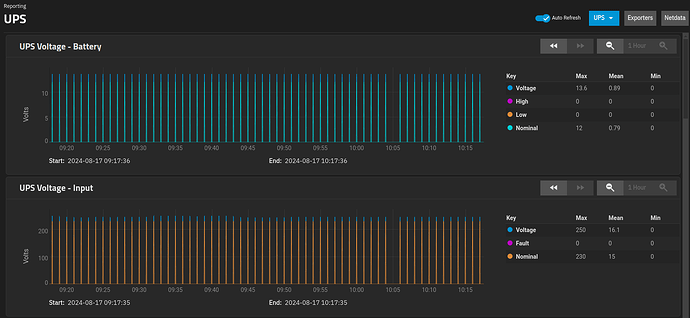
Mine’s also “wrong” when reporting UPS:
I’ve seen this ever since I installed my APC Back-UPS UPS a few weeks ago.
APC ups 2 Back-UPS (USB) USB (usbhid-ups)
and the Netdata page:
whereas, by way of contrast, other pages are how they should be:
yep, besides netdata showing 2 (very-close) data samples per minute, UPS reporting plots data as if there were additional 0-valued samples (probably not existing). It seems like the UPS related time-series were populated with wrong logic.
I think you’re right.
Two close values would work well for catching rapidly changing data (not needed here); zeroing in-between seems a mistake and instead it should do a sample and hold i.e. hold the last sample value until the next sample. Then at least you’d get a straight line.
I’m seeing the same behavior with the snmp-ups driver, and commented on the ticket to that effect.
It would be interesting to look at the sources, but I don’t have enough confidence in repos yet to compare releases.
I saw there’s a charts repo, but I’d expect time series are managed somewhere else.
Since they added the graphics feature it has never fully worked for me. I don’t see the input/output voltages or the related statistics for my SMC1000I. But to be fair, it doesn’t show in the CLI either, so i think the driver is not fully compatible with the APC models because they use propriatory APIs. I am getting the same battery screen as you too
The charts repo is for the apps; reporting is part of the core system. I’m not sure where the could would be exactly, but it definitely isn’t in the charts repo.
As I understand it, all the monitoring is delegated to netdata, and the UPS sampling frequency is controlled within nut.chart.sh
I’m also noticing this issue. Hoping for a fix.
https://ixsystems.atlassian.net/browse/NAS-129807?focusedCommentId=269631
The bug report started in this thread was cancelled due to there being an earlier (similar/same) one. That earlier one appears to be solved in EE.
I have the same issue, but does anyone know why the APC driver does not provide details on the Input/output voltage, etc only get the battery related info
I am not sure all of the data points are exposed for the open source driver to be able to report them.
I will not be buying an APC UPS again for this and a few other reasons.
That is not the case.
I don’t prefer APC (more expensive for the exact same thing), but even their cheaper smaller UPSes (675 VA) DO provide enough information.
NUT is handling the UPS properly and getting all the details that the UPS does provide, so if there is an issue showing the data, the issue is somewhere else.
upsc ups | egrep “mfr|model|volt”
Init SSL without certificate database
battery.mfr.date: 2023/07/14
battery.voltage: 13.5
battery.voltage.nominal: 12.0
device.mfr: American Power Conversion
device.model: Back-UPS NS 675M1
input.transfer.reason: input voltage out of range
input.voltage: 122.0
input.voltage.nominal: 120
ups.mfr: American Power Conversion
ups.mfr.date: 2022/05/03
ups.model: Back-UPS NS 675M1
