rainmeter is just windows. And I was thinking more of getting the info he wants to display on a desktop rather than a small screen. Ok, so, maybe not an exact match to OPs request … but something that I will be looking at for my setup.
And, ok, maybe a different thread would have been more appropriate.
Meanwhile i have converted the bash to a python, trying to give it a better and solid structure.
What i really understimated is the fact will be really hard use a so small screen for every usefull info i’m starting improving info from pool (using pool.query), and i don’t know where put data
Now i’m puzzled: at beginning was sure to put it on an unused 5.25" slot… but maybe i can use a long cable and put it under one of the monitor of main pc
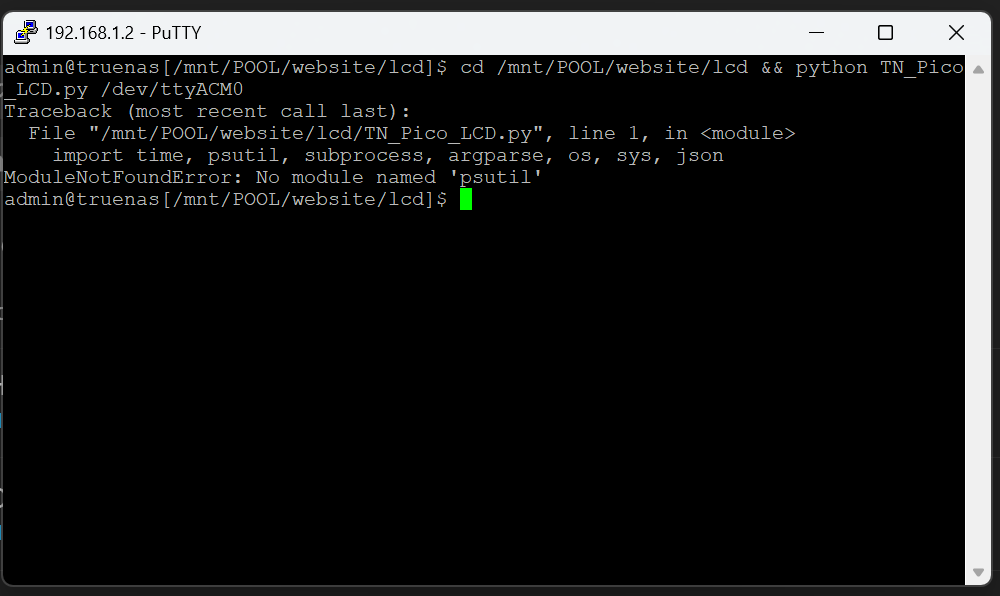
because i see this error when i try? am i make mistake?
by the way i use 25.04-RC.1 and i see Jira i dont know that jira report is have corelation or not (sorry for my poor english)
was just saying that the only thing come into my mind was that they remove psutil from Fangtooth, the ticket you mention not confirm that but i think is.
I will made some test, i have a small VM with Fangtooth, in case is just a matter of find another solution that work nor with EEL and Fangtooth
I have a water cooler that has a small 2-digit LCD on top of it.
I have already managed to communicate with it, but my problem is how to get the correct temperature that is displayed on the dashboard. I am using lm-sensors, but it clearly shows the CPU temperature is wrong. The sensors show me 37~40º but in reality the CPU is at 78~80º, which is correct, and what is being displayed on the dashboard.
Could someone tell me how I can get the CPU temperature that is being displayed on the dashboard?
It can be done in shell.
there are 2 versions now on github, grab this one instead of the other:
I have removed psutil, tried another way to retrieve data but honestly i don’t have a proper test environment to check if is data are realistic or not.
Give it a try and let me know
i used sensor and didn’t have those problem honestly… nor using bash and python.
Wanna share the code, i will check on my system too
This sounds like an interesting little project. I’d have to 3D print some sort of surface mounted faceplate as I do not have any openings in my case for front mounted anything.
Rotating thru cpu temp, unused RAM, a few other useful data to have at a glance would really round out the setup. And of course I would want to take it to the next level by including a drive serial number if one needs to be replaced. Who needs a console? but seriously, I think I do want to take a stab at this. Time to look up that display to get some dimensions.
i’m already considering to buy a 20x4 display because 16x2 is quite small, just 3€ with the l2c on aliexpress and double space available
Scripts will need some adjustement, but i don’t see any problem to manage 2 different versions… so everyone can grab the version optimized for his display.
Despite, ZFS math is hard… the data i display is not 100% correct, but is a good rappresentation of the reality
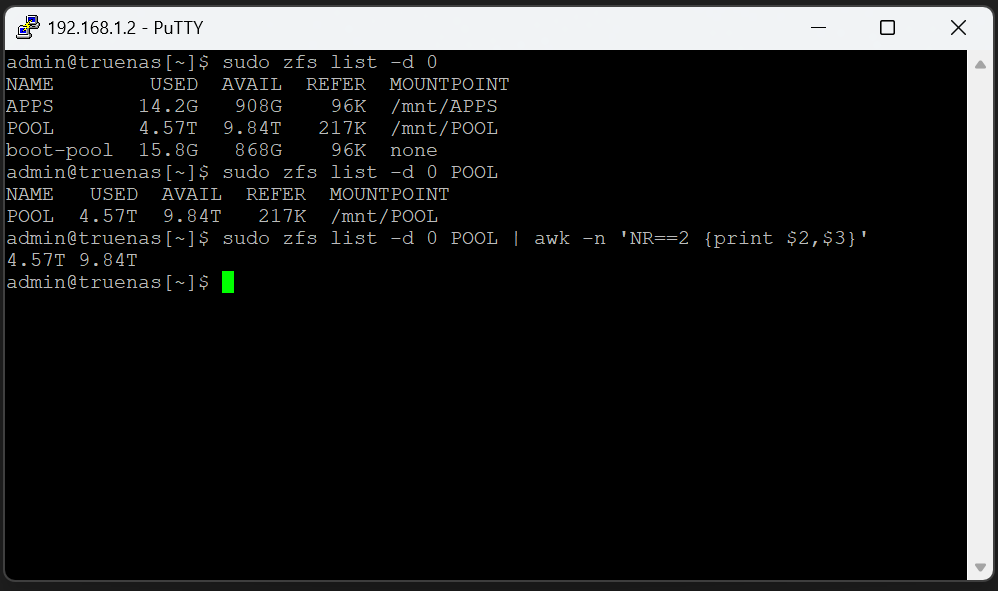
Yes but don’t do math if you use zpool list. It will list in PiB/TiB/GiB/MiB etc. Pretty easy to list when it states 14.5T and no math. Or you could use the value from pool.query which is also listed in bytes, just divide by 1024 until you have 3 or 4 most significant digits remaining and that scales to PiB/TiB/GiB/MiB, etc… The same value as zpool list returns.
This give me the same result as zpool list as you already pointed, but for the stripe and mirrored pool, this seems ok… For the raidz2 pool both are ~6tib and not what I would expect (~4tib)