I am getting the following alert but can not see the problem anywhere other than the alert email.
New alerts:
Device: /dev/sdg [SAT], 12 Offline uncorrectable sectors.
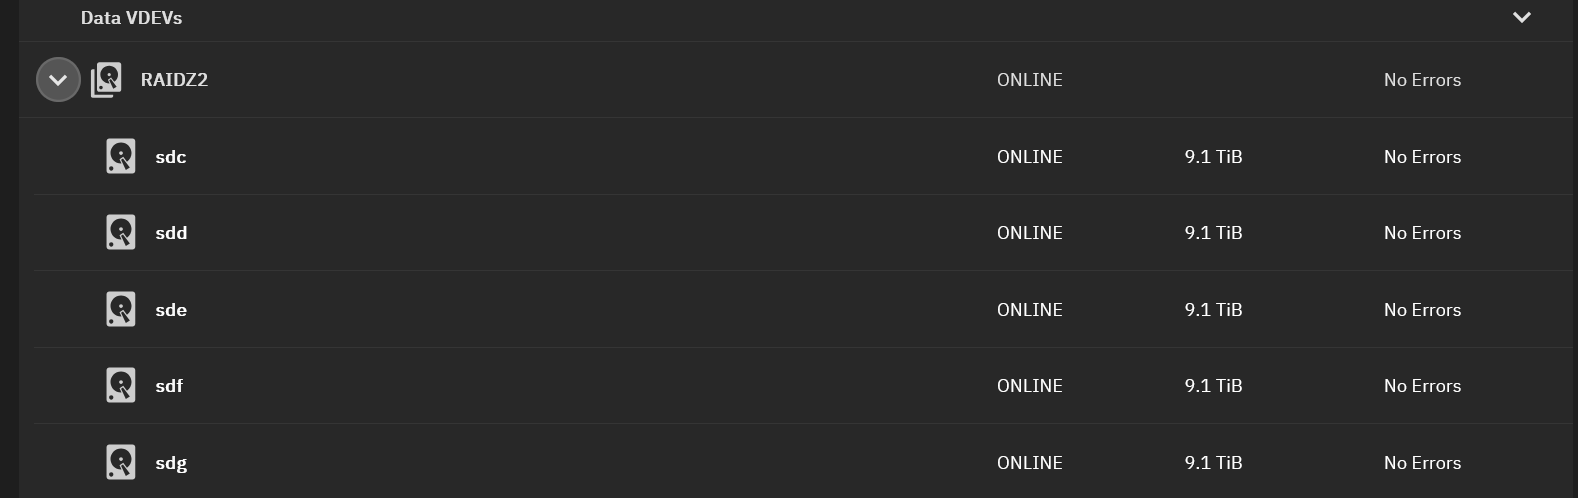
But see this in the storage area.
Is there some other place I need to look? Note the Dashboard does not show any errors either.
Try running a Long SMART test on that drive and seeing if anything comes up.
dan
December 3, 2024, 4:42pm
3
There’s no reason to expect that a SMART error (which is what you’re seeing) would correlate with a pool error, which is what would show in the areas you’re looking at. I thought there was a way in the GUI to show SMART status, but I’m not seeing it now. But from the command line, run smartctl -x /dev/sdg and post the complete output.
1 Like
DjP-iX
December 3, 2024, 4:53pm
4
Go to Storage > Disks . Expand a disk row and click S.M.A.R.T. Test Results .
dan
December 3, 2024, 5:19pm
5
But that only shows the results of SMART self-tests, not all the attributes, right?
DjP-iX
December 3, 2024, 5:30pm
6
I believe on a failed test you should be able to click the Status icon to view logs, which will give further details
=== START OF INFORMATION SECTION ===
Device Model:     HUH721010ALE601
Serial Number:    7JG62ARC
LU WWN Device Id: 5 000cca 266c2c308
Firmware Version: LHGL0003
User Capacity:    10,000,831,348,736 bytes [10.0 TB]
Sector Sizes:     512 bytes logical, 4096 bytes physical
Rotation Rate:    7200 rpm
Form Factor:      3.5 inches
Device is:        Not in smartctl database 7.3/5528
ATA Version is:   ACS-2, ATA8-ACS T13/1699-D revision 4
SATA Version is:  SATA 3.2, 6.0 Gb/s (current: 6.0 Gb/s)
Local Time is:    Tue Dec  3 12:42:48 2024 EST
SMART support is: Available - device has SMART capability.
SMART support is: Enabled
AAM feature is:   Unavailable
APM feature is:   Disabled
Rd look-ahead is: Enabled
Write cache is:   Enabled
DSN feature is:   Unavailable
ATA Security is:  Disabled, NOT FROZEN [SEC1], Master PW ID: 0xfffd
Wt Cache Reorder: Enabled

=== START OF READ SMART DATA SECTION ===
SMART overall-health self-assessment test result: PASSED

General SMART Values:
Offline data collection status:  (0x82) Offline data collection activity
                                        was completed without error.
                                        Auto Offline Data Collection: Enabled.
Self-test execution status:      ( 249) Self-test routine in progress...
                                        90% of test remaining.
Total time to complete Offline
data collection:                (   93) seconds.
Offline data collection
capabilities:                    (0x5b) SMART execute Offline immediate.
                                        Auto Offline data collection on/off support.
                                        Suspend Offline collection upon new
                                        command.
                                        Offline surface scan supported.
                                        Self-test supported.
                                        No Conveyance Self-test supported.
                                        Selective Self-test supported.
SMART capabilities:            (0x0003) Saves SMART data before entering
                                        power-saving mode.
                                        Supports SMART auto save timer.
Error logging capability:        (0x01) Error logging supported.
                                        General Purpose Logging supported.
Short self-test routine
recommended polling time:        (   1) minutes.
Extended self-test routine
recommended polling time:        (   1) minutes.
SCT capabilities:              (0x003d) SCT Status supported.
                                        SCT Error Recovery Control supported.
                                        SCT Feature Control supported.
                                        SCT Data Table supported.

SMART Attributes Data Structure revision number: 16
Vendor Specific SMART Attributes with Thresholds:
ID# ATTRIBUTE_NAME          FLAGS    VALUE WORST THRESH FAIL RAW_VALUE
  1 Raw_Read_Error_Rate     PO-R--   100   100   016    -    0
  2 Throughput_Performance  P-S---   134   134   054    -    96
  3 Spin_Up_Time            POS---   150   150   024    -    418 (Average 458)
  4 Start_Stop_Count        -O--C-   100   100   000    -    271
  5 Reallocated_Sector_Ct   PO--CK   100   100   005    -    0
  7 Seek_Error_Rate         PO-R--   100   100   067    -    0
  8 Seek_Time_Performance   P-S---   128   128   020    -    18
  9 Power_On_Hours          -O--C-   093   093   000    -    50901
 10 Spin_Retry_Count        PO--C-   100   100   060    -    0
 12 Power_Cycle_Count       -O--CK   100   100   000    -    82
 22 Unknown_Attribute       PO---K   100   100   025    -    100
 45 Unknown_Attribute       PO---K   100   100   001    -    1095233372415
192 Power-Off_Retract_Count -O--CK   099   099   000    -    1201
193 Load_Cycle_Count        -O--C-   099   099   000    -    1201
194 Temperature_Celsius     -O----   139   139   000    -    43 (Min/Max 18/55)
196 Reallocated_Event_Count -O--CK   100   100   000    -    0
197 Current_Pending_Sector  -O---K   100   100   000    -    0
198 Offline_Uncorrectable   ---R--   100   100   000    -    12
199 UDMA_CRC_Error_Count    -O-R--   200   200   000    -    0
231 Temperature_Celsius     -O--CK   100   100   000    -    0
241 Total_LBAs_Written      -O--C-   100   100   000    -    5743100120586
242 Total_LBAs_Read         -O--C-   100   100   000    -    4945634658774
                            ||||||_ K auto-keep
                            |||||__ C event count
                            ||||___ R error rate
                            |||____ S speed/performance
                            ||_____ O updated online
                            |______ P prefailure warning

General Purpose Log Directory Version 1
SMART           Log Directory Version 1 [multi-sector log support]
Address    Access  R/W   Size  Description
0x00       GPL,SL  R/O      1  Log Directory
0x01           SL  R/O      1  Summary SMART error log
0x02           SL  R/O      1  Comprehensive SMART error log
0x03       GPL     R/O      1  Ext. Comprehensive SMART error log
0x04       GPL     R/O    256  Device Statistics log
0x04       SL      R/O    255  Device Statistics log
0x06           SL  R/O      1  SMART self-test log
0x07       GPL     R/O      1  Extended self-test log
0x08       GPL     R/O      2  Power Conditions log
0x09           SL  R/W      1  Selective self-test log
0x0c       GPL     R/O   5501  Pending Defects log
0x10       GPL     R/O      1  NCQ Command Error log
0x11       GPL     R/O      1  SATA Phy Event Counters log
0x12       GPL     R/O      1  SATA NCQ Non-Data log
0x13       GPL     R/O      1  SATA NCQ Send and Receive log
0x15       GPL     R/W      1  Rebuild Assist log
0x21       GPL     R/O      1  Write stream error log
0x22       GPL     R/O      1  Read stream error log
0x24       GPL     R/O    256  Current Device Internal Status Data log
0x25       GPL     R/O    256  Saved Device Internal Status Data log
0x30       GPL,SL  R/O      9  IDENTIFY DEVICE data log
0x80       GPL     R/W    688  Host vendor specific log
0x81-0x9f  GPL,SL  R/W     16  Host vendor specific log
0xb2       GPL     VS     688  Device vendor specific log
0xc8       GPL     VS      12  Device vendor specific log
0xe0       GPL,SL  R/W      1  SCT Command/Status
0xe1       GPL,SL  R/W      1  SCT Data Transfer

SMART Extended Comprehensive Error Log Version: 1 (1 sectors)
Device Error Count: 8 (device log contains only the most recent 4 errors)
        CR     = Command Register
        FEATR  = Features Register
        COUNT  = Count (was: Sector Count) Register
        LBA_48 = Upper bytes of LBA High/Mid/Low Registers ]  ATA-8
        LH     = LBA High (was: Cylinder High) Register    ]   LBA
        LM     = LBA Mid (was: Cylinder Low) Register      ] Register
        LL     = LBA Low (was: Sector Number) Register     ]
        DV     = Device (was: Device/Head) Register
        DC     = Device Control Register
        ER     = Error register
        ST     = Status register
Powered_Up_Time is measured from power on, and printed as
DDd+hh:mm:SS.sss where DD=days, hh=hours, mm=minutes,
SS=sec, and sss=millisec. It "wraps" after 49.710 days.

Error 8 [3] occurred at disk power-on lifetime: 9509 hours (396 days + 5 hours)
  When the command that caused the error occurred, the device was doing SMART Offline or Self-test.

  After command completion occurred, registers were:
  ER -- ST COUNT  LBA_48  LH LM LL DV DC
  -- -- -- == -- == == == -- -- -- -- --
  40 -- 51 00 80 00 00 25 9f b3 78 40 00  Error: UNC 128 sectors at LBA = 0x259fb378 = 631223160

  Commands leading to the command that caused the error were:
  CR FEATR COUNT  LBA_48  LH LM LL DV DC  Powered_Up_Time  Command/Feature_Name
  -- == -- == -- == == == -- -- -- -- --  ---------------  --------------------
  25 00 00 08 00 00 00 25 9f ab f8 e0 08  2d+14:19:01.638  READ DMA EXT
  27 00 00 00 00 00 00 00 00 00 00 e0 08  2d+14:19:01.593  READ NATIVE MAX ADDRESS EXT [OBS-ACS-3]
  ec 00 00 00 00 00 00 00 00 00 00 a0 08  2d+14:19:01.593  IDENTIFY DEVICE
  ef 00 03 00 46 00 00 00 00 00 00 a0 08  2d+14:19:01.549  SET FEATURES [Set transfer mode]
  27 00 00 00 00 00 00 00 00 00 00 e0 08  2d+14:19:01.533  READ NATIVE MAX ADDRESS EXT [OBS-ACS-3]

Error 7 [2] occurred at disk power-on lifetime: 9509 hours (396 days + 5 hours)
  When the command that caused the error occurred, the device was doing SMART Offline or Self-test.

  After command completion occurred, registers were:
  ER -- ST COUNT  LBA_48  LH LM LL DV DC
  -- -- -- == -- == == == -- -- -- -- --
  40 -- 51 00 80 00 00 25 9f b3 78 40 00  Error: UNC 128 sectors at LBA = 0x259fb378 = 631223160

  Commands leading to the command that caused the error were:
  CR FEATR COUNT  LBA_48  LH LM LL DV DC  Powered_Up_Time  Command/Feature_Name
  -- == -- == -- == == == -- -- -- -- --  ---------------  --------------------
  25 00 00 08 00 00 00 25 9f ab f8 e0 08  2d+14:19:01.438  READ DMA EXT
  25 00 00 04 00 00 04 2e e4 e5 b0 e0 08  2d+14:19:01.406  READ DMA EXT
  35 00 00 00 08 00 02 fd 0a 17 b8 e0 08  2d+14:19:01.406  WRITE DMA EXT
  35 00 00 00 18 00 02 fd 57 04 28 e0 08  2d+14:19:01.405  WRITE DMA EXT
  35 00 00 08 00 00 02 fd 56 fc 28 e0 08  2d+14:19:01.401  WRITE DMA EXT

Error 6 [1] occurred at disk power-on lifetime: 9509 hours (396 days + 5 hours)
  When the command that caused the error occurred, the device was doing SMART Offline or Self-test.

  After command completion occurred, registers were:
  ER -- ST COUNT  LBA_48  LH LM LL DV DC
  -- -- -- == -- == == == -- -- -- -- --
  40 -- 51 00 80 00 00 25 9f b3 78 40 00  Error: UNC 128 sectors at LBA = 0x259fb378 = 631223160

  Commands leading to the command that caused the error were:
  CR FEATR COUNT  LBA_48  LH LM LL DV DC  Powered_Up_Time  Command/Feature_Name
  -- == -- == -- == == == -- -- -- -- --  ---------------  --------------------
  25 00 00 08 00 00 00 25 9f ab f8 e0 08  2d+14:19:01.146  READ DMA EXT
  27 00 00 00 00 00 00 00 00 00 00 e0 08  2d+14:19:01.067  READ NATIVE MAX ADDRESS EXT [OBS-ACS-3]
  ec 00 00 00 00 00 00 00 00 00 00 a0 08  2d+14:19:01.067  IDENTIFY DEVICE
  ef 00 03 00 46 00 00 00 00 00 00 a0 08  2d+14:19:00.879  SET FEATURES [Set transfer mode]
  27 00 00 00 00 00 00 00 00 00 00 e0 08  2d+14:19:00.858  READ NATIVE MAX ADDRESS EXT [OBS-ACS-3]

Error 5 [0] occurred at disk power-on lifetime: 9509 hours (396 days + 5 hours)
  When the command that caused the error occurred, the device was doing SMART Offline or Self-test.

  After command completion occurred, registers were:
  ER -- ST COUNT  LBA_48  LH LM LL DV DC
  -- -- -- == -- == == == -- -- -- -- --
  40 -- 51 00 80 00 00 25 9f b3 78 40 00  Error: UNC 128 sectors at LBA = 0x259fb378 = 631223160

  Commands leading to the command that caused the error were:
  CR FEATR COUNT  LBA_48  LH LM LL DV DC  Powered_Up_Time  Command/Feature_Name
  -- == -- == -- == == == -- -- -- -- --  ---------------  --------------------
  25 00 00 08 00 00 00 25 9f ab f8 e0 08  2d+14:19:00.821  READ DMA EXT
  35 00 00 00 18 00 02 fd 54 89 b0 e0 08  2d+14:19:00.795  WRITE DMA EXT
  35 00 00 08 00 00 02 fd 54 81 b0 e0 08  2d+14:19:00.790  WRITE DMA EXT
  35 00 00 08 00 00 02 fd 54 79 b0 e0 08  2d+14:19:00.786  WRITE DMA EXT
  35 00 00 08 00 00 02 fd 54 71 b0 e0 08  2d+14:19:00.772  WRITE DMA EXT

SMART Extended Self-test Log Version: 1 (1 sectors)
Num  Test_Description    Status                  Remaining  LifeTime(hours)  LBA_of_first_error
# 1  Short offline       Completed without error       00%     50888         -
# 2  Short offline       Completed without error       00%     50864         -
# 3  Short offline       Completed without error       00%     50840         -
# 4  Short offline       Completed without error       00%     50816         -
# 5  Short offline       Completed without error       00%     50792         -
# 6  Short offline       Completed without error       00%     50768         -
# 7  Short offline       Completed without error       00%     50744         -
# 8  Short offline       Completed without error       00%     50720         -
# 9  Short offline       Completed without error       00%     50696         -
#10  Short offline       Completed without error       00%     50672         -
#11  Short offline       Completed without error       00%     50648         -
#12  Short offline       Completed without error       00%     50624         -
#13  Short offline       Completed without error       00%     50600         -
#14  Short offline       Completed without error       00%     50576         -
#15  Short offline       Completed without error       00%     50552         -
#16  Short offline       Completed without error       00%     50529         -
#17  Short offline       Completed without error       00%     50505         -
#18  Short offline       Completed without error       00%     50481         -
#19  Short offline       Completed without error       00%     50457         -

SMART Selective self-test log data structure revision number 1
 SPAN  MIN_LBA  MAX_LBA  CURRENT_TEST_STATUS
    1        0        0  Not_testing
    2        0        0  Not_testing
    3        0        0  Not_testing
    4        0        0  Not_testing
    5        0        0  Not_testing
Selective self-test flags (0x0):
  After scanning selected spans, do NOT read-scan remainder of disk.
If Selective self-test is pending on power-up, resume after 0 minute delay.

SCT Status Version:                  3
SCT Version (vendor specific):       256 (0x0100)
Device State:                        DST executing in background (3)
Current Temperature:                    43 Celsius
Power Cycle Min/Max Temperature:     37/43 Celsius
Lifetime    Min/Max Temperature:     18/55 Celsius
Under/Over Temperature Limit Count:   0/0

SCT Temperature History Version:     2
Temperature Sampling Period:         1 minute
Temperature Logging Interval:        1 minute
Min/Max recommended Temperature:      0/60 Celsius
Min/Max Temperature Limit:           -40/70 Celsius
Temperature History Size (Index):    128 (78)

Index    Estimated Time   Temperature Celsius
  79    2024-12-03 10:35    40  *********************
 ...    ..( 87 skipped).    ..  *********************
  39    2024-12-03 12:03    40  *********************
  40    2024-12-03 12:04    41  **********************
 ...    ..(  7 skipped).    ..  **********************
  48    2024-12-03 12:12    41  **********************
  49    2024-12-03 12:13    42  ***********************
 ...    ..( 21 skipped).    ..  ***********************
  71    2024-12-03 12:35    42  ***********************
  72    2024-12-03 12:36    43  ************************
 ...    ..(  4 skipped).    ..  ************************
  77    2024-12-03 12:41    43  ************************
  78    2024-12-03 12:42    40  *********************

SCT Error Recovery Control:
           Read: Disabled
          Write: Disabled

Device Statistics (GP Log 0x04)
Page  Offset Size        Value Flags Description
0x01  =====  =               =  ===  == General Statistics (rev 1) ==
0x01  0x008  4              82  ---  Lifetime Power-On Resets
0x01  0x010  4           50901  ---  Power-on Hours
0x01  0x018  6   5743100120586  ---  Logical Sectors Written
0x01  0x020  6      7842513647  ---  Number of Write Commands
0x01  0x028  6   4945634658774  ---  Logical Sectors Read
0x01  0x030  6      7712474360  ---  Number of Read Commands
0x01  0x038  6    183245216550  ---  Date and Time TimeStamp
0x03  =====  =               =  ===  == Rotating Media Statistics (rev 1) ==
0x03  0x008  4           49729  ---  Spindle Motor Power-on Hours
0x03  0x010  4           49729  ---  Head Flying Hours
0x03  0x018  4            1201  ---  Head Load Events
0x03  0x020  4               0  ---  Number of Reallocated Logical Sectors
0x03  0x028  4            3731  ---  Read Recovery Attempts
0x03  0x030  4               0  ---  Number of Mechanical Start Failures
0x04  =====  =               =  ===  == General Errors Statistics (rev 1) ==
0x04  0x008  4               8  ---  Number of Reported Uncorrectable Errors
0x04  0x010  4               1  ---  Resets Between Cmd Acceptance and Completion
0x05  =====  =               =  ===  == Temperature Statistics (rev 1) ==
0x05  0x008  1              43  ---  Current Temperature
0x05  0x010  1              39  N--  Average Short Term Temperature
0x05  0x018  1              38  N--  Average Long Term Temperature
0x05  0x020  1              55  ---  Highest Temperature
0x05  0x028  1              18  ---  Lowest Temperature
0x05  0x030  1              53  N--  Highest Average Short Term Temperature
0x05  0x038  1              23  N--  Lowest Average Short Term Temperature
0x05  0x040  1              51  N--  Highest Average Long Term Temperature
0x05  0x048  1              25  N--  Lowest Average Long Term Temperature
0x05  0x050  4               0  ---  Time in Over-Temperature
0x05  0x058  1              60  ---  Specified Maximum Operating Temperature
0x05  0x060  4               0  ---  Time in Under-Temperature
0x05  0x068  1               0  ---  Specified Minimum Operating Temperature
0x06  =====  =               =  ===  == Transport Statistics (rev 1) ==
0x06  0x008  4             206  ---  Number of Hardware Resets
0x06  0x010  4             294  ---  Number of ASR Events
0x06  0x018  4               0  ---  Number of Interface CRC Errors
0xff  =====  =               =  ===  == Vendor Specific Statistics (rev 1) ==
                                |||_ C monitored condition met
                                ||__ D supports DSN
                                |___ N normalized value

Pending Defects log (GP Log 0x0c)
No Defects Logged

SATA Phy Event Counters (GP Log 0x11)
ID      Size     Value  Description
0x0001  2            0  Command failed due to ICRC error
0x0002  2            0  R_ERR response for data FIS
0x0003  2            0  R_ERR response for device-to-host data FIS
0x0004  2            0  R_ERR response for host-to-device data FIS
0x0005  2            0  R_ERR response for non-data FIS
0x0006  2            0  R_ERR response for device-to-host non-data FIS
0x0007  2            0  R_ERR response for host-to-device non-data FIS
0x0008  2            0  Device-to-host non-data FIS retries
0x0009  2           17  Transition from drive PhyRdy to drive PhyNRdy
0x000a  2           12  Device-to-host register FISes sent due to a COMRESET
0x000b  2            0  CRC errors within host-to-device FIS
0x000d  2            0  Non-CRC errors within host-to-device FIS
Smart results all show success with no errors.
dan
December 3, 2024, 5:55pm
9
Though they don’t show that you’ve ever run a long test, which I’d recommend. Other than that, and that the drive’s running a little warm, I don’t see major red flags.
We see this all the time and the opposite as well, that a pool error is perceived as a drive failure.
I believe it is the status reported by SMART (PASS/FAIL), meaning the one status this I have never seen listed as anything other than PASSED. It is for a gross failure, not the ones we see daily. I’m curious if I took an old hard drive, places a drop of oil on a platter, if then the “PASSED” would change. I’m skeptical. I have a drive I can use.
@Donald_Dodier smartctl -t long /dev/sdg to start a Long test. You do not have any Long tests showing as completed. I highly recommend you run a Long test periodically (weekly is what I recommend for a Home system).
A test hasn’t failed, a value is “just” getting worse.
Reporting these events in alerts but not giving the user an option in the UI, to get more information, is not a great user experience. I hope you consider expanding on the functionality here.
DjP-iX
December 3, 2024, 7:13pm
12