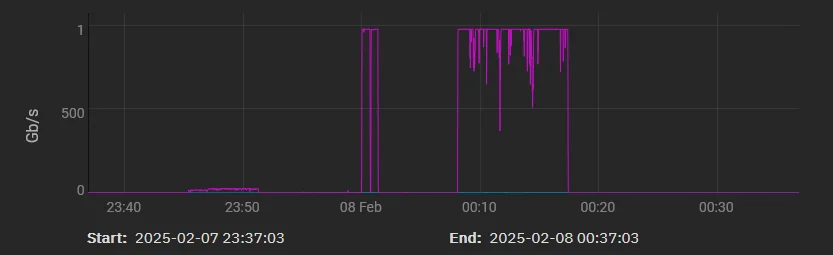
My LAN speed is abysmal (powerline networking doesn’t like my electrical cabling). I’ve just done some testing that doesn’t use the powerlines to prove to myself that there’s nothing wrong with my server’s NIC, and now my network traffic graph looks like this:
Yes, that tiny bump around 23:50 is what I normally get. Actually a little bit worse, but it’s not uncommon for me to have to powercycle the powerline adapters to fix stuff.
Anyway, with those lovely spikes, I’ve rendered my long-term network graphs pretty useless. Is there any way I can remove the offending parts of the data? Failing that, how can I reset the graphs completely?
Zooming out may not help much, because the peak will set the maximum scale. But zooming in will make a difference.
It’s only a short time you were testing if you let it out for a couple of days, it won’t matter to you until you want to look at Trends with that Time period in the window.
Yes, removing that section of the data would definitely be a nicer option. No doubt it can be done, but you going to need to go deep to find out if it’s using a database or a file etc.
@NJMorf
Digging a bit this morning, since I’m working on my server, I realise that in SCALE the graphing is now using netdata which is a fantastic open source observability tool.
If you want to pursue removing the nuisance data here’s a couple of docco pages to start poking around
Ugh, that looks like far too much work just to avoid being annoyed every now and then. I guess I’ll just ignore it in TrueNAS until whenever it decides to wipe the data again, like it did when I upgraded from Core to Scale last week. And anyway, netdata is much more useful most of the time anyway.