OS Version:TrueNAS-SCALE-24.10.2
CPU:AMD Ryzen 7 5700G with Radeon Graphics
Memory:31 GiB
Pool: 68Tb Seagate Ironwolf*
Apps: Full Starr suite, Jellyfin
Hi, I am a TrueNAS semi noob and I have a few issues that I cant seem to find decent solutions for online
After a recent rebuild I have been dubious of the statistics displayed within the UI.
CPU:
Max usage since build is reported at 37%:
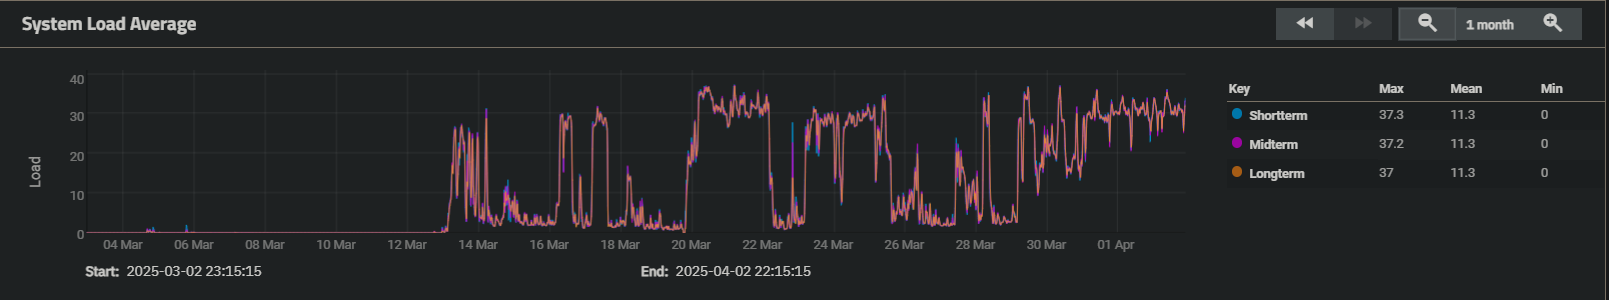
This seems low, considering the amount of processing I am doing and how slow the apps are responding/processing, I am mainly doing library scans and file transfer. my IO wait is averaging at 64% is this high and could this be my main bottleneck?
Also CPU usage per core shows 16 cores instead of the expected 8. I assumed this was fine but wanted to mention it in case it’s relevant.
Network:
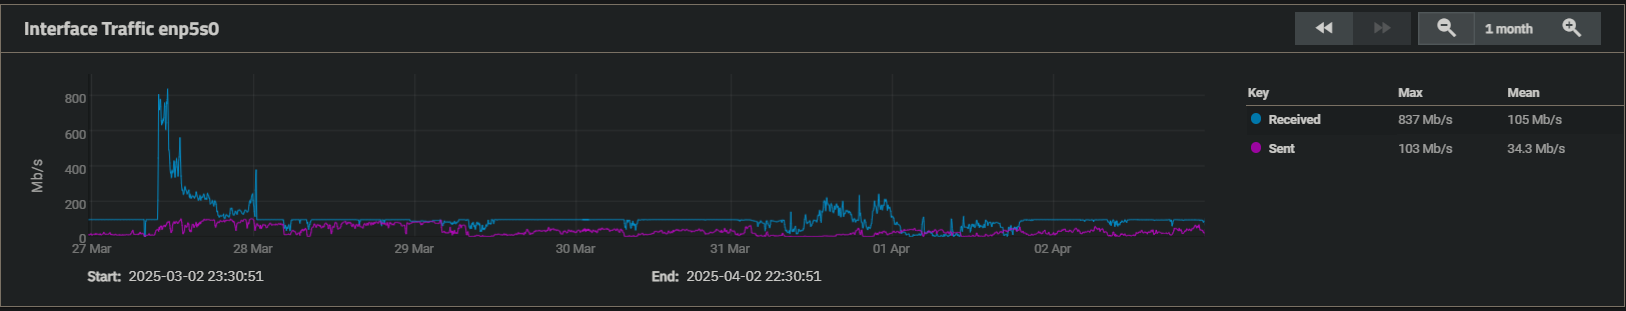
I am connected via ethernet that should be capable of 1000Mbps, after a restart it can pull higher than 100Mbps but quickly gets capped out at 100Mbps, I assumed this might be ISP throttling, However all of the apps that are connected to the internet (Qbit, SabNZBD) only show a network draw of less than 30Mbps combined through the apps page in the UI and within the apps themselves. I cant think what might be causing it to max out at 100Mbps.
GPU:
Any way to show GPU usage or monitor it without SSH?
Are these related, a known bug, or am I paranoid/dumb?
Thanks!