So, after some testing, I’ve collected a bunch of data that I perhaps need some help interpreting.
I ran fio a bunch of times, like… a lot! And wrote the results into an Excel spreadsheet.
In an attempt to keep it kinda structured, I’ve decided to split the following wall of text into:
- Reason for testing in the first place
- Method - how I tested and why I did it this way
- Results - some of them. Ran the same tests for more than 344 times
- Analysis - My thoughts and perhaps some questions
- Conclusions / other considerations - Where I’m at and how to move forward
But first, at teaser:
1. Reason for testing in the first place
- For the lulz, not gonna lie! I just wanted to see, how fast this thing really was, though impractical, still cool in my view.
- It’s not everyday, that you have the chance to test out / toy with the characteristics of almost 100x SATA SSDs. I thought, I’d might learn something, I could apply, if I decided to make CrazyNAS somewhat practical in the long run.
- I knew beforehand, that an 8-drive wide vdev was recommended, but I wanted to see - with ‘my own eyes’, how it looked when you went from 1-drive to i.e 20-drives. Kinda. I didn’t test it like that, for the sake of my own sanity, but I’ll go through the long winded explaination in the next section.
Which brings me to:
2. Method - how I tested and why
On Windows I’m quite familiar / used to CrystalDiskMark [CDM]. I don’t know a lot about testing drives and I’m not going to pretend, that I have any other reason to just do what everybody else does. It might not be the ‘correct’ way to go about it, but I thought it’d make it easier to compare, since ‘everybody else’ is using CDM.
Though I use macOS, as my daily driver, I’m very multilingual - though not fluid - into other os’es. TrueNAS and therefore by extension somewhat FreeBSD. Ubuntu, both desktop (I have a Lenovo Tiny which is set up to dual-boot into either Window or Ubuntu) and server (mostly vm’s, or rather, just vm’s). I’m by no means an expert, but I dabble and are very good at googling and copy-pasting other peoples instructions. That’s about it.
In macOS my goto for drive testing is BlackMagic Designs Disk Speed Test - I know,… I know.
The only thing I knew of, that made it possible to run something kinda CDM-like on TrueNAS was/is fio with flags that was supposed to match CDM’s tests.
I know I might have screwed up big time here, but I’m presenting the commands I ran, so other people can chime in or give advice:
fio run - examples:
fio --bs=1M --direct=1 --directory=/mnt/CN-04R2/ --iodepth=8 --group_reporting --name=SEQ1MQ8T1_R --numjobs=1 --ramp_time=10 --runtime=60 --rw=read --size=1GiB --time_based
fio --bs=4K --direct=1 --directory=/mnt/CN-04R2/ --iodepth=32 --group_reporting --name=RND4KQ32T1_R --numjobs=1 --ramp_time=10 --runtime=60 --rw=randread --size=1GiB --time_based
Explainer for variables/flags:
I tried to read up on CDM’s documentation and was left with the impression, that I could ‘just’ match with the following flags:
iodepth with queue depth
bs: block size was set to either ‘1M’ or ‘4K’.
direct: I was under the impression, that with ‘direct’ set to 1 (true), I would bypass any caching and therefore get the true ‘direct to drive’-performance result. There I also used:
sync=1: which I took for ‘forcing’ a sync directly to the drive or file system. It tanked my results and meant that almost every write with the sync=1 flag is extremely low. I consider this an absolute worst case scenario, though not realistic. I’m not sure, if I should have done this with read as well? I did a few tests and didn’t see a difference, so I chose not to. That might’d been a mistake, when this decision was based on only a couple of tests.
numjobs: was set to ‘=1’, since CDM is also single thread, or at least, that’s how I understood it. Might also be a mistake. More on that later.
ramp time: 10 seconds
run time: 60 secons
size: 1GiB - this might have meant I’d just be testing the cache performance, but most files I use is rarely over 1GiB except for large video files or ISO’s (individual files from my Atem switcher). We’re talking minutes here, when transferring anyways, so 1 GiB seemed reasonable because that’s also my default setting in CDM. So, 1GB (or there around) to match.
Before running each disk config I decided to do it twice. One with ‘default settings’ in TrueNAS and then again with cacing disable:
zfs get primarycache CN-04R2 ; zfs get secondarycache CN-04R2
Then:
zfs set primarycache=none CN-04R2 ; zfs set secondarycache=none CN-04R2
And then ‘get’ again, just to double-check the status.
I call this (along with: direct=1 and sync=1) ‘bare metal’. Though it may be the wrong terminology, I use this definition to communicate my intents behind the tests.
So, to sum it up: I tried to match CDMs params for drive tests using flags in fio to match - best to my knowledge and understanding. Did every test twice (and in some instances thrice, just to double-check potential outliers or me forgetting to chance a flag somewhere):
- ‘default’, with no changes as to how TrueNAS (Core) normally operates
- ‘bare metal’, to get as close to ‘real drive’-performance as possible.
The idea was to test both scaling and characteristics in both a ‘default/best case’ envoirenment and ‘worst case’-scenario.
Onto the results then:
3. Results - some of them. Ran the same tests for more than 344 times
I noted every result into an Excel spreadsheet, because I’m a math teacher and Excel is awesome. Anyone who says otherwise is just plain wrong! 
A note, about notation:
CN = CrazyNAS
00 = Number of drives in config
S, M, R1, R2 and R3 = Stripe, Mirror, RaidZ1, -Z2 and -Z3 respectively.
All numbers are in MB/s and not MiB/s (fio reports the final result as both, but I chose to write down MB/s as per CDM-likeness-reasoning, feel free to be bothered if I’m wrong - I didn’t do it to offend anyone and please tell me, if it’s totally the wrong way to do it).
Example:
| CN-01 /da0 (0,0) |
|
|
| Test |
Read |
Write |
| SEQ1M, Q8T1 |
303 |
135 |
| SEQ1M, Q1T1 |
307 |
135 |
| RND4K, Q32T1 |
19 |
18 |
| RND4K, Q1T1 |
19 |
15 |
1-disk config, device level test before adding the drive to a vdev/pool. The numbers in the parenthesis is the drives ‘coordinates’ as seen from the HBA. I’m not using this notation in the ‘main results’ I’m presenting, but I just wanted to tell you what it means.
(0,0) = first port on HBA and first backplane on that port.
(1,1) = second port on HBA and second backplane (cascaded) from that port.
I did these tests first, to see if placement as seen from the HBA made any difference whatsoever. To my surprise, it actually did.
| CN-01 / 128GB (0,0) |
|
|
| Test |
Read |
Write |
| SEQ1M, Q8T1 |
366 |
54 |
| SEQ1M, Q1T1 |
356 |
43 |
| RND4K, Q32T1 |
3 |
1 |
| RND4K, Q1T1 |
3 |
1 |
| CN-01 / 128GB (0,1) |
|
|
| Test |
Read |
Write |
| SEQ1M, Q8T1 |
356 |
47 |
| SEQ1M, Q1T1 |
350 |
41 |
| RND4K, Q32T1 |
3 |
1 |
| RND4K, Q1T1 |
3 |
1 |
(flags: --direct=1, --sync=1 and cache disabled)
I ran this test a couple of times with different drives and different locations on the backplanes. I’m not going to copy-paste every result, but they were pretty much the same.
Placing a drive one backplane down the chain meant losing around 10-12 MB/s sequential performance in the high end and around 3-5 MB/s in the low end (referring to queue depth here). Not that it matters in the bigger picture, but it was something to have in mind if margins where going to have any effect.
Spent some time on it, drew my conclusions and moved along.
| CN-04S |
|
|
| Test |
Read |
Write |
| SEQ1M, Q8T1 |
592 |
49 |
| SEQ1M, Q1T1 |
573 |
42 |
| RND4K, Q32T1 |
4 |
1 |
| RND4K, Q1T1 |
4 |
1 |
| CN-04M |
|
|
| Test |
Read |
Write |
| SEQ1M, Q8T1 |
660 |
28 |
| SEQ1M, Q1T1 |
634 |
23 |
| RND4K, Q32T1 |
4 |
1 |
| RND4K, Q1T1 |
4 |
1 |
(flags: --direct=1, --sync=1 and cache disabled)
4-drive stripe vs. 4-drive mirror, worst case scenario.
Just wanted to see, how they performed, before moving on to the larger vdev configs.
From now on, theres going to be some effort required on the readers part, but I’m going to try my best to explain what you’re being presented with.
Let’s start with an example:
| CN-08S |
|
|
| Test |
Read |
Write |
| SEQ1M, Q8T1 |
527 |
53 |
| SEQ1M, Q1T1 |
654 |
50 |
| RND4K, Q32T1 |
4 |
1 |
| RND4K, Q1T1 |
4 |
1 |
| CN-08S |
|
|
| Test |
Read |
Write |
| SEQ1M, Q8T1 |
3908 |
5113 |
| SEQ1M, Q1T1 |
3895 |
5028 |
| RND4K, Q32T1 |
212 |
404 |
| RND4K, Q1T1 |
211 |
445 |
From my terminology descriped earlier, this is supposed to be the same config, right? So why are the numbers different? One of them is ‘bare metal’ and the other is ‘as is / default behaviour’. If you have any doubts: almost every ‘bare metal’ has terrible random performance. Like: ‘What’s wrong with the drives?!’-terrible. I’m not going to make any guesses, but If you’re confused, just look at random performance. It’s pretty much guarenteed to be terrible when it’s ‘bare metal’.
Anywho. Let’s compare an 8-drive stripe with 8-drive mirror (‘bare metal’):
| CN-08S |
|
|
| Test |
Read |
Write |
| SEQ1M, Q8T1 |
527 |
53 |
| SEQ1M, Q1T1 |
654 |
50 |
| RND4K, Q32T1 |
4 |
1 |
| RND4K, Q1T1 |
4 |
1 |
| CN-08M |
|
|
| Test |
Read |
Write |
| SEQ1M, Q8T1 |
693 |
23 |
| SEQ1M, Q1T1 |
660 |
26 |
| RND4K, Q32T1 |
4 |
1 |
| RND4K, Q1T1 |
4 |
1 |
Same comparison but ‘default’-behaviour:
| CN-08S |
|
|
| Test |
Read |
Write |
| SEQ1M, Q8T1 |
3908 |
5113 |
| SEQ1M, Q1T1 |
3895 |
5028 |
| RND4K, Q32T1 |
212 |
404 |
| RND4K, Q1T1 |
211 |
445 |
| CN-08M |
|
|
| Test |
Read |
Write |
| SEQ1M, Q8T1 |
3885 |
6541 |
| SEQ1M, Q1T1 |
3902 |
6057 |
| RND4K, Q32T1 |
286 |
520 |
| RND4K, Q1T1 |
204 |
592 |
Oh! Interesting. I’m not drawing any conlusions yet, since I’ve already looked at the numbers and also you should know, I didn’t do it in the order I’m presenting it in right here.
But. It appears as if, theres no discernible difference. There is ‘some’ variance, but according to fio, sequential write is faster in ‘bare metal’-stripe.
It’s the other way around with default behaviour (~6 GB/s vs ~5 GB/s).
Read in default is around the same for 8-drive stripe vs. 8-drive mirror, but for some reason 8-stripe ‘bare metal’ SEQ1M Q8T1 is a little slower.
Ran this particular test a couple of times with different drives. It was always around 500 MB/s for CN-08S, SEQ1M Q8T1. One of the runs was as low as 480 MB/s. Everything else was about the same except for some minute variance which - that’ll become apperant later - itsn’t that important.
Fastest ‘bare metal’ RaidZ-level with 8 drives?
| CN-08R1 |
|
|
| Test |
Read |
Write |
| SEQ1M, Q8T1 |
746 |
52 |
| SEQ1M, Q1T1 |
725 |
53 |
| RND4K, Q32T1 |
7 |
1 |
| RND4K, Q1T1 |
6 |
1 |
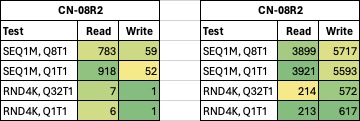
| CN-08R2 |
|
|
| Test |
Read |
Write |
| SEQ1M, Q8T1 |
783 |
59 |
| SEQ1M, Q1T1 |
918 |
52 |
| RND4K, Q32T1 |
7 |
1 |
| RND4K, Q1T1 |
6 |
1 |
| CN-08R3 |
|
|
| Test |
Read |
Write |
| SEQ1M, Q8T1 |
727 |
56 |
| SEQ1M, Q1T1 |
794 |
58 |
| RND4K, Q32T1 |
6 |
1 |
| RND4K, Q1T1 |
6 |
1 |
Also, kinda interesting. Didn’t expect that much (though, not that much) of a difference.
RaidZ2 appears to strike the best balance between resilience and performance. I guess we already knew that, but that’s ‘bare metal’. How about TrueNAS’ default behaviour?
| CN-08R1 |
|
|
| Test |
Read |
Write |
| SEQ1M, Q8T1 |
3881 |
4934 |
| SEQ1M, Q1T1 |
3875 |
5102 |
| RND4K, Q32T1 |
212 |
351 |
| RND4K, Q1T1 |
212 |
365 |
| CN-08R2 |
|
|
| Test |
Read |
Write |
| SEQ1M, Q8T1 |
3899 |
5717 |
| SEQ1M, Q1T1 |
3921 |
5593 |
| RND4K, Q32T1 |
214 |
572 |
| RND4K, Q1T1 |
213 |
617 |
| CN-08R3 |
|
|
| Test |
Read |
Write |
| SEQ1M, Q8T1 |
3880 |
5305 |
| SEQ1M, Q1T1 |
3886 |
5397 |
| RND4K, Q32T1 |
212 |
476 |
| RND4K, Q1T1 |
212 |
484 |
Well. This pretty much confirms it for me. 8-drives with two parity drives seems to be the sweet spot. Of course, one could argue, that it’s a waste of drive space but I also see the appeal if you’re building out your pool over time.
8-drives means great performance and adding 8 drives to an existing 8-drive config is waaay more practical than ie. 24 drives at a time. You also get the benefit of drives falling in price over time, which could be made into a point about starting with for instance, 3-4 TB drives and by the time you’ve filled the entire backplane or whatever, you’ve effectively trippled the totalt capacity if the next set of drives are +8 TB drives.
[INSERT from EDIT] When reading this part back, I can see I made a terrible explainer. What I meant was: You start out with i.e. 8x 4 TB drives in RaidZ2. Then, when drives fall in price, the next ‘set’ of drives could be 8x 8TB in RaidZ2 (~48 TB). You’ll go from ~24 TB usable storage to 24 TB + 48 TB = 72 TB, which is tripple that of 24 TB that you started out with. Next ‘set’ could be 8x 16TB ~96 TB, which then brings the total up to 72 + 92 = 168 TB. That last one doesn’t scale perfectly with “three times the previous…”-statement. I just meant: Starting out with 3-4 TB drives in a 8-drive wide vdev is great, and then hard drives has fallen in price, the next set could potentially tripple your starting capacity."
[/INSERT from EDIT]
Also. It makes your pool less vulnerable in case of a drive failure. You’re just resilvering an 8-drive wide vdev instead of a 24-drive wide vdev or even 48-drive wide.
So… how about performance, when you scale beyond 8 drives? Let’s start with 4 drives wide R2 ‘bare metal’ and add 4 drives (yes, the 8-drive one is the same as the one above):
| CN-04R2 |
|
|
| Test |
Read |
Write |
| SEQ1M, Q8T1 |
688 |
27 |
| SEQ1M, Q1T1 |
751 |
28 |
| RND4K, Q32T1 |
5 |
1 |
| RND4K, Q1T1 |
5 |
1 |
| CN-08R2 |
|
|
| Test |
Read |
Write |
| SEQ1M, Q8T1 |
783 |
59 |
| SEQ1M, Q1T1 |
918 |
52 |
| RND4K, Q32T1 |
7 |
1 |
| RND4K, Q1T1 |
6 |
1 |
| CN-12R2 |
|
|
| Test |
Read |
Write |
| SEQ1M, Q8T1 |
736 |
51 |
| SEQ1M, Q1T1 |
789 |
52 |
| RND4K, Q32T1 |
8 |
1 |
| RND4K, Q1T1 |
6 |
1 |
| CN-16R2 |
|
|
| Test |
Read |
Write |
| SEQ1M, Q8T1 |
803 |
49 |
| SEQ1M, Q1T1 |
774 |
49 |
| RND4K, Q32T1 |
6 |
1 |
| RND4K, Q1T1 |
6 |
1 |
| CN-20R2 |
|
|
| Test |
Read |
Write |
| SEQ1M, Q8T1 |
717 |
50 |
| SEQ1M, Q1T1 |
725 |
52 |
| RND4K, Q32T1 |
6 |
1 |
| RND4K, Q1T1 |
6 |
1 |
My reasoning was as follows: Keep adding drives until diminishing returns / loosing performance.
For my particular setup (and these drives), this happens somewhere around the 16-drive wide and 20-drive wide R2 vdevs. Decided not to test a 24-drive wide vdev. Interestingly enough, I’m never seeing the performance drop below the 4-d wide R2 vdev.
For some reason I decided to delete / not run the 4-drive wide vdev to see the default behaviour. I can’t remember excactly why, but I can see myself thinking, something along the lines: “If I’m using two parity drives in a 4-drive config, I’d might as well be doing a striped-mirror config.”
So the following is ‘only’ from 8-20-drives wide R2 default behaviour:
| CN-08R2 |
|
|
| Test |
Read |
Write |
| SEQ1M, Q8T1 |
3899 |
5717 |
| SEQ1M, Q1T1 |
3921 |
5593 |
| RND4K, Q32T1 |
214 |
572 |
| RND4K, Q1T1 |
213 |
617 |
| CN-12R2 |
|
|
| Test |
Read |
Write |
| SEQ1M, Q8T1 |
3875 |
5804 |
| SEQ1M, Q1T1 |
3883 |
5623 |
| RND4K, Q32T1 |
212 |
586 |
| RND4K, Q1T1 |
212 |
576 |
| CN-16R2 |
|
|
| Test |
Read |
Write |
| SEQ1M, Q8T1 |
3871 |
5537 |
| SEQ1M, Q1T1 |
3873 |
5332 |
| RND4K, Q32T1 |
212 |
566 |
| RND4K, Q1T1 |
212 |
585 |
| CN-20R2 |
|
|
| Test |
Read |
Write |
| SEQ1M, Q8T1 |
3865 |
5552 |
| SEQ1M, Q1T1 |
3875 |
5494 |
| RND4K, Q32T1 |
212 |
596 |
| RND4K, Q1T1 |
212 |
569 |
Well, this one also threw me off a little. I know we’re almost at a point where we’re splitting hairs, but splitting hairs is splitting ‘something’ none the less. Overall I still think that an 8-drive wide R2 is the best balance between resilience and performance. I’m just presenting my findings for the next guy who might be interested.
You’ll also notice, that ‘bare metal’ in this instance isn’t indicative of default performance. There seems to be no good reason to go wider than 8-drives except for perhaps saving some space due to lost capacity as a product of parity.
For instance: 8x 8TB drives is still 64 TB (raw) and around 43-45 TB when factoring in ZFS (perhaps more with compression?). That’s a lot for home use!
And with 4x 24 drive backplanes, that could be split into multiple vdevs with smaller drives - for instance:
Pool ~ 48-50 TB
– vdev#1@R2: 8x 4TB ~ 24-25TB
– vdev#2@R2: 8x 4TB ~ 24-25TB
Anywho. Let’s move along and test out just that kind of config:
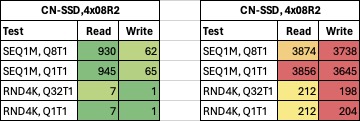
‘Bare metal’:
| CN-SSD,4x08R2 |
|
|
| Test |
Read |
Write |
| SEQ1M, Q8T1 |
930 |
62 |
| SEQ1M, Q1T1 |
945 |
65 |
| RND4K, Q32T1 |
7 |
1 |
| RND4K, Q1T1 |
7 |
1 |
‘Default’
| CN-SSD, 4x08R2 |
|
|
| Test |
Read |
Write |
| SEQ1M, Q8T1 |
3874 |
3738 |
| SEQ1M, Q1T1 |
3856 |
3645 |
| RND4K, Q32T1 |
212 |
198 |
| RND4K, Q1T1 |
212 |
204 |
I think, we have a winner!
Absolute best ‘bare metal’ performance so far’. With this absolute worst case scenario, it appears as if, I’m guarenteed a saturated 10gig connection when looking a sequential read (‘bare metal’).
When we let TrueNAS do it’s thing, even random 4K performance is almost double that of a 1GbE connection. To me, this is insane numbers and could just as well be a SSD connected directly via USB-C (I know USB-C is 5/10Gbps, so I wouldn’t see numbers much higher than 1GB/s anyway, when looking at sequential).
Well. This was a rundown of all the SATA numbers I found interesting.
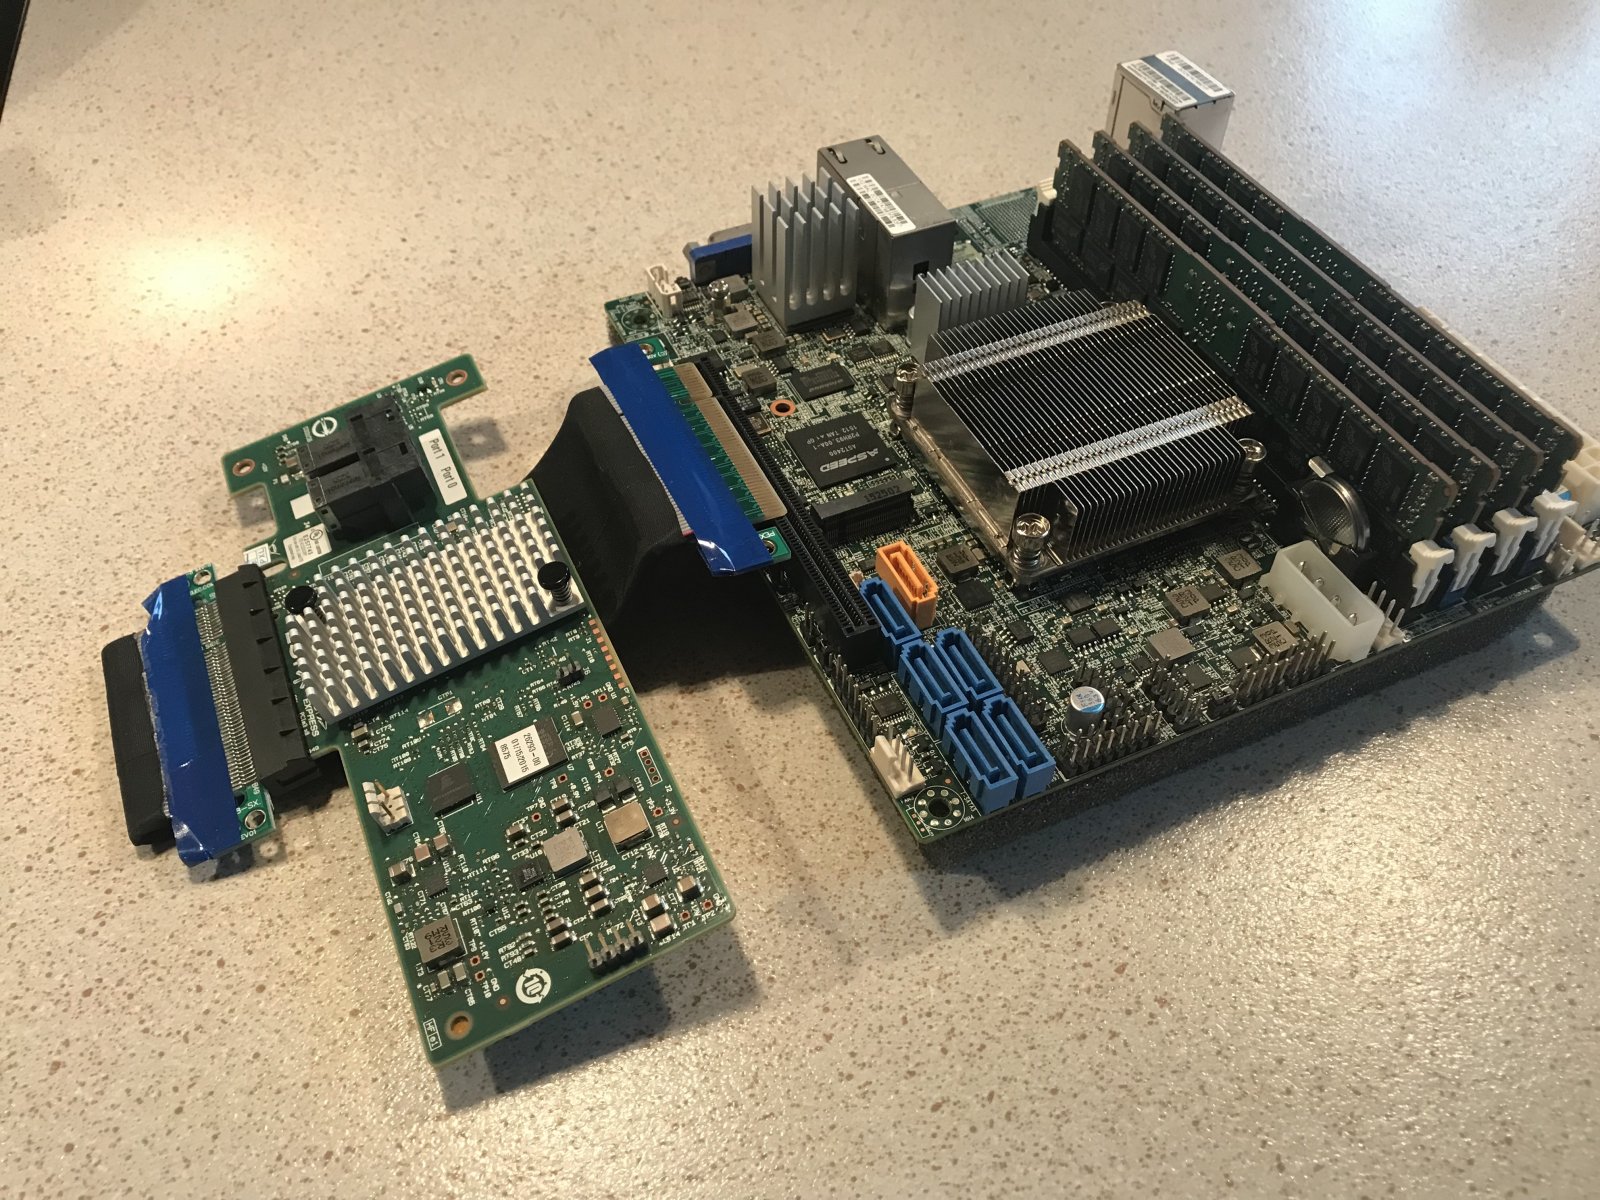
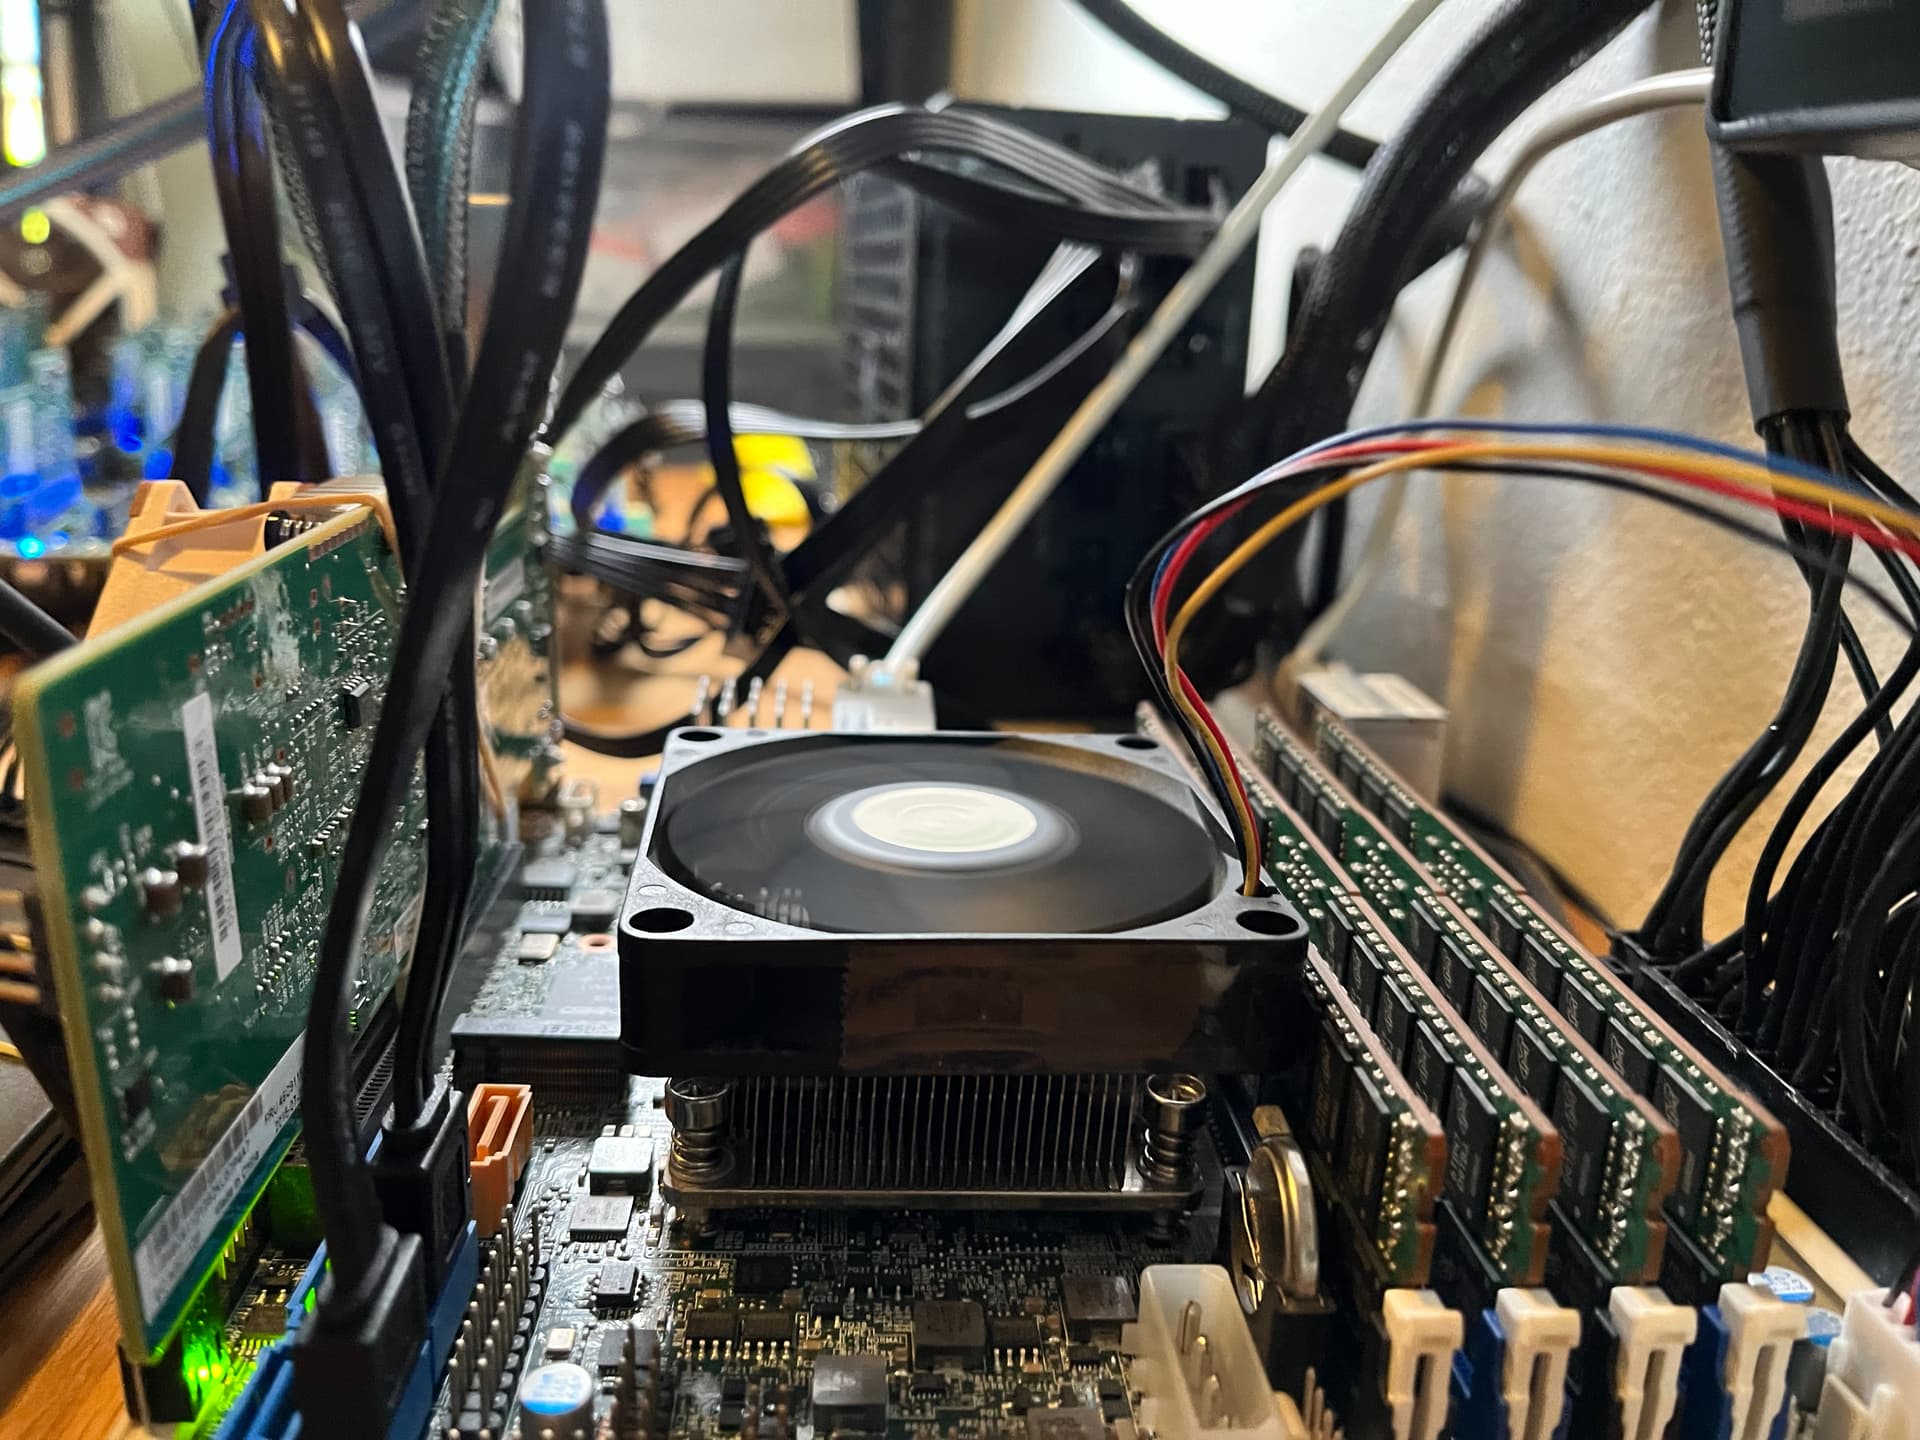
I was curious and decided to disconnect backplanes and pull the HBA and swap it out for some NVMe SSDs. The motherboard I’m using (X10SDV-4C-TLN2F) is able to do PCIe bifurcation and I happen to have some sh*tty SK Hynix 256 GB drives in the drawer. Let’s move along.
| CN-01 /nvd0 |
|
|
| Test |
Read |
Write |
| SEQ1M, Q8T1 |
1042 |
770 |
| SEQ1M, Q1T1 |
965 |
769 |
| RND4K, Q32T1 |
37 |
192 |
| RND4K, Q1T1 |
37 |
192 |
Single drive, device level - pretty much in line with what I’ve observed using CDM in Windows.
| SK Hynix (BC501, 256GB) |
|
|
| Test |
Read |
Write |
| SEQ1M, Q8T1 |
1775 |
814 |
| SEQ1M, Q1T1 |
1043 |
748 |
| RND4K, Q32T1 |
311 |
228 |
| RND4K, Q1T1 |
39 |
109 |
This a 4-drive average, meaning i benchmarked four drives, wrote down the results for each test and did an avage of those results.
Same drive, but this time with a file system (pool with single-drive vdev), also ‘bare metal’:
| CN-01 256GB |
|
|
| Test |
Read |
Write |
| SEQ1M, Q8T1 |
728 |
128 |
| SEQ1M, Q1T1 |
699 |
136 |
| RND4K, Q32T1 |
6 |
1 |
| RND4K, Q1T1 |
6 |
1 |
Ouch!
As with the SATA SSD, there seems to be a performance penalty going from drive level into file system territory.
How about default behaviour then?
| CN-01 256GB |
|
|
| Test |
Read |
Write |
| SEQ1M, Q8T1 |
3928 |
5948 |
| SEQ1M, Q1T1 |
3917 |
6007 |
| RND4K, Q32T1 |
193 |
561 |
| RND4K, Q1T1 |
201 |
598 |
Oh… what? Wait a minute?!
Have I been testing the cache / RAM performance all along?!
Well. To be honest, I knew this already and it’s also one of the reasons I did the tests the way I did. I’ll get a bit more into it in the analysis, but I wanted to find the bottlenecks in the system. That’s why I tested with ‘direct’, ‘sync’ and cache disable. It’s a decision I made pretty early on, but not from the very begininng, so I had to go back an redo some of my (SATA) tests.
As I mentioned earlier, I didn’t do the tests in the order I’m presenting them in, but I did do the NVMe-tests at the very end.
Let’s look a bit more into the different configs. The above was with a single drive, so let’s do the obvious thing next and test 2-drive configs - first, stripes:
| CN-02S |
|
|
| Test |
Read |
Write |
| SEQ1M, Q8T1 |
293 |
171 |
| SEQ1M, Q1T1 |
208 |
144 |
| RND4K, Q32T1 |
4 |
2 |
| RND4K, Q1T1 |
3 |
1 |
| CN-02S |
|
|
| Test |
Read |
Write |
| SEQ1M, Q8T1 |
3872 |
5603 |
| SEQ1M, Q1T1 |
3892 |
5466 |
| RND4K, Q32T1 |
210 |
422 |
| RND4K, Q1T1 |
209 |
436 |
‘Bare metal’ vs. ‘default’. For some reason, 2-drive stripes with NVMes tanks ‘bare metal’ performance. We’re almost at direct flash-level speeds. Not much of a surprise, since that’s what I wanted to test. But, still. ~300 MB/s read?! Damn!
‘Default’ presents no real surprises except for poorer random write for some reason?
Let’s look at a 2-drive mirror:
| CN-02M |
|
|
| Test |
Read |
Write |
| SEQ1M, Q8T1 |
286 |
87 |
| SEQ1M, Q1T1 |
317 |
93 |
| RND4K, Q32T1 |
4 |
1 |
| RND4K, Q1T1 |
6 |
1 |
| CN-02M |
|
|
| Test |
Read |
Write |
| SEQ1M, Q8T1 |
3882 |
6300 |
| SEQ1M, Q1T1 |
3885 |
6155 |
| RND4K, Q32T1 |
208 |
603 |
| RND4K, Q1T1 |
208 |
646 |
When we compare 2-drive mirror vs. 2-drive stripe, everything seems to fall in line with what’ve observerved earlier with the SATA SSDs.
Mirror: faster seq.read
Stripe: faster seq.write
Random 4K performance is about the same, stripe or mirror, either way.
No, wait a minute?
Random 4K in a 2-drive mirror is notably faster with an iodepth/queue depth of 1.
I ran this particular test a couple of times and switching between drives, the result was the same. 2-drive mirror random 4K was double the speed compared to 2-drive stripe.
Let’s look at 4-drive stripe and mirror. Stripe’s up first:
| CN-04S |
|
|
| Test |
Read |
Write |
| SEQ1M, Q8T1 |
367 |
196 |
| SEQ1M, Q1T1 |
736 |
195 |
| RND4K, Q32T1 |
6 |
3 |
| RND4K, Q1T1 |
6 |
3 |
| CN-04S |
|
|
| Test |
Read |
Write |
| SEQ1M, Q8T1 |
3875 |
4901 |
| SEQ1M, Q1T1 |
3873 |
4891 |
| RND4K, Q32T1 |
193 |
238 |
| RND4K, Q1T1 |
194 |
257 |
And let’s quickly compare that to 4-drive mirror:
| CN-04M |
|
|
| Test |
Read |
Write |
| SEQ1M, Q8T1 |
408 |
108 |
| SEQ1M, Q1T1 |
387 |
102 |
| RND4K, Q32T1 |
5 |
1 |
| RND4K, Q1T1 |
4 |
1 |
| CN-04M |
|
|
| Test |
Read |
Write |
| SEQ1M, Q8T1 |
3872 |
6332 |
| SEQ1M, Q1T1 |
3881 |
6175 |
| RND4K, Q32T1 |
204 |
621 |
| RND4K, Q1T1 |
204 |
680 |
Hmm.
4-drive mirror seems to be inferior in almost every single-test, except for seq.read, q8t1?
This doesn’t match what we’ve observed with the SATA SSDs.
Perhaps it’s down to a PCIe-thing, I honestly don’t know, but just to refresh (“-”, means, they’re about the same / within margin of error, otherwise, the fastest config is noted):
| CN-08S/M (SATA) |
|
|
| Test |
Read |
Write |
| SEQ1M, Q8T1 |
M |
S |
| SEQ1M, Q1T1 |
- |
S |
| RND4K, Q32T1 |
- |
- |
| RND4K, Q1T1 |
- |
- |
| CN-04S/M (NVMe) |
|
|
| Test |
Read |
Write |
| SEQ1M, Q8T1 |
M |
S |
| SEQ1M, Q1T1 |
S |
S |
| RND4K, Q32T1 |
- |
S |
| RND4K, Q1T1 |
S |
S |
But, that’s ‘bare metal’. What happens, when we throw TrueNAS’ ‘default’ behaviour into the mix?
| CN-08S/M (SATA) |
|
|
| Test |
Read |
Write |
| SEQ1M, Q8T1 |
- |
M |
| SEQ1M, Q1T1 |
- |
M |
| RND4K, Q32T1 |
- |
M |
| RND4K, Q1T1 |
- |
M |
| CN-04S/M |
|
|
| Test |
Read |
Write |
| SEQ1M, Q8T1 |
- |
- |
| SEQ1M, Q1T1 |
- |
- |
| RND4K, Q32T1 |
- |
- |
| RND4K, Q1T1 |
- |
- |
So… yeah. What does this even mean? It means, not drawing any conclusions, that it actually doesn’t matter. If ‘bare metal’ is a factor, by all means, use these results. Everyone else? It appears as if, there is no difference (except for available space, of course). It appears to be something else, making it as if a mirror and stripe perform the same - like, within 5% (or less) of each other.
It’s only ‘default’ behaviour with SATA SSDs that show any meaningful difference. The same can’t be said with NVMe-drives - not going by these results at least.
Lets’ look at RadZ1 and -Z2 before going into the analysis - the following are both ‘bare metal’:
| CN-04R1 |
|
|
| Test |
Read |
Write |
| SEQ1M, Q8T1 |
431 |
151 |
| SEQ1M, Q1T1 |
431 |
167 |
| RND4K, Q32T1 |
6 |
1 |
| RND4K, Q1T1 |
5 |
1 |
| CN-04R2 |
|
|
| Test |
Read |
Write |
| SEQ1M, Q8T1 |
461 |
119 |
| SEQ1M, Q1T1 |
470 |
130 |
| RND4K, Q32T1 |
5 |
1 |
| RND4K, Q1T1 |
5 |
1 |
No surprises here. Kinda single-drive behaviour, again, but seq.reads are down a notch. Write’s about the same as are random read/write.
Let’s look at ‘default’:
| CN-04R1 |
|
|
| Test |
Read |
Write |
| SEQ1M, Q8T1 |
3889 |
5797 |
| SEQ1M, Q1T1 |
3881 |
5580 |
| RND4K, Q32T1 |
204 |
444 |
| RND4K, Q1T1 |
203 |
508 |
| CN-04R2 |
|
|
| Test |
Read |
Write |
| SEQ1M, Q8T1 |
3887 |
6079 |
| SEQ1M, Q1T1 |
3875 |
5943 |
| RND4K, Q32T1 |
207 |
542 |
| RND4K, Q1T1 |
206 |
578 |
Hmmm. Again, not much of a surprise. If single-drive resilience is enough, I’d rather take RaidZ1 with four drives. Actually, there’s another m.2 slot on the motherboard itself so you could configure a 5-drive setup. I just stuck with 4-drive setups, because I forgot about the m.2 on the motherboard and was deep into testing and couldn’t be bothered to also taking PCIe vs. m.2 into account (not that I expected any difference).
[INSERT from EDIT, again] Well. Joke’s on me. The m.2 slot is SATA and not NVMe. I thought it was able to act as a PCIe, based on the block diagram in the mothervboards manual, which states:
M.2 connector
PCIE 3.0 x4
or SATA 3.0 x1
Also:
The X10SDV series deploy an M key only dedicated for SSD devices with the ultimate performance capability in a PCI Express 3.0 X4 interface for native PCIe SSD support. The X10SDV M.2 is mux with the I-SATA0 port for legacy SATA SSD devices.
Perhaps I’m just missing something. Tried to install another SK Hynix NVMe. TrueNAS won’t see it.
[/INSERT from EDIT, again]
So. Congratz! You’ve made it to the end of my breakdown of the results. Let’s try do some analysis and if you have any insights or objections I’d very much appreciate it. I’m kinda ‘lost’ in the numbers at this point, so I’ve made some graphs… everybody loves graphs, right?
4. Analysis - My thoughts and perhaps some questions
The diagrams doesn’t show excactly the numbers I’ve presented above, but I’ll explain one diagram and hopefully the rest will make sense.
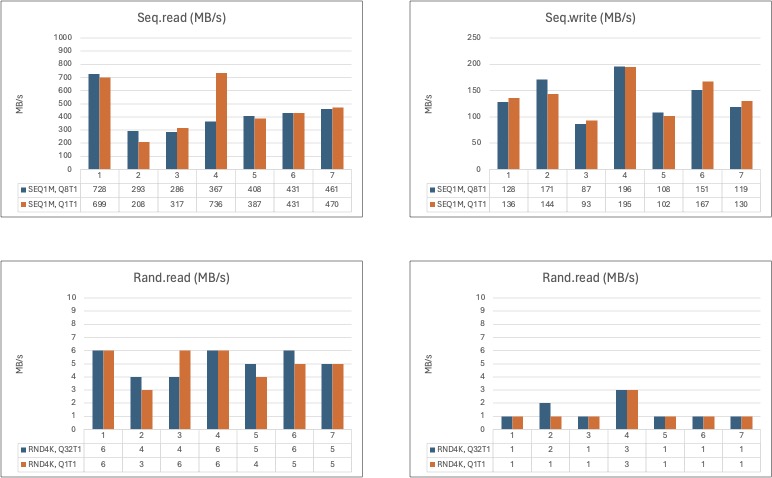
The first diagram below shows all ‘bare metal’ results for the SATA SSDs. Also configs I haven’t mentioned in the results-part of this post. I’ll explain why in just a minute, but first a graph (or diagram):
So. What are we looking at?
We are looking at (almost) every result of my fio testing with different SATA SSD configs. Single-drive, 2-drive, and so on upto 4x 8-drive RaidZ2 configs.
I’m just throwing it out there for you to see, and also perhaps gain a ‘bigger picture’ myself.
Seq.write: config 5, 6 and 8 dips:
Config 5 and 6: Those a both mirror-configs (4- and 8-drive respectively).
Config 8: 4-drive RaidZ2 config.
Best performance overall seems to be config 16, the very last one, when looking at ‘bare metal’ results.
Config 16 is dubbed ‘CN-SSD,4x08R2’, meaning: Pool of SSDs, 4 vdevs, each being an 8-drives wide RaidZ2 vdev.
Going by ‘bare metal’ alone, config 16 is only beaten in seq.write by config 15.
Config 15 is dubbed ‘CN-08M-S’, meaning just that. A pool with a stripe of mirrors (or, is it the other way around? Can’t remember), that isn’t the optimal setup in my use case. To much space goes to waste and it’s not that much faster than config 16 in this one particular test.
Let’s look at TrueNAS’ default behaviour:
Hmm… I should have noticed this very early on, but no. I’m not joking. When you’re looking at numbers ranging from 1-3 MB/s to 5000-6500 MB/s, a couple of MB/s can get lost and it’s not until you step back an look at everything all at once you see the patterns emerge.
Seq.read is pinned at 3.9 GB/s (or, almost, in reality it’s more like 3.880 MB/s but I’m rounding. I’m a former engineering student, it’s ok. I’m allowed, I think).
Seq.write is a bit more all over the place, but no lower than (coincidentally), around 3.8 GB/s. Most of the time, ranging from 5 GB/s to around 6.5 GB/s.
Rand.read again, pinned around 210-212 MB/s.
Rand.write, is all over the place. The best results are with config 2, 4, 6, 7 and 8.
You’ll notice, the number of configs doesn’t match the ‘bare metal’ results, so the numbers also doesn’t match. However, the aforementioned configs are dubbed:
- CN-08M
- CN-08R2
- CN-12R2
- CN-16R2
- CN-20R2
If you look closely, you can almost see the performance level off / drop. The two last configs (9 and 10) are dubbed:
- CN-08M-S
- CN-SSD, 4x08R2
From a pure performance standpoint, a single 8-drive wide RaidZ2 vdev appears to be the sweet spot. However, though wider vdevs might offer similar performance, there appears to be no pracital benefit from going wider than 8-drives.
The last config, 10, being a pool with multiple 8-drive wide vdevs appears to be the worst - looking at performance alone, but I’m not sure I agree with that conclusion.
Sure. If you only have room for 8 drives, you can toy around and do whatever.
But, I’d expect every config to perform worse, when using multiple… I don’t know the right word here, but ‘instances’ is the closest that comes to mind.
What does that mean?
Well. Perhaps, (for instance) a 16-drive wide vdev is faster than a single 8-drive vdev. But a pool made with 2x 16-drive wide vdevs would scale ‘the same’, as a pool consisting of 2x 8-drive wide vdevs.
Does that make any sense? Like. Yes. A 16-drive wide vdev might perform better, in and on itself, but it would also suffer some pentalty when adding another 16-drive wide vdev to that particular pool.
Anywho. “8-drive wide vdevs is the sweet spot.” - confirmed!
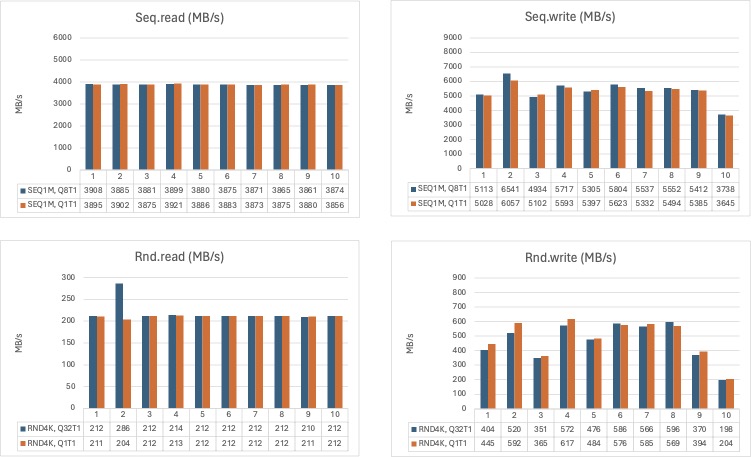
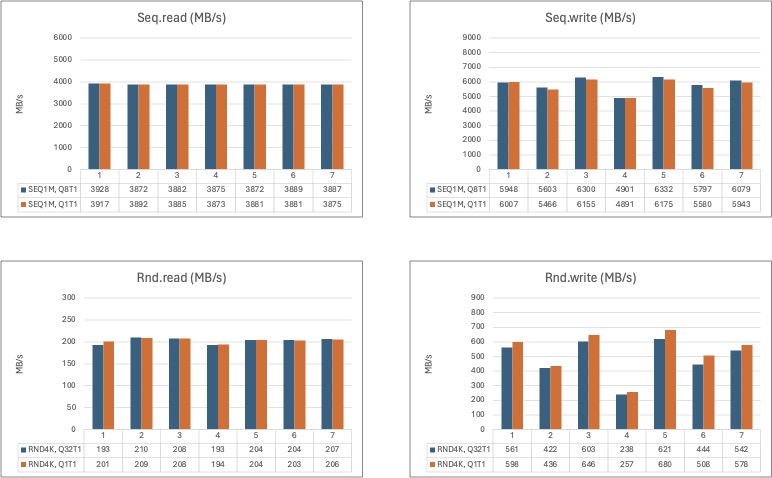
Lets’ look at NVMe performance - ‘bare metal’:
Well. I honestly didn’t know what to expect. My intution was that NVMe drives are much faster than their SATA counterparts. SATA tops out at 6 Gbps and NVMe drives tops out at what-ever speed the particular drive is able to do or the interface (either the drive or the host). That’s why I wanted to test a single drive before moving on (the same with SATA, for that matter).
That’s the very first config, 1.
The best:
Seq.read performance with these (again, sh*tty) drives seems to be a single drive.
Rand.read is either a single drive or config 4, which is a 4-drive stripe.
Seq.write is also clearly config 4. Almost 200 MB/s clean.
Rand.write is, again config 4.
In other words, going by performance alone: 4-disk stripe is the way to go, with these particular NVMe drives and this setup.
For comparison, going by ‘bare metal’ performance alone, it seems the best config fo the SATA SSDs was: config 10 (CN-08R2) or 16 (CN-SSD, 4x08R2). Again, some flavour of the 8-drive wide configs.
I’d wish this motherboard had the possibility to use 2x PCI x16 slots so I could run two of these ASUS Hyper m.2 thingies in tandem. Unfortunately the one motherboard I had, that also had this capability was broken… by ASUS, but let’s not go there.
4x NVMe will do for now, and it seems - just to circle back - that a 4-drive stripe means ultimate ‘bare metal’ performance.
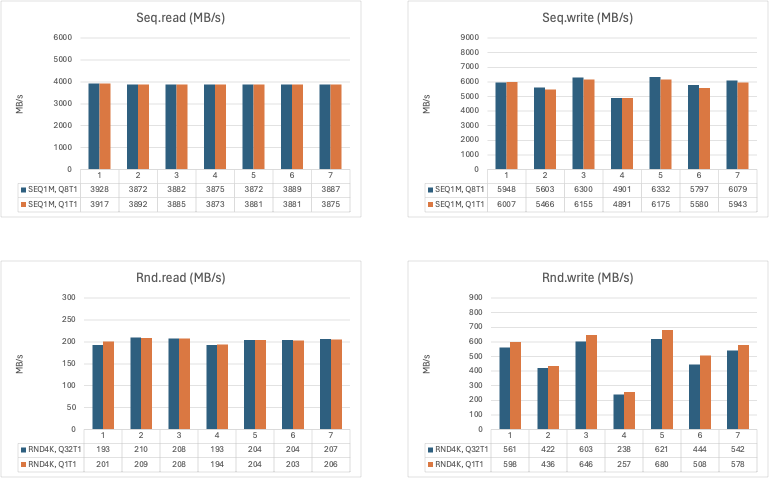
Let’s take a look at the NVMe’s performance characteristics, when TrueNAS is behind the wheel:
Seq.read is, again, pegged at 3.9 GB/s (3.886 GB/s average).
Rand.read is also pegged at, yes, the… almost same 200-210 MB/s.
Seq.write is also around 5-6.5 GB/s, but not much lower than 4.9 GB/s with config 4 (CN-04S).
The best write performance, is config 5 (CN-04M), closely followed by config 3 (CN-02M). So, fast write performance with these NVMe-drives? Mirror’em!
To be honest. It seems like, you can’t go wrong with any NVMe (4-drive) config, except for rand.write. Stay away from config 4 (CN-04S). Though you’d might get at least 250 MB/s, it’s also the slowest for random writes. Every other config averaged together is around 500-550 MB/s, with the slowest being config 2 (CN-02S, also a stripe). Remove all striped configs from the data and you’re looking at rand.write performance at around 600 MB/s.
I don’t know, if I’m communicating this well. Random 4k, write, at almost 5 Gbps over LAN (or, at least the ‘potential’). That’s insane numbers to me.
That’s the same speed as a USB-C SSD connected directly into my computer, doing sequential!
My best bet for sweet spot between performance, resilience and and capacity would a 4-drive wide RadZ1 vdev or 5-drive wide RaidZ2 - but I haven’t tested a 5-drive config, so I can’t say for sure.
5. Conclusions / other considerations - Where I’m at and how to move forward
You’ve made it this far. You’d might as well stick around 'till the end. Please?
I know. I know. Perhaps you even wrote it in a reply/comment before we made it this far.
It’s obvious that the CrazyNAS is CPU-limited when doing anything read-related. It looks like TrueNAS/fio is single-threaded, but since I ran the test with the “–numjobs=1” flag, it shouldn’t surprise me.
Or, should it?
I have no idea why, but the 3.9 GB/s cap, when doing seq.read and ~210 MB/s cap when doing rnd.read all made one core go to 100% as long as the test would run. What core was doing 100% shifted around, but it was the same with every read-related test.
I didn’t notice the same issue with writes. Everytime a large write was performed, it looked as if (in the TrueNAS UI) the load was using multiple threads.
Is there more performance to be had, if I switch the X10SDC out for, for exapample, an AMD EPYC based setup? I’m not sure. When doing benchmarks at least, CrazyNAS’ bottleneck seems to be the single-core performance.
The 5-6.5 GB/s limit bothers me a lot. Had it just been with the SATA SSDs it would have made some sense.
It matches up fine with the SAS-interface limit. Each interface is, as far as I understand it, limited to 24 Gbps because of the SAS2-backplanes. That’s around 3 GB/s pr. channel and around 6 GB/s total, when we’re back at the HBA.
What’s the specs of the HBA you’d might ask. Well, it’s a SAS9340-8i flashed into IT-mode. It’s based on the “LSI SAS3008 SAS-3”-controller: SAS 3008 spec
It’s connected to the motherboard via a PCI 3.0 x8 interface (7.88 GB/s), but as it clearly states in the specs for the controller:
“Deliver more than million IOPS and 6,000 MB/s throughput performance”
Is 6 GB/s ever going to be a practical limit in my daily use? No. I don’t expect it to be.
It’s just a weird limitation to run into.
But. That’s just the SATA-setup using the HBA. Why aren’t the NVMe-drives faster then?
I’ve had a hard time finding out where that 6-6.5 GB/s limit was introduced (in regards to the NVMes).
CPU? RAM speed?
Well. I’d might need some help on this one. You see. As I’ve stated a couple of times: These are shtty drives. Like, lowest rung, bargain bin, public funding, shtty.
They bench fine, fine enough for spec.s, when looking into buying like 1.000s for the staff of an entire municipality - also, and I feel kinda stupid for pointing this out - we’re talking public spending. Tax payer money. I’m not bashing those, who have to make these kind of decisions.
The only reason I’ve gotten my hands on some of the NVMe’s was because - like the other ones - they where going into the trash. Quite literally. They can’t be sold, and even if someone (privately) was willing to buy/pay, we aren’t allowed to sell stuff. Except for cookies when there is like a school play or something like that.
… but, I digress.
I’ve benched these drives before and even under the best of circumstances: seq.write was never over 1 GB/s, never! I think the best result was around 850 MB/s or something like that. Even if you aggregate those 850 MB/s with four drives total? 3.0-3.5 GB/s.
It’s almost perfectly half that of the interface itself. 7.88 GB/s * 80% for overhead = 6.300 MB/s
The fastest speed with NVMe drives? 6.300 / 6.332 MB/s
The fastest speed with SATA drives? 6.057 / 6.541 MB/s
I’m clueless as to which limit is introduced where. How can I write with almost double the speed even considering caching - or am I getting at this the wrong way around?
Have I bunged up the testing or did some of it make sense?
Anywho.
This is it for now. It’s been fun but I think I need a break from testing or else I’m going to buy an AMD EPYC for around $100 on eBay.
Right now, I have two main threads I’m considering to follow and luckily one doesn’t exclude the other:
- Set up CrazyNAS with 8x 128 GB drives and slowly over time swap them out for 1, 2, 4 or event 8 TB SATA drives. Gonna take a while, but I could start out with 8x 4 TB @ R2 = 24 TB. Not bad for starters. Could disconnect idle backplanes and save myself some fan noise and power usage.
- Switch it up, put the SAS backplanes back on the shelf. Buy 5x 4/8 TB NVMe SSD’s and be done with it. Power usage so far, when using NVMs’s seems to be around 70-80 W total. Not bad, considering the fact that CrazyNAS uses around 170 W… idle.
So. That’s it for now. Thanks for sticking around and I hope you have a great day 
[EDIT] Fixed some typos, spelling and added missing words.