Help requested: faultfinding an official app

Hello

How do I even begin to find out why my Frigate app goes from running for some hours requiring <50% CPU burden to suddenly always demanding greater than 80% for no apparent reason?

Frigate 0.13.2 ran and ran and ran on my TN box, without problems, using a USB coral TPU. Total use was perhaps 50%, with 25% due to Frigate.

I upgraded from one Dragonfish to another (without problems) and ultimately to Electric Eel. In doing the EE upgrade I needed to also u/g Frigate to the new base version which EE supports, namely 0.14 and then 0.14.1. This also entails changes to the config.yaml for Frigate.

Frigate 0.14/0.14.1 runs OK but then suddenly the demand shoots up. Recently, in each case when the demand abruptly increases, I find several problems which mean that

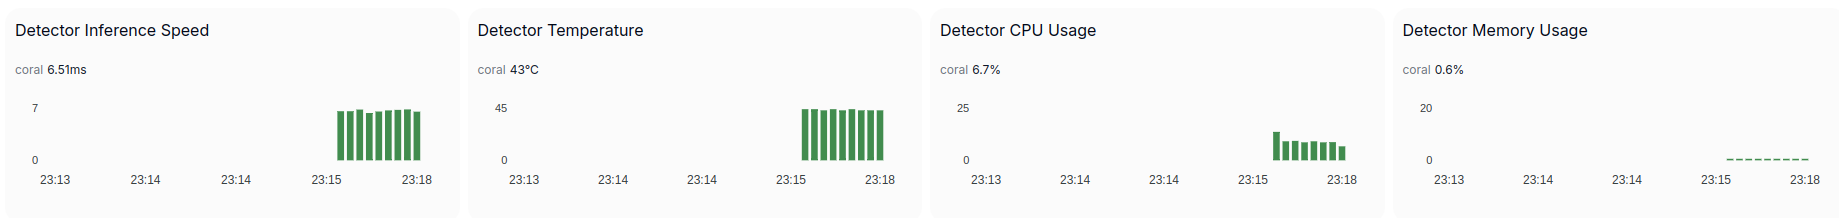
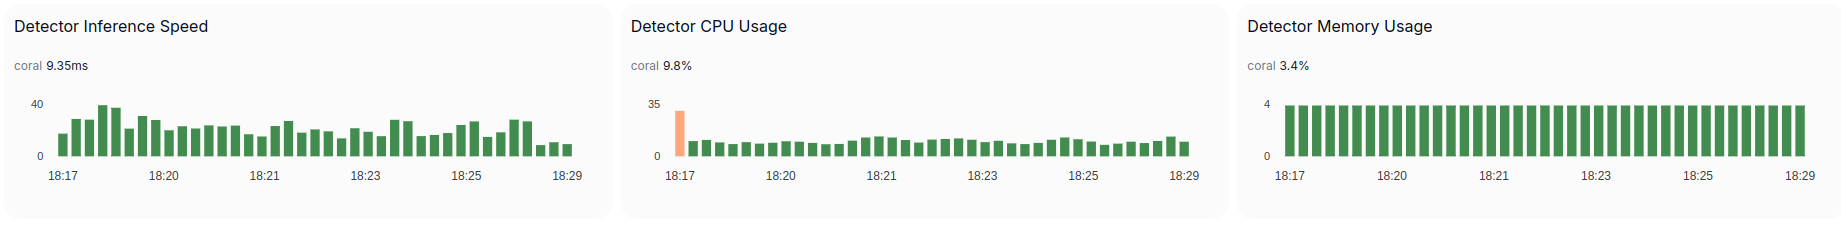
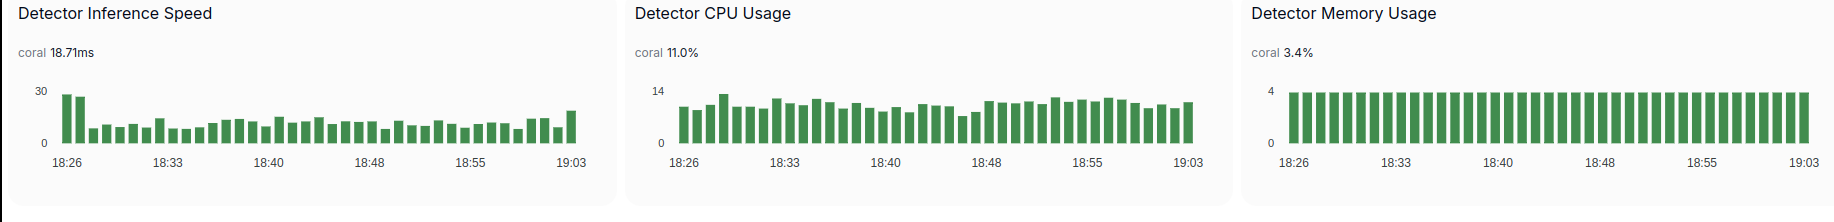
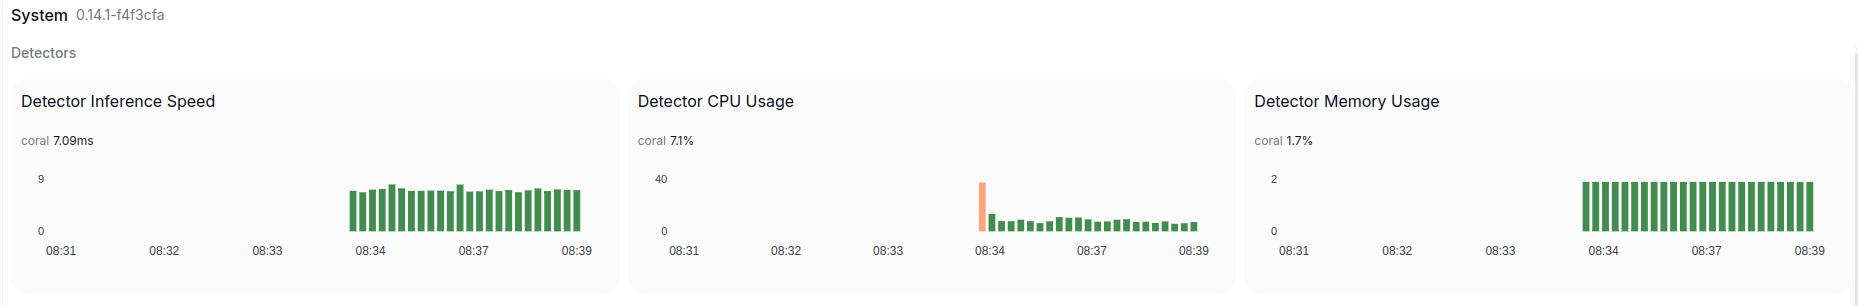
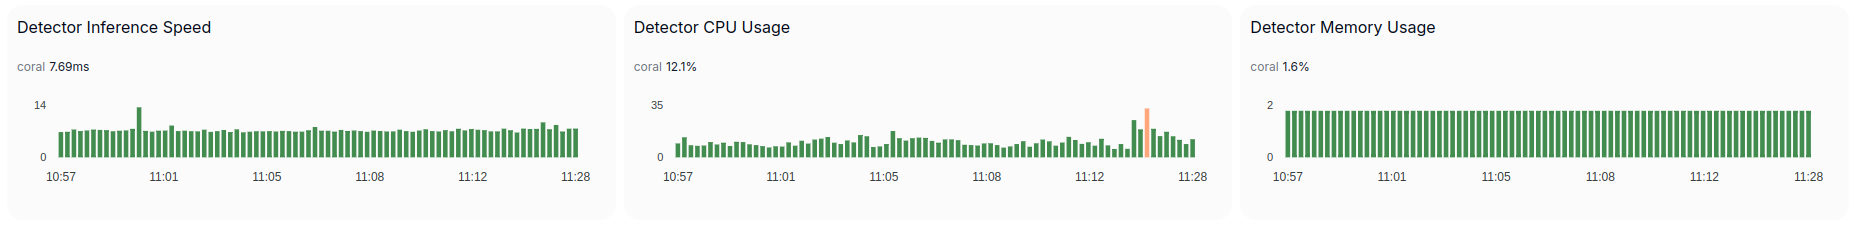
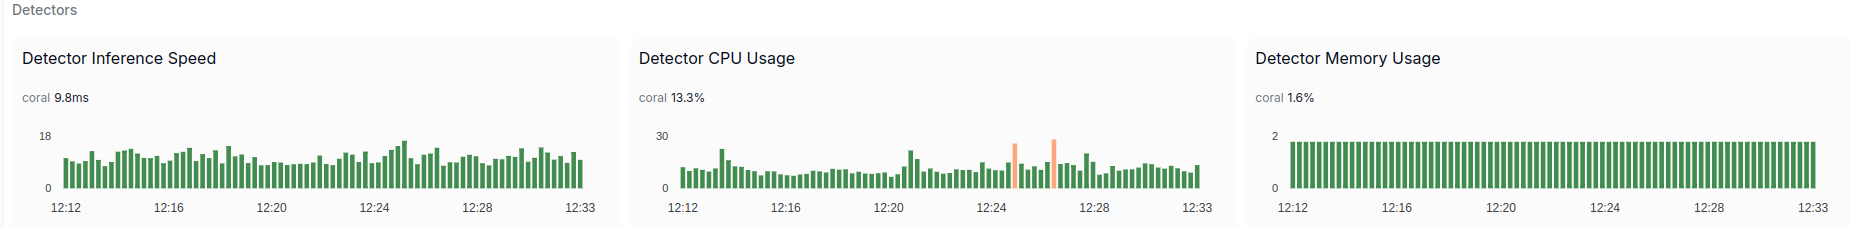
1 - the inference time for the TPU doubles from around the usual and correct 7-8 ms and might even rise to 40 ms

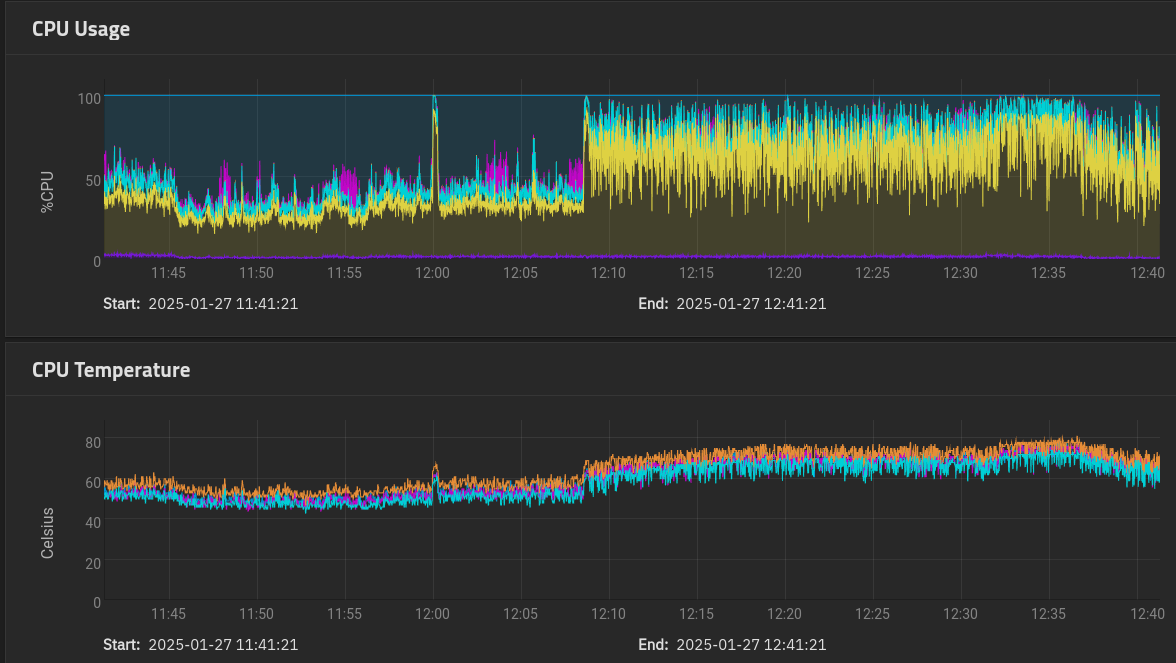
2 - the CPU temperatures change from a nominal 50 deg c to around 75 deg c

3 - this is because the 8 cores are now all at >80% and sometimes peaking to 99% rather than sitting at a nominal 50%

4 - stopping and starting the app needs to happen twice because the first time results in a stale web session, meaning that the Frigate UI doesn’t work and the app’s UI (on the app page) says “0%” use meaning it isn’tr doing anything. Then the second time I stop/start it the app now might say 25% (which is normal) and the inference time is then back to < 10 ms and the Frigate webUI works again.

5 - sometimes, this double restart doesn’t help and the NASbox is running flat out trying to process Frigate.

Eventually, the working system with low inference times and low CPU snaps to high inference time and CPU use and I can’t see any change in external circumstances (room temperature, video feeds coming and going, other apps starting and stopping) to cause it

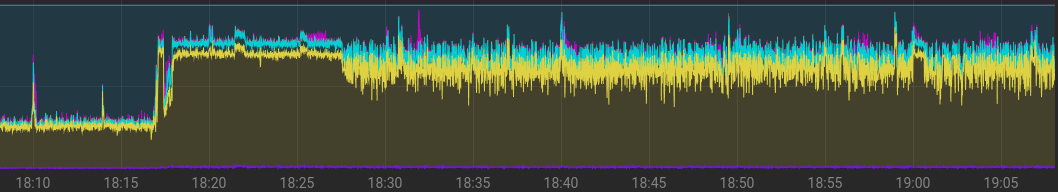
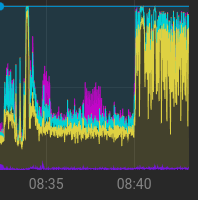
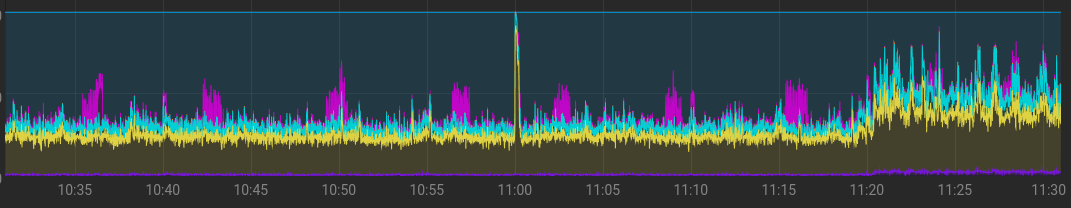
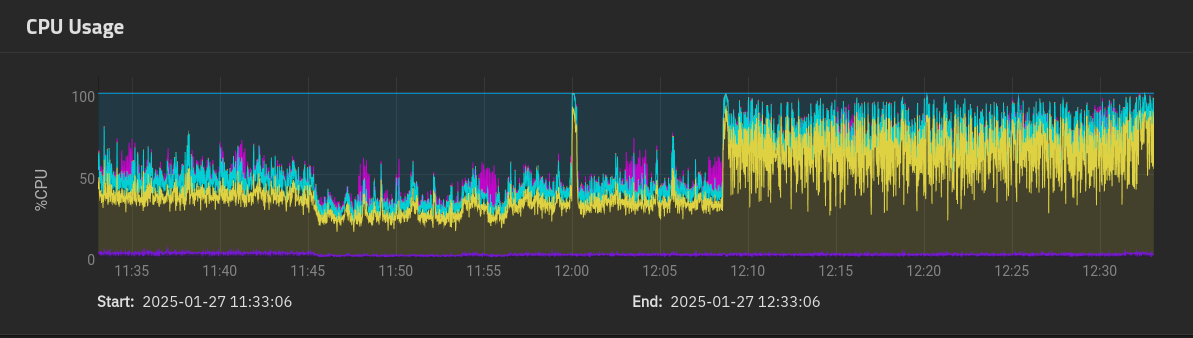
Here’s an example of use:

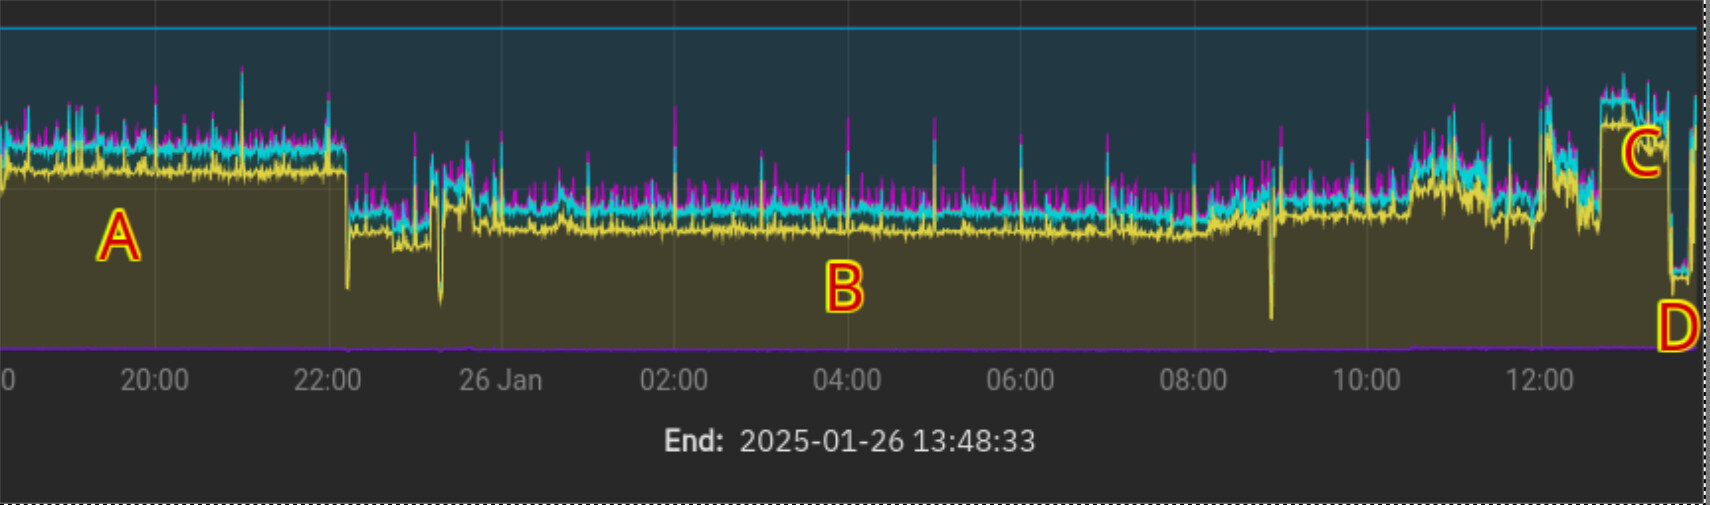
A = normal daytime running …approx 50-60% CPU
B = overnight running = 40-50%
C = suddenly it’s shot up for no apparent reason
D onwards = I have stopped it and then it has restarted at high utilisation again

I have had to shut down Frigate for now (attempts to run it via dockge/docker compose have failed because I don’t know how to configure the compose file) so I am left with trying to get the official app to work. Something is stopping it from behaving properly and I hope I can find out what the problem is (or is not).

Please can someone suggest some “official app” faultfinding approaches, even if not “Frigate” specific?

Not being a Frigate user myself I wonder, is there any way one can verify that the TPU is still being used when you see these CPU usage spikes?

It’s a good point (and thanks for lending some brain power to my problem!) but I only have circumstantial evidence that the USB Coral TPU is still shouldering the burden:

1 - the Frigate UI shows the USB TPU to be “working” albeit with a much longer 20 - 40 ms instead of the usual short 7-10 ms inference time (here’s a graph from a different but working system, which is based on an m.2 Coral TPU, which I am using in lieu of my TN box for the time being)

My TN based “problem” system looks very similar when it is working and also when it goes funny. However - you have made me think that I should do some screenshots of the metrics when it is in the low consumption and then the high consumption modes … perhaps there is something to be gleaned.

2 - the image detection and classification still continues unabated when the “fault” condition arises, even though the CPU consumption has doubled.

I agree that the huge CPU use might indicate that the TPU is only doing some of the usual work. I have tried two different USB3 ports and, between them, two different USB3 cables and I see the same response: works fine with low CPU use and short inference time, then goes to high CPU consumption and long inference time.

edit: I started the TN version and left it - you can see the inference time rise to about 30 ms (and most recently it has fallen back to a more normal 9-10 ms) and the other measurements are constant, and consistent with those shown above in that they are also only a few % - i.e. not rocketing up to 99% or something. This is coincident with the high CPU demand case (I can’t get it to go into what was the usual low power mode other than by starting and restarting a few times).


and a bit later again (half an hour or so):

during which time the CPU load looks like this:

edit: … advice from the Frigate community has suggested I increase the CPU count for the app so I have increased it from 4 to 8 (my Xeon is 4 cores but dual threaded).
I have tried another restart and it is (for now) in the "short inference time " mode:

but the associated CPU demand shows spikes at the left where I first started the app, with some up/down/up/down as it is starting and deploying and starting and finally running, then a low power mode (30%) before rising to the too-familiar high CPU burden of >80%:

image

Later I expect to find the inference time has risen from the <10 ms to > 40 ms and the CPU will be flat out.

edit: 2h later and I see the low inference time condition still in effect:

and the associated CPU demand is

i.e. continually low (apart from the unknown spike at 11:00) and then rising to approx. 50% when i returned home (and caused movement on the cameras ergo more work for Frigate to do and also I started looking at Frigate’s webUI which presumably causes increased demand).

another edit: the high CPU demand state has returned …inference time has risen slightly but still in the same region:


As soon as I stop the Frigate app the CPU demand falls rapidly: but if I stop a couple of other dockge (docker compose) apps, one of which also reads the cameras (MotionEye), I also get a reduction of sufficient magnitude so as to alleviate the CPU burden back down to dissipations I feel are safe, at least for a little while:

Five minutes later and the CPU use and temperatures have risen again so I have stopped Frigate and started the other two:
image

More work needed to find out why Frigate demand rises rapidly (e.g. at about 12:08, see above). I shall leave Frigate in a stopped state for now.