This is a screenshot from a youtube video and it has a continuous line graph for CPU usage.
Mine is set to bar graphs:

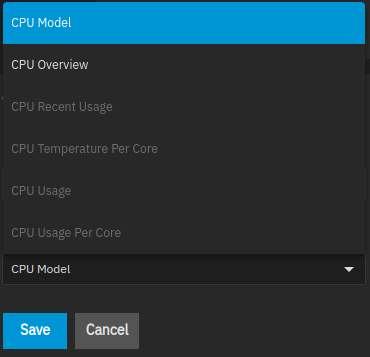
and I would like to alter it. The settings which seem relevant are greyed out and I don’t know why
Please can you show me how?
Mine is set to bar graphs:
and I would like to alter it. The settings which seem relevant are greyed out and I don’t know why
Please can you show me how?
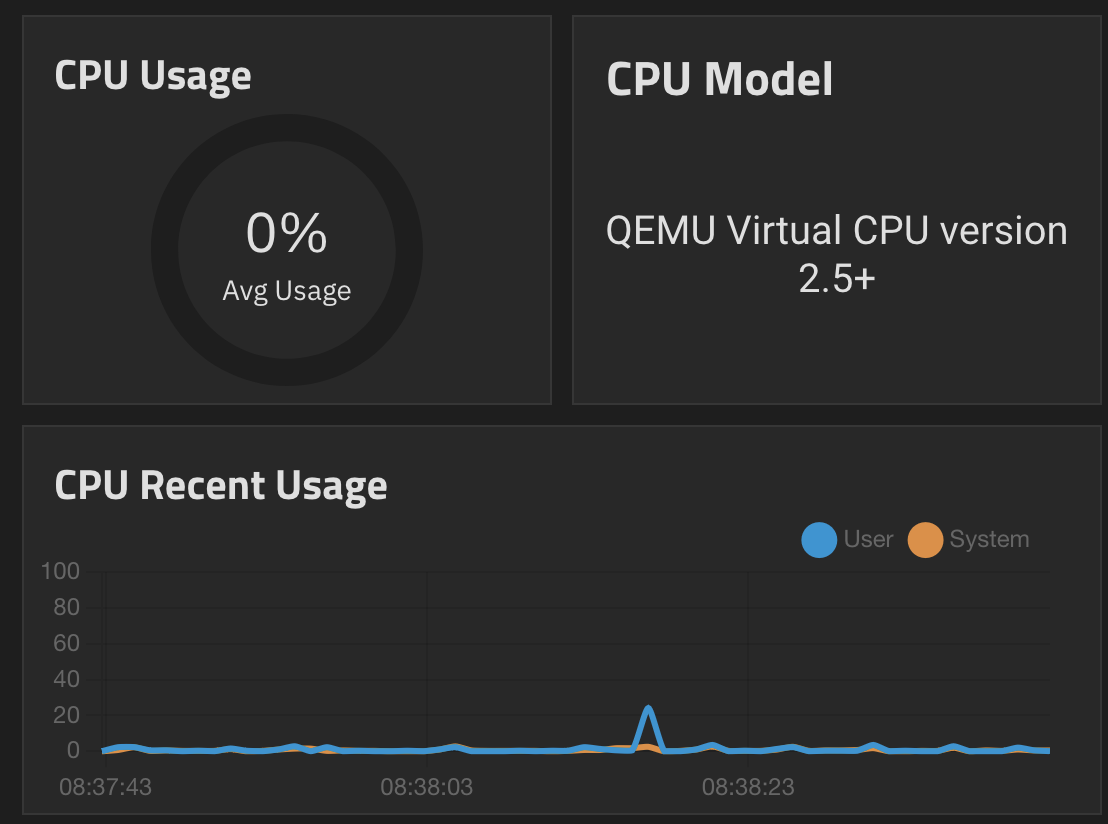
This is the default under EE:
There’s one widget for “CPU Overview” (the one you show in your screen shot, with average usage, and instantaneous usage and temp per core), and a separate one for “CPU Usage” (the one I pasted above, and your screen shot from the video). But both should be part of the default dashboard. If you’re missing one of them, click “Configure” at the top-right corner of the dashboard and you can add it.
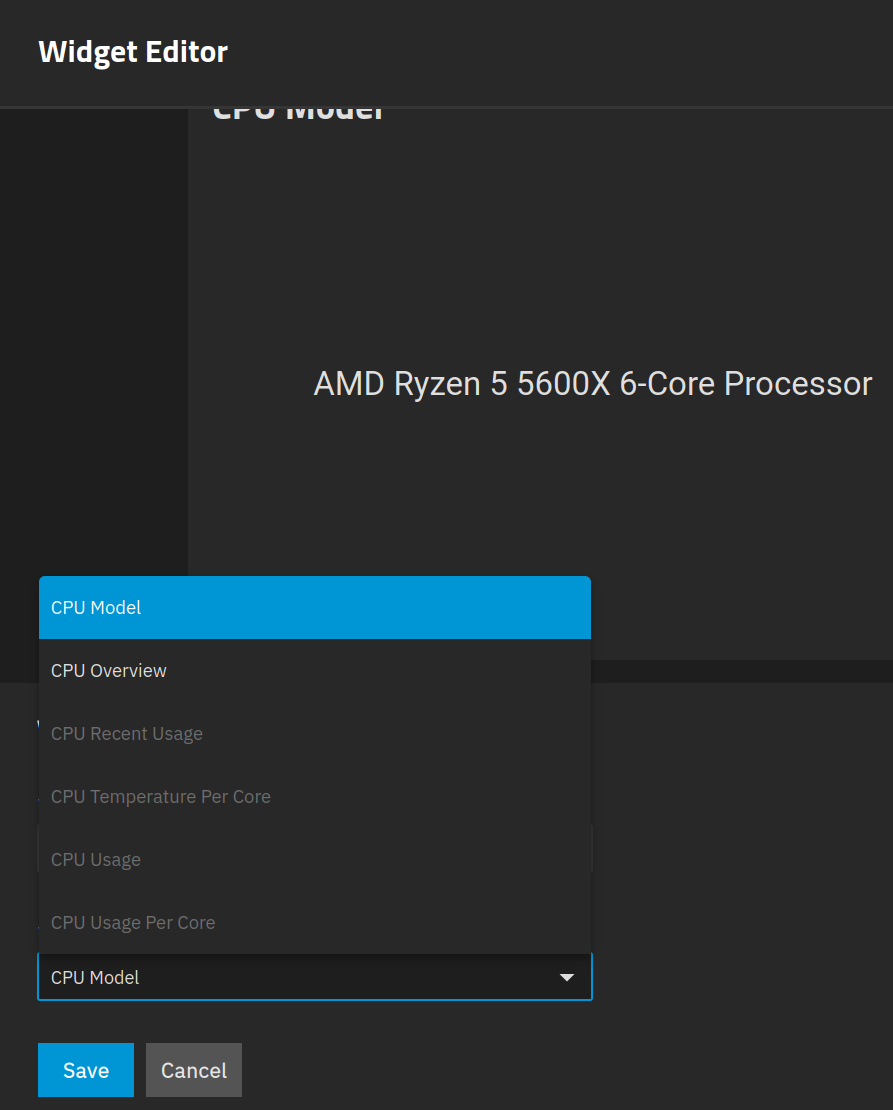
Right, because CPU Usage is already there. You can’t add a second instance of a widget that’s already present.
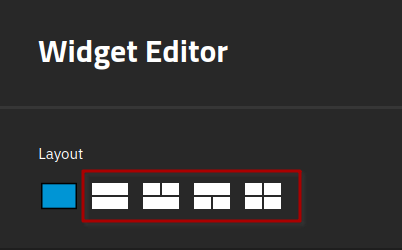
Ok, I see now. I have to change the “Layout” from single to any of the multiple layouts: