@MikeO3 Thank you for your answer.
While I do make those kind of calculations on other systems too, I cannot find any logic in the metrics I gather via graphite:
disk_space{filesystem="_mnt_stor",instance="truenas01p",job="truenas",op="avail"} 53331.45
disk_space{filesystem="_mnt_stor",instance="truenas01p",job="truenas",op="reserved_for_root"} 0
disk_space{filesystem="_mnt_stor",instance="truenas01p",job="truenas",op="used"} 0.0002441
disk_space{filesystem="_mnt_stor_es",instance="truenas01p",job="truenas",op="avail"} 53331.45
disk_space{filesystem="_mnt_stor_es",instance="truenas01p",job="truenas",op="reserved_for_root"} 0
disk_space{filesystem="_mnt_stor_es",instance="truenas01p",job="truenas",op="used"} 0.0009766
disk_space{filesystem="_mnt_stor_hv",instance="truenas01p",job="truenas",op="avail"} 53331.45
disk_space{filesystem="_mnt_stor_hv",instance="truenas01p",job="truenas",op="reserved_for_root"} 0
disk_space{filesystem="_mnt_stor_hv",instance="truenas01p",job="truenas",op="used"} 2688.947
While the available disk space can make sone sense (eg 53331 GB available), the used metric doesn’t make any sense to me:
For example
Dataset /mnt/stor/hv uses 2630 GB, which show well.
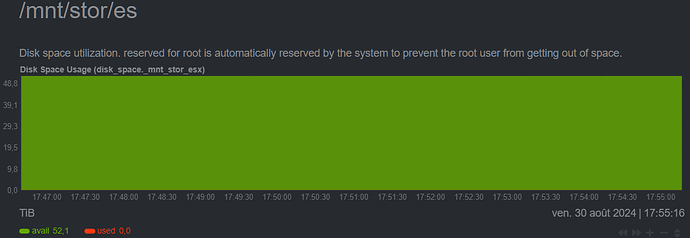
Dataset /mnt/stor/es uses 4000GB, but shows a very small usage.
I guess that’s because it’s just an empty dataset that has child dataset which uses those 4000GB, but there is no metric for child datasets.
Also, zvols don’t show either, so I have plenty of fun trying to get storage space utilization.
So this could be a graphite mapping issue, but then, even netdata shows bogus data:
/mnt/stor/ex usage as seen by netdata:
/mnt/stor/es as seen in TrueNAS UI:
So the question is, how do I configure Netdata to get child dataset sizes ?


