Inconsistent SMB performance after moving from CORE to SCALE

I’ve recently upgraded my NAS from CORE 13.0-U5.1 to SCALE 25.04.2.4.

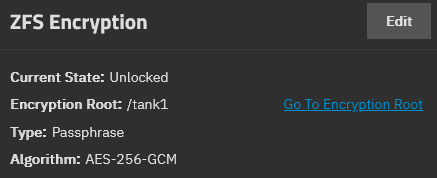
I was still on CORE because I had pools with geli encryption as well as a pool that held unencrypted datasets within an encrypted root dataset.

System specs
  • PSU:
    Corsair HX850i
  • CPU:
    Intel(R) Xeon(R) CPU E5-2620 v4
  • Mainboard:
    Supermicro X10SRH-CLN4F (Broadcom 3008 hba crossflashed to IT mode)
  • RAM:
    128GB DDR4 ECC RAM
  • Boot drive:
    128GB sata SSD
  • App drive:
    1TB m2 SSD via pci/e to m.2 adapter
  • Data pools:
    8x 18TB Toshiba HDDs as Z2 pool with zfs encryption
    8x 12TB WD HDDs as Z2 pool with zfs encryption
    10x 24TB Seagate HDDs as Z2 pool with zfs encryption
  • HBAs:
    2x dell perc h310 crossflashed to IT mode
  • NIC:
    1x Intel X540-T2 2x 10GbE
Upgrade steps from CORE to SCALE

After buying new hard drives, I installed the current version of SCALE on a spare PC, used replication tasks (with encryption enabled and matching the target pool) to move the problematic unencrypted datasets to a new zfs encrypted pool on the other machine and then moved the datasets off the geli encrypted pools to the then free zfs encrypted pool (where the unencrypted datasets were) within the CORE machine (also via encrypted replication tasks).

After performing a scrub on the target pools to ensure that there were no errors, I exported the geli encrypted pools, updated the CORE system to the latest CORE version, exported the config, physically removed the geli encrypted pools, performed a clean install of SCALE and imported the config.
Then I installed the new hard drives in the NAS and imported the new pool.

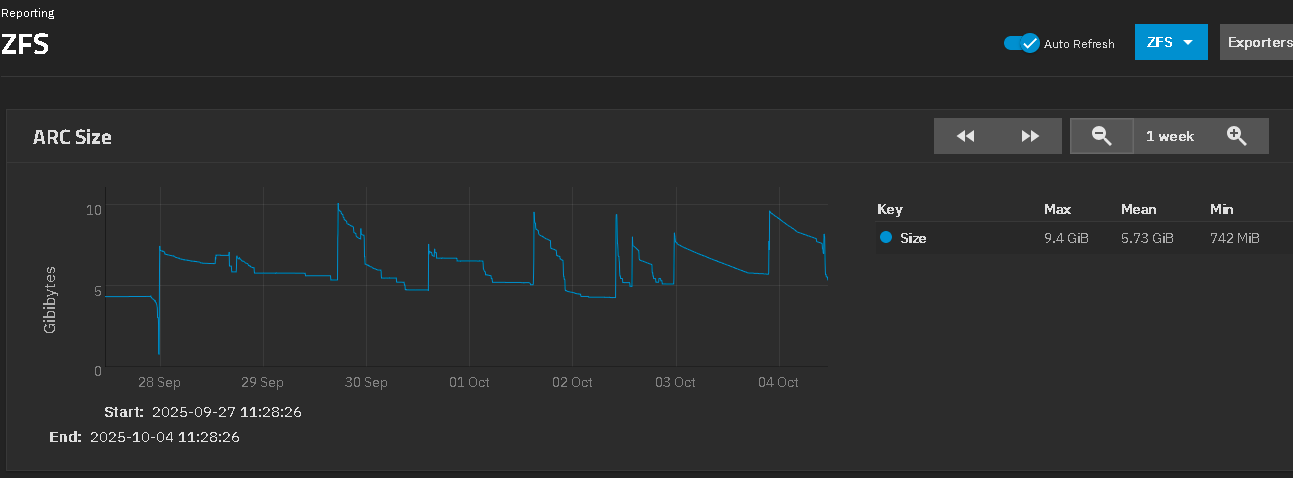
On SCALE the SMB performance is highly inconsistent. Copying files to/from the NAS works at expected speeds (~700MByte/s sequentially via 10GBit/s Ethernet). However traversing folders (especially ones with many subfolders) on smb shares makes Windows Explorer hang/load while also slowing active transfers down to <5MByte/s and killing the connection so much that even music playback from an smb share stutters or pauses. Opening a folder with 9000ish subfolders can take up to 5 minutes now. On CORE that same folder opened in less than 30 seconds if I recall it correctly.

The folder traversal speed has become so terrible that Voidtools Everything (which indexes the smb shares as network drives) takes multiple hours to scan them (during which the SMB performance is unusable) while it used to be able to scan them in a few minutes with a minor impact on other programs accessing smb shares at the same time.
MusicBee also takes multiple hours to scan for new music on the smb shares (and used to be able to scan them in ~20 minutes on CORE).

Curious is that if I let MusicBee finish a scan once and then immediately re-scan, the scan only takes the original ~20 minutes.
However the next day it’s back to crawling speeds, taking hours. I assume some kind of caching is involved but I’m unsure if that happens on my Windows 10 machine or on the NAS.
This performance degradation is also present on another Windows 10 PC of a family member.
The subnet also does not seem to matter. It happens when I access the shares via a 10GBit/s direct connection in the 192.168.0.x subnet and on the other Windows 10 PC in the general 192.168.1.x network.

I’m also using the music via an NFS share on a linux machine. That machine can index the files via NFS in 35 minutes (however this goes down to 6 minutes if I immediately let it rescan after a scan). This makes me think that the issue is SMB or permission related.

Steps I have taken to try and fix this issue:

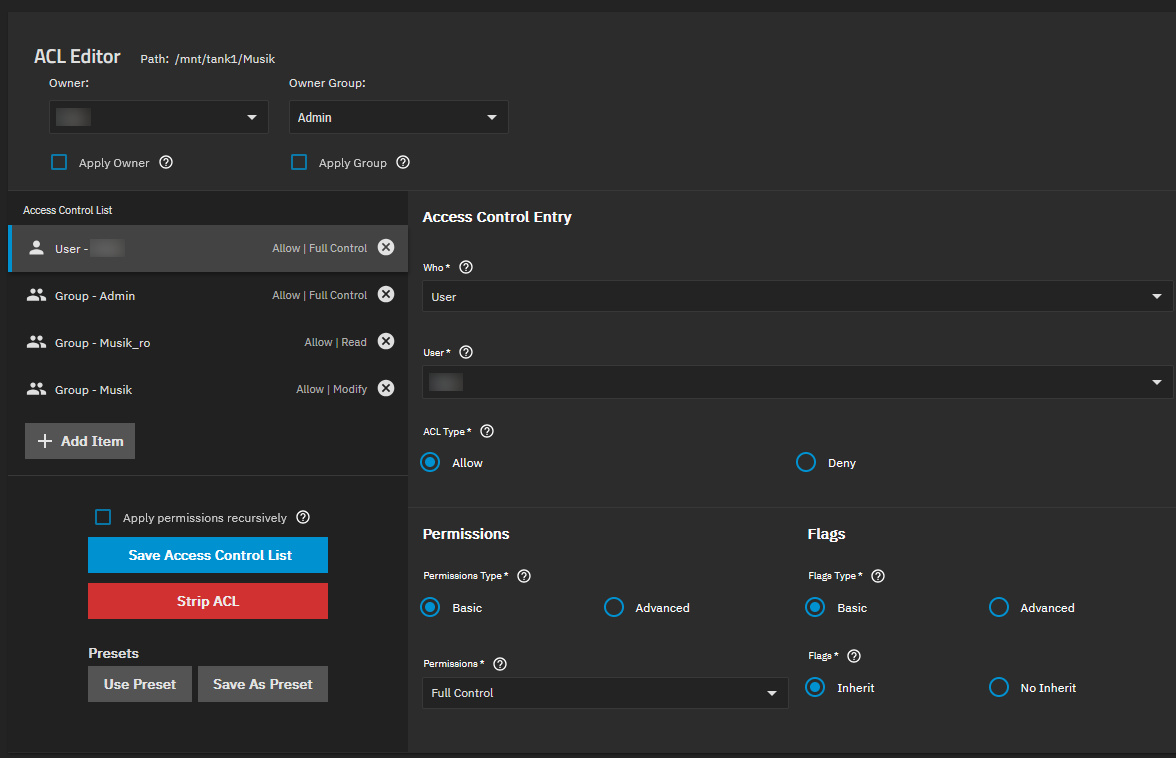
  1. recursively re-applied permissions (the ones imported from CORE were incorrect)
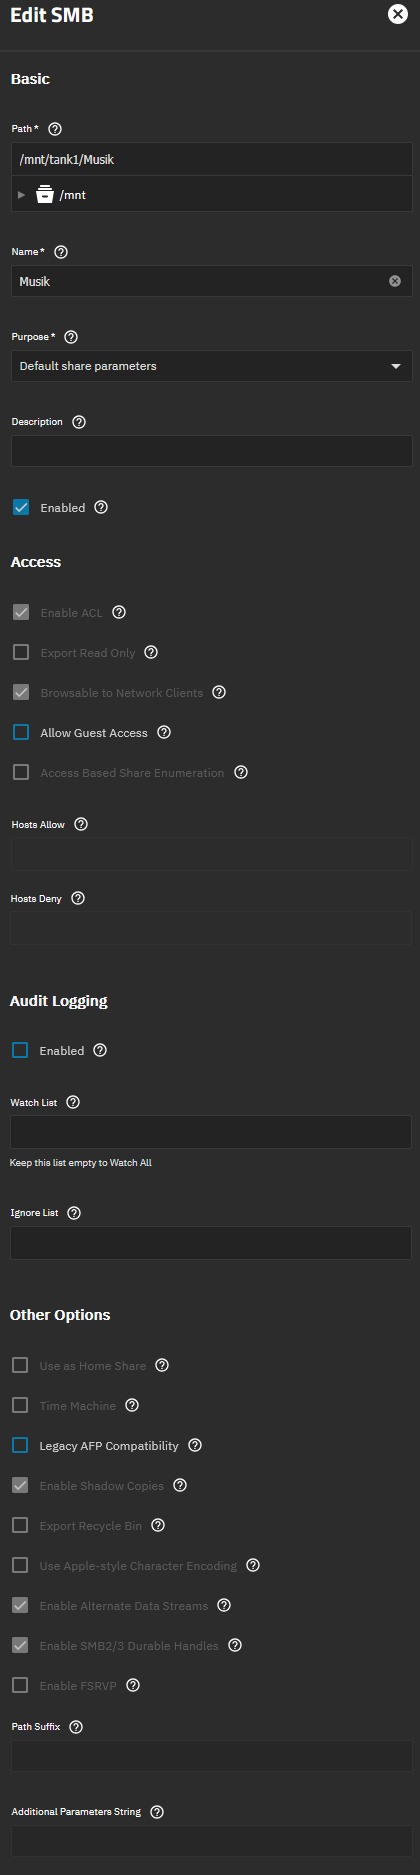
  2. changed all smb shares to use default settings
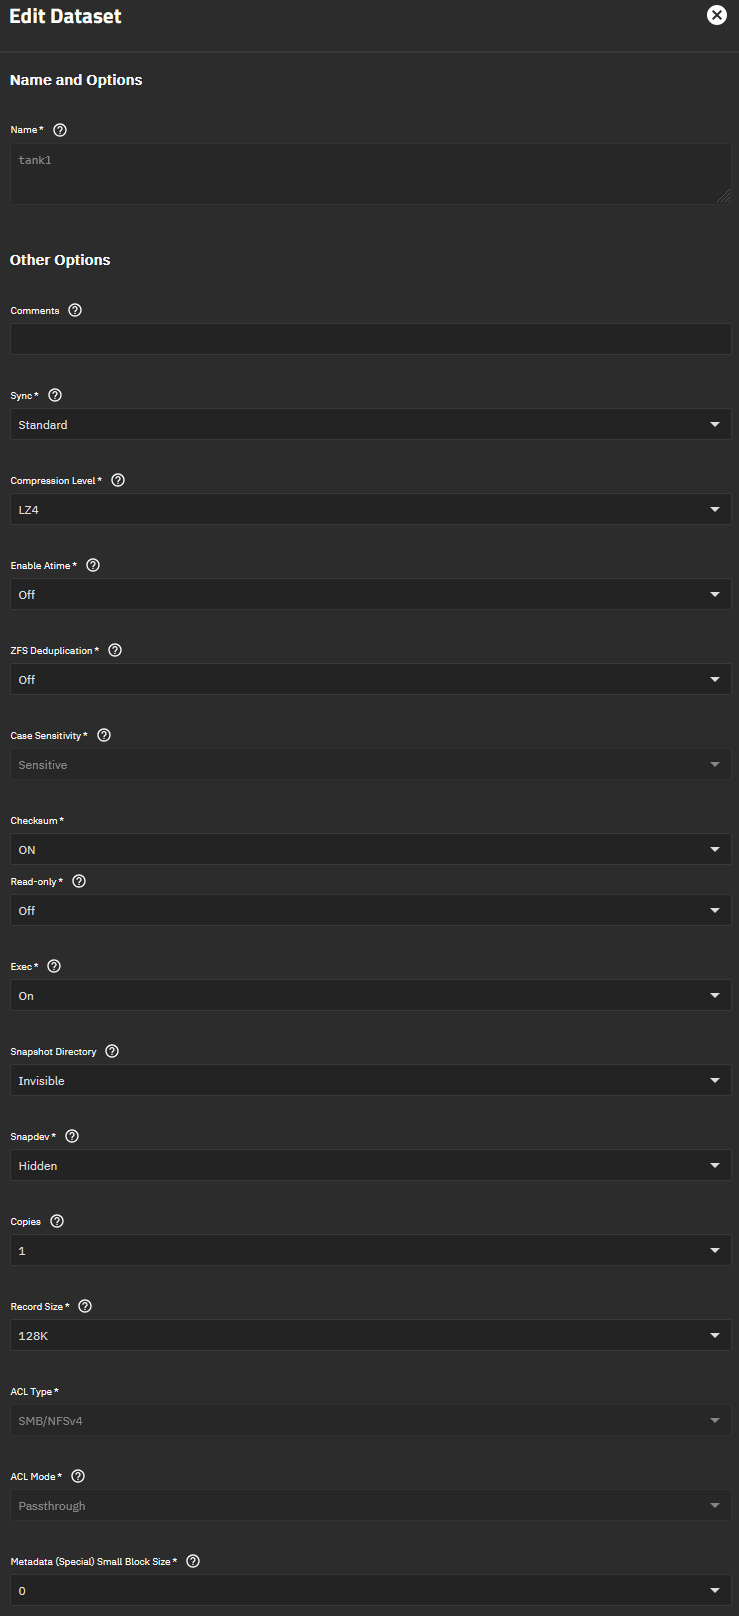
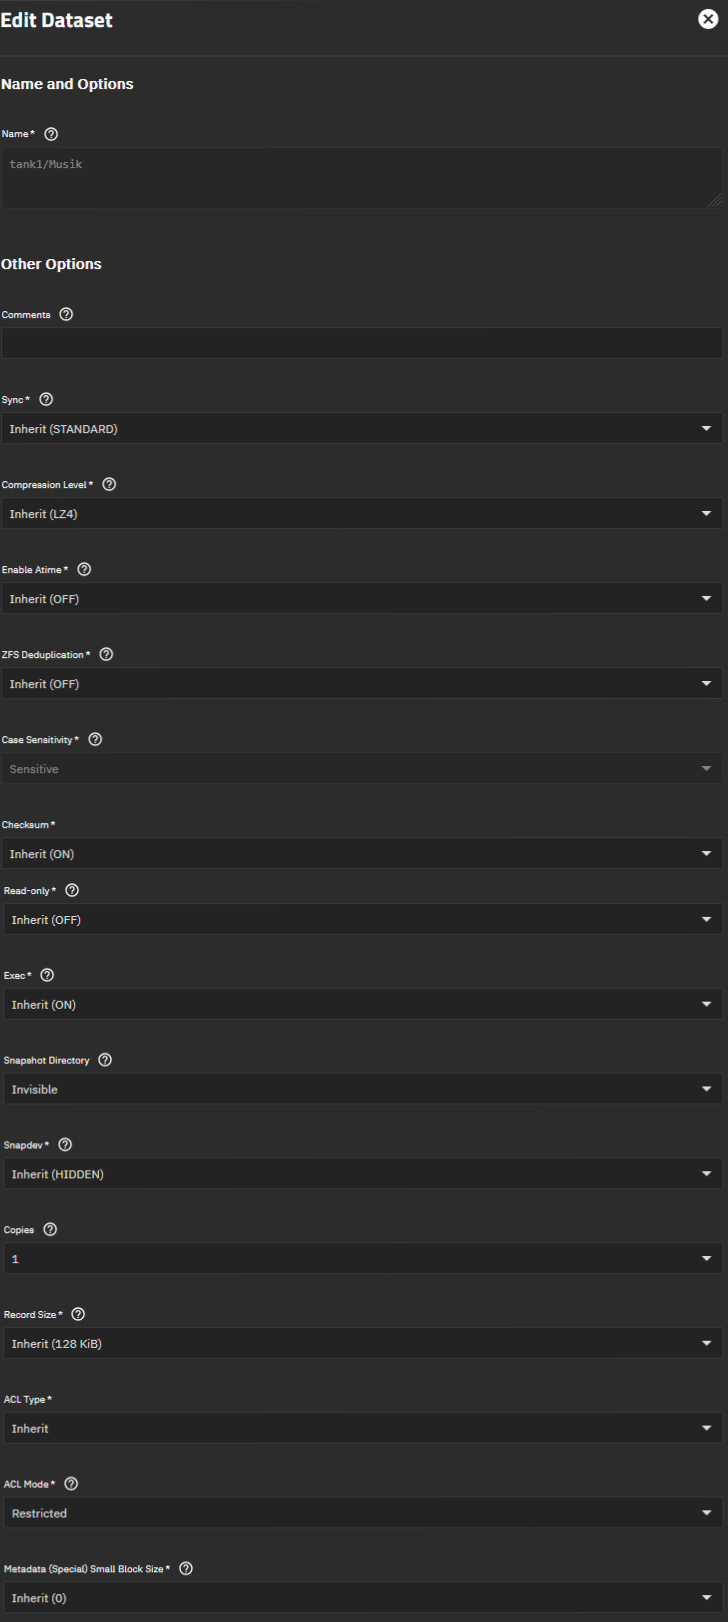
  3. checked dataset properties for unusual settings
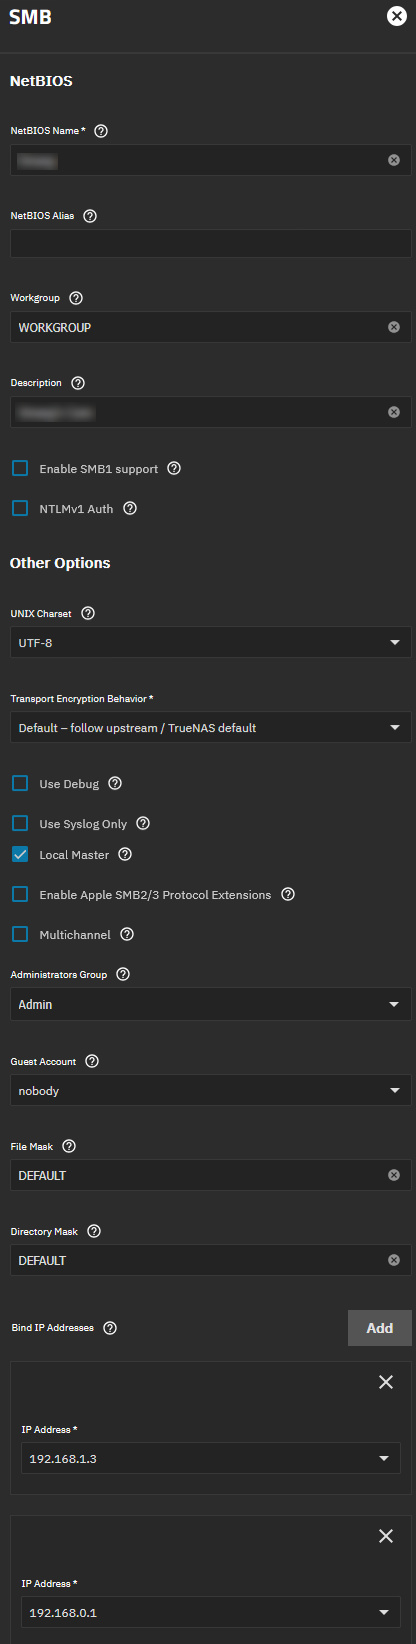
  4. checked smb settings
  5. upgraded the pools
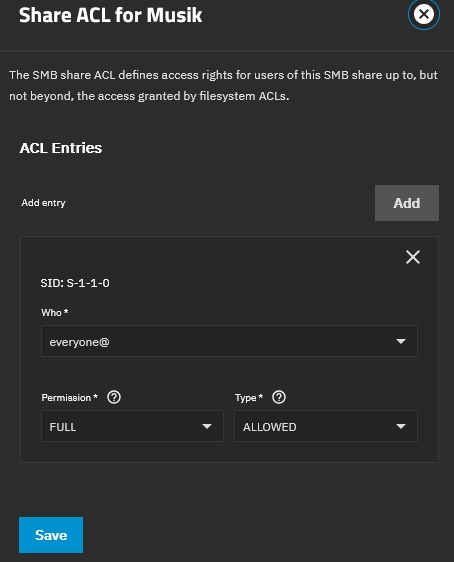
TrueNAS dataset and share settings screenshots:

root dataset properties:


music dataset properties:

music share ACL:

music ACL:

music SMB share settings:

global SMB settings:

I have been banging my head against this for the last week and I do not understand what the issue is. Hopefully some of you can enlighten me why the performance is so terribly inconsistent and how I can hopefully get it back to how it was under CORE.

Do you get these issues if using a dataset without encryption?

While not a 100% like for like comparison (different permissions with just 1 user + 1 group as ACLs and video files instead of audio files in the folders), other shares on an unencrypted pool with many subfolders open without hanging.

Could something have gone wrong during the replication from the old geli encrypted pool to the zfs encrypted pool? I had to enable encryption during the replication because it otherwise created unencrypted datasets in the encrypted root dataset. In the replication task I matched the passphrase of the target pool encryption.


From the UI pov it looks like that worked perfectly.

As a test, set the arc_meta_balance to a very high value, and then see if your directory performance improves after a few days of usage. Make sure you don’t reboot the system during this test!

Set it.

echo "8000" > /sys/module/zfs/parameters/zfs_arc_meta_balance

Verify it has been set.

cat /sys/module/zfs/parameters/zfs_arc_meta_balance

I’ve done that.

Will this change the memory usage in general?
This is the current usage after 19 days of uptime.

I thought they fixed this in the latest SCALE? :slightly_frowning_face:

Giving metadata priority in the ARC won’t help too much if the ARC itself is being restricted.

Can you check these:

cat /sys/module/zfs/parameters/zfs_arc_min
cat /sys/module/zfs/parameters/zfs_arc_max
cat /sys/module/zfs/parameters/zfs_arc_meta_limit
cat /sys/module/zfs/parameters/zfs_arc_meta_limit_percent
cat /sys/module/zfs/parameters/zfs_arc_meta_balance
arc_summary | grep "high water"
cat /sys/module/zfs/parameters/zfs_arc_min
cat /sys/module/zfs/parameters/zfs_arc_max
cat /sys/module/zfs/parameters/zfs_arc_meta_limit
cat /sys/module/zfs/parameters/zfs_arc_meta_limit_percent
cat /sys/module/zfs/parameters/zfs_arc_meta_balance
arc_summary | grep "high water"
0
0
cat: /sys/module/zfs/parameters/zfs_arc_meta_limit: No such file or directory
cat: /sys/module/zfs/parameters/zfs_arc_meta_limit_percent: No such file or directory
8000

arc_summary | grep "high water" yielded no output.


This ought to be the latest one, isn’t it?

Your zfs_arc_max is set to 0 which means “default”. The default for Linux is approximately 50% of your RAM. The default for FreeBSD is “RAM minus 1GB”.

I thought newer versions of SCALE were supposed to remove this default restriction.


I’m still on Core. I think in later releases of OpenZFS, arc_summary was replaced with another tool.

Other than importing my CORE config, importing the old pools and new pool and fixing the dataset and smb permissions I haven’t changed anything on the system. It was a clean install of TrueNAS-SCALE-25.04.2.3.iso.

Should I try to set that manually to fix the memory allocation (and if so, how)?

At this point, I don’t know. While the arc_meta_balance parameter is relatively safe, setting the arc_max parameter can lead to OOM crashes under certain setups and conditions.

See how it goes for the next couple days of regular usage of directory browsing and crawling with arc_meta_balance at 8000.

Later you can set the arc_max to a higher value.

I lost track of what the state of ARC on Linux is. It’s been through a few iterations with TrueNAS.

1 Like

zfs_arc_max being set to 0 sounds normal and intended.
After all, it’s the user’s way of overriding the default. If the system were to dynamically change that to control ARC size it would in essence be co-opting control of the parameter from the user.

While I am not sure exactly how TrueNAS changed the default, I do know that it happened in 24.04 as per the release notes.

  • ZFS ARC memory allocations are updated and behave identically to TrueNAS CORE.

As a datapoint, here’s an excerpt from my arc_summary:

ARC status:
        Total memory size:                                      62.7 GiB
        Min target size:                                3.1 %    2.0 GiB
        Max target size:                               98.4 %   61.7 GiB
        Target size (adaptive):                        77.2 %   47.7 GiB
        Current size:                                  77.2 %   47.6 GiB
        Free memory size:                                        8.2 GiB
        Available memory size:                                   6.0 GiB

My tunables are set to default values on my 25.04.2.4 system.

1 Like

The change was to override the default of 0 with a value that is calculated based on the amount of RAM detected in the system, so that the ARC could grow as large as it used to on Core (FreeBSD).

Maybe they changed it back to 0 after users crashed with OOM.

Maybe, but they have changed what the default means.
Here’s a screenshot from my system, again, no tunables have been set/changed:

And that’s with arc_max at 0?

Interesting. :thinking: We might need @HoneyBadger or @kris to weigh in.

% sudo cat /sys/module/zfs/parameters/zfs_arc_max
0

Yup.

1 Like

That’s a huge ZFS cache under Scale. Mine, on a lightly used server, is lucky to be at 50% and seems to flush with nothing going on. I only use the server to backup data from a Windows machine using Robocopy to sync about 13 TB of data. It was terrible when going from Core to Scale and I had to add in a L2ARC

I just went to the Windows explorer and did Properties for the main folder on the share. Scale decided Target Size (adaptive) should be about 13%. I really can’t figure out what Scale is doing with RAM and ARC / L2ARC

My graph is much flatter.
My system is (also) lightly used, but it does have more RAM (64 vs 18) to play with.

@655321 see how the tunable at 8000 for arc_meta_balance performs for the next 2-3 days.

1 Like

While that test is on-going here’s some further information:

Windows or Linux does not matter, Dolphin also times out

Yesterday I accessed the most problematic smb share on my Fedore 42 KDE HTPC via Dolphin. Dolphin timed out repeatedly while trying to load directories that contained 3000-9700 subfolders. After 2-3 attempts it was able to navigate into the folder and after I had done that for 5 such folders (with all timeouts amounting to >10min total), Dolphin was able to navigate into each of them quickly. However 4 hours later (after watching tv), it once again timed out when I tried to navigate into these folders.

NFS performs as it should, performance on par with CORE

When I access the same files via an NFS share (mounted in a docker container in Ubuntu server), I can traverse into the folders and list all files instantly. Yesterday I also had to fully rescan 1.1M files due to an unrelated problem and that took as long as it did under CORE via NFS.

Which brings me back to my hunch that it’s either my SMB settings or the ACLs that break the performance neck.

Scanning on one pool throttles writing to another pool

I also noticed that while copying music to the smb share on pool tank1 via 10GBit/s ethernet (usually sustains 300-500MByte/s due to the smallish files) that the speed slowed down to 10MByte/s when I used a different program (tinyMediaManager) to scan my TV shows share on pool tank for changes.
As the NIC has plenty of headroom and reads on one pool should not affect writes on another pool, this should never happen imho.

Did you have any auxiliary parameters set in SMB in CORE?
Have you sent any since moving to SCALE?