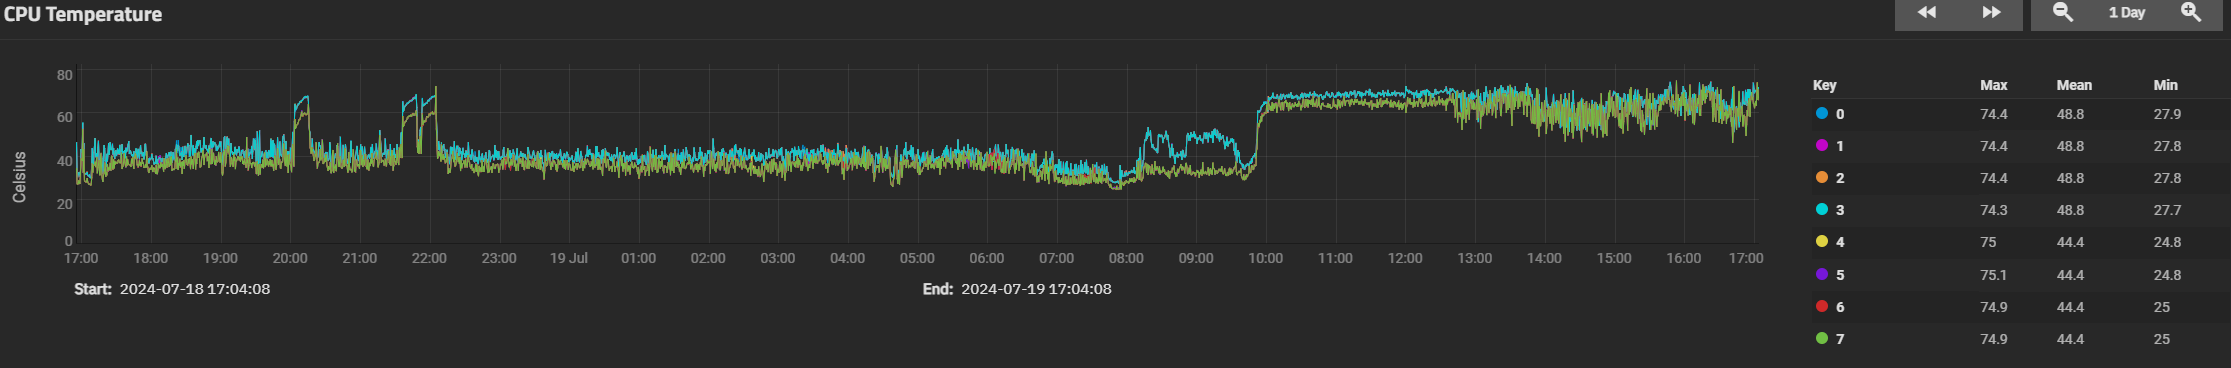
Hi, I was observing CPU temperature and for the last 1 hour it says my maximum CPU temp is 90 Celsius.
However, if I zoom out to 1 day, it says the maximum temperature is 74 Celsius, how is that possible? It seems to be making an average of the maximum???
This is not the first time this topic has come up and I know several bug tickets have been filed. Since you have not provided any details as to which version you are running, it is difficult to see if a fix has been implemented, which leads me to my next bullet.
You can search the forum and the bug reports on the CPU Reporting and you should find a few threads about it.
If you find something wrong, submit a bug report. If it is duplicate, the bug report system will display similar topics and maybe it has already been filed. Then you should read to find out if the problem was fixed and what version it should have been fixed in.
Thanks for being attentive enough to even see the discrepancy in the first place.
It is a brand new build from 24.04.1.1 updated to 24.04.2 only days after being built.
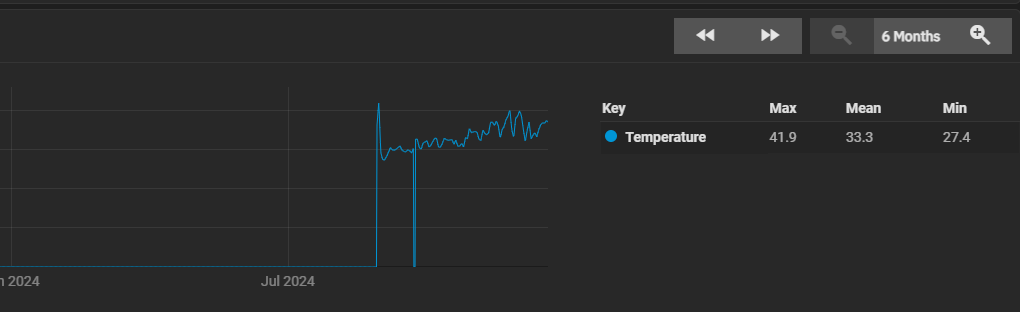
It seems to be affecting all reports, like if I zoom out on HDD temps the same thing happens I had a peak of 48 deg c but then when I zoom out the peak gets less and over time the peak reported on the dashboard also decreased.
In fact I cannot even find a 48 deg c peak on my drives anymore.
How can the maximum HDD temp over 6 months be less than over one month out of that 6? It seems that literally every single report is plagued by this bug so the reports cannot be trusted.
Yes, that’s correct. This is how reporting of this type generally works. Data is aggregated before the min/max/avg values for the reporting period are generated. The min/max/avg values are not absolute, otherwise they wouldn’t be relevant to the reporting period.
For example: if you’re reporting over a 24hr period you may be taking readings every 5mins, for a total of 24 * 12 = 288 readings. On a small chart it would be relevant to plot all datapoints and derive min/max/avg from actual reported values
But over a week that would mean 24 * 12 * 7 = 2,016 readings. There’s no need for that amount of accuracy over a week, so you aggregate your readings to 168 hourly ones, averaging the 12 values in each hour. It’s pointless to report min/max/avg on the absolute readings when you’re plotting hourly average values, though, as they’ll be wrong for the dataset you’re plotting.
I’m not a TruesNAS developer, but I’d say this was expected behaviour.
If I look at “max temp” I expect to see the maximum temp, not an average or anything except the maximum temp. Strongly disagree. If my CPU is running at maximum 110 deg c, and the chart is telling me maximum 90 dec c can you see the problem this presents?
With respect, that’s not what historical reporting is for. Rather, if you’re concerned about your system going over-temp or similar, you should be monitoring and raising alerts based on real-time values using something like librenms or a similar platform, not relying on looking at aggregated data from the past.
I am not sure your logic here. The maximum Historically should remain a constant. i.e. if my machine hits CPU = 110c (peak), any time period which that 110c was achieved should be reporting as 110c maximum. Anything other than this is a bug. If we have a MAXIMUM temperature in my city of 50 deg c, over time would I say the maximum was 48.9 deg c? Of course not… historically the maximum is 50c your logic is not sensible.
It has nothing to do with real time, one should be able to look at the historical data and see the maximum value historically. If my CPU hits 110c historically, that’s what I need to see as the maximum value, not some bogus data that is incorrect.
Going from 90c CPU temp to 75c CPU temp is not small, that’s a 15 degree difference!
It’s not “bogus” data or a bug, it’s just not the data you expect or want to see.
If lmsensors (or whatever sensor) samples the temp data every 5 minutes you’re still not seeing what goes on in the 4m59s between each sample. Is that bogus? No, it’s sampling and aggregating reporting data.
There are other data plotting packages out there that will give you the option of showing absolute and aggregated min/max/avg values, but it’s not the standard for enterprise use in my experience. I’d recommend you have a look at running up an MRTG instance to get started with, it can also do basic email alerting, iirc.
If overtemp situations are a concern for you I’d, again, strongly suggest you use a package that proactively alerts when thresholds are reached or passed as opposed to relying on you periodically checking historical data.
How is it able to report the data at the 1m view if it does not have the data? That makes no sense. You are saying that it knows my max CPU temp is 90c but it is perfectly fine for it to report it as 75c instead despite knowing that is not the case. this is not a polling interval issue clearly.
To put it simply, if lmsensors did not poll and detect that my CPU was 90 deg c, then why does the first chart show 90 deg c? lmsensors returned that data yes? So it should use that data, not discard it and provide a bogus reading. 75c IS a bogus reading because it is not my historical max temp.
Okay, it seems you have a different use case and expectation of functionality from most other people.
If you remain convinced this is a bug you should open a ticket for it as previously suggested. Or, what may be somewhat more constructive, file a feature request to include peak values alongside, or instead of, aggregated values
Your other option remains to spin up your own monitoring and alerting system that meets your specific needs. The tools are out there to do this. Good luck.
I don’t know a single person who looks at historical maximum values and expects to see any value other than the determined maximum… are you crazy?
If all the hard drives fail, and we do not get real time alert for whatever reason, what will we do? We will look at the historical data to see the cause. If the HDD temps reached 75 deg c they will probably fail! But the data will say they only reached 50 deg c so we will not know the root cause!!! Of course this is not acceptable.
I’m not shouting anything. I am pointing out that this software is reporting wrong vitals. Take from that what you will, nobody should rely on the “reports” from a TrueNAS device, they present incorrect figures, this is established fact.
If you are periodically checking the history of your HDD temps, you are getting incorrect maximum temp from the historical data. What is the point of inaccurate historical data? it serves literally no purpose, might as well just roll dice and give me a number…
I bet you would tell me that a broken clock is not broken it is working to spec because it tells the time once per day… “But the time was 13:52 yesterday!”
And what’s the purpose of your pointing this out? Do you want it fixed? Then report it as a bug. Or do you just want to complain? It’s your call, I guess.