In a different thread you mentioned swapping CPU with power applied such that the NAS accidentally began booting before you were done screwing the CPU in.
Perhaps your problems come down to ESD damage or simply working inside a system with power applied?
The effects of that would not necessarily be immediately apparent.
As an update, I had issues with Plex soon after changing out that RAM stick but not since. At least, not that I’ve seen. I’m not using Plex every day, and my wife had stopped using it after these issues, so until we get back into using it daily, it’ll be a while till I can really test.
I turned back on other apps now just to see if they’re fixed too, but I won’t know really for a few days.
RAM issues
Is it just me or is ECC memory supposed to report errors? The stick itself failed, and I didn’t get any notification about it. I just happened to notice because I was trying to make sure my BMC settings matched my new server.
Ah yeah, I also upgraded the UEFI and BMC as well recently. It could be a combination of things, but that RAM stick was 100% bad. It didn’t work in another nearly-identical server board with the same processor I had in this one.
Resilio-Sync issues
Resilio-Sync is the only one in a perpetual “Deploying” state. I tried restarting it and got that state again. Resilio-Sync is complaining about not having an open port though. That’s a completely different issue than the app getting kicked off.
Still, I’d like to figure out why it’s now having port issues whereas it didn’t in the past. Possibly because I turned off Host Networking, but that was many restarts ago:
Apparently you don’t fully understand snapshots and the fact that you have to set up a way to expire snapshots (retention period) on a schedule or you will end up with a gazillion snapshots and bog everything down and create a mess. Managing snapshots is explained in the documentation.
The official way is to use the GUI as outlined in the documentation. You can select up to 100 snapshots at a time you wish to remove and let Truenas remove them properly from the system. Using random shell commands found on the internet or elsewhere especially if you don’t understand explicitly what files the commands are to act on and to what snapshots the commands explicitly apply to can destroy your system.
Based on the screenshot it appears you set up the snapshots from the screen shot you posted and maybe did not set a retention period for snapshot rotation.
The only automated snapshots I know of that Truenas does is generally when you select to update an app. or the system and services are updated This provides a rollback point in case the update hangs or does not work correctly. These are one off snapshots for the current apps update and are not on any automated schedule. The snapshots will begin their name with update- or ix-applications-backup- These snapshots are not removed automatically and they will state that (Retention: Will not be destroyed automatically) in the drop down for each snapshot, but those would hardly equate to 9000 snapshots.
Apparently you don’t fully understand snapshots and the fact that you have to set up a way to expire snapshots (retention period)
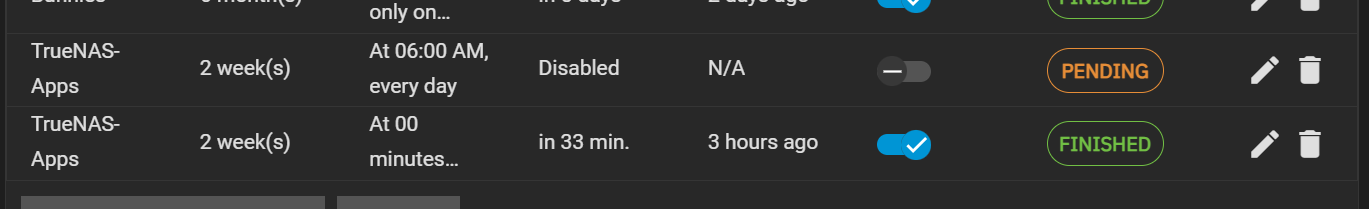
All my snapshots have retention periods including the TrueNAS Apps one, and you can see it in the screenshot: 2 weeks.
The reason I wanna script the deletion is because I have 9K snapshots. That’s a reasonable thing to ask.
Doing some simple math, it takes roughly 20-30 seconds to delete each set of 100 snapshots. If I was able to do them all in 20 seconds with no gaps in between, it would take a minimum of 30 minutes. Most likely, this is an hour of my time trying to delete them from the UI. I won’t sit here for nearly an hour trying to get these snapshots deleted with the same repetitive task. I would learn much more deleting them from CLI (which I’ve done in the past).
Either way, it seems like snapshots aren’t related to the stability issues I was having.
I think he’s snapshotting the application pool. Heavyscript does that also, updates, etc. If he is using PVC storage or a lot of apps, that greatly increases the datasets in the app pool. I’ve seen people use 1,000 for a single snapshot of the pool.
A cli to tell you if it’s that pool is:
zfs list -t snapshot | grep ix-applications | wc -l
What does that report? For me it’s 858.
For the replication task, in your screen capture, it says it did the snapshot 3 hours ago, yet, the next one is going to happen in 33 mins. That’s not 1/day?
Correct, I’m snapshotting the entire application pool.
You’re right. When I say TrueNAS created one, I see what happened now.
I created one to do daily snapshots, but when I created a replication task to move snapshots to another pool every 4 hours, that created a separate replication task. My bad. I just changed that to 2 days instead of 2 weeks.
This command returns 4554, but I manually removed 3-4 thousand snapshots earlier today:
zfs list -t snapshot | grep ix-applications | wc -l
Awesome, I suspected you may have had a replication task! So, you had a LOT more than the 4554 remaining then. It’s usually the application pool I find.
Also having this same issue. After being forced to move to DragonFish, TrueNAS has been absolutely unreliable. Anything that beats on the pools just instantly sends it into a reboot. I have no idea how to even check for it, as i’m not finding any sort of options for viewing logs or anything… so… kind of at a loss…
However, my TrueNAS has rebooted nearly TWENTY TIMES today… and this issue ONLY started happening today. Any kind of transfer to or from the pools, crashes TrueNAS within about a minute… along with this, i’m getting a ‘unable to start middleware’ error every other boot now, which is just as annoying…
And before someone says “its hardware related”, i can promise you its not, as its running in a VM, and has been happily running in this VM for 2 ish years now… I have already checked for RAM failures, its definitely not a PSU failure as it has redundant PSUs connected and both are showing green, I’m not seeing any drive failures anywhere, the HBA is passed directly through to the VM and is not showing any errors either on Host boot, or VM boot.
The weird part is, I cannot ‘watch’ the issue happen. If i have console open or the GUI open, the issue doesn’t occur. But when I’m not actively watching it, it goes down within minutes…
Sorry if this seems alil, angry or whatever… but, obviously i’m rather frustrated, as now i have to babysit a server all day to ensure my users are taken care of…
Maybe it’s a bad RAM stick. What ultimately solved my issue was replacing a bad stick of ECC DDR4 memory. Not sure why that was causing issues. I have an Eypc which I thought supports the full 8-bit error correction, but I wasn’t getting RAM module errors.
The only reason I found out was a couple times in the SuperMicro BMC, I noticed that stick was red.
Once I pulled it and moved it to an exact replica system, I noticed the issue there too.
I think Dragonfish had stability issues because ZFS is using more memory now. And that use of more RAM eventually was enough to trigger that bad RAM stick. Who knows how long it’s been bad.
The only thing that makes me think that its not RAM, is that I’m not seeing any errors, and no red sticks, or anything. TrueNAS is running as a VM, and thus isn’t getting actual direct access to the RAM as is, but instead just whatever is portioned to it. Thus, the ‘pool’ of RAM its using is moving around all over. If it were a bad stick, then all my other VMs would be experiencing issues as well, which they aren’t. I’m about to the point where i’m just going to export my pools and configs, and make a whole new VM from scratch. Then import the pools and configs, and hope to GOD that everything just… ‘works’… this is getting to be extremely problematic as i cannot keep any sort of service going at all… as the moment someone tries to do any sort of task, the storage just ‘disappears’…
Edit:
I am however, noticing something that pops up in the console/on the ‘screen’ every now and then. it goes away faster than I can read it, which is weird to me… as most things just, display stuff in order and whatever ‘happens next’ is just displayed on a new line. But with this, it displays about 5 lines of some error, but then is ‘cleared’ and the ‘the web user interface’ with the 1-9 options appears… kinda making this very hard to track down…
The most I can read before it wipes away is something about a ‘sync error’… whenever i can catch it, on the 4th time the error flicks up, is when it reboots. no kernel panic, no message, just greeted with the GRUB bootloader screen and then the TrueNAS “pick an option to boot from” menu…
(Holy crap, tried to reply to the message, but the forum just keeps replying ‘to myself’ instead… lol)
I’ll give this a try. I just got an alert from a different vm that i set up to specifically monitor the state of TrueNAS, and was able to catch it as it crashed. It said something about “middleware out of memory”. So maybe TrueNAS just isn’t reclaiming resources like it should. which would make some sense, as its only happening whenever a big hit to the drives occur. Aka any sort of download/upload that’s 2-3GB in size or more. For reference however, it is assigned 64GB of RAM within Proxmox, and i’m not really seeing it using more than 20GB of ram between ZFS and Services… but having a command to run to actually see the logs should hopefully be super helpful.
Edit:
Tried the command, and while it did show a lot of stuff, nothing that I can actually use, as its not giving me the ability to scroll up to read anything. only giving me the last 25-30 lines. Might have to wait for when I get home from work so I can attempt to SSH in and run the command… unless there’s just some way to ‘view’ the logs within the GUI (which is absolutely baffling to me as is that there just… isn’t a default way to see anything that’s actually ‘going on’ with TrueNAS from inside the GUI that I can find…)