Hi, yesterday i have add an used NVME disk extending an existing stripe pool… (finally ).
So used the GUI, and process end really fast without errors, pool shows healty.
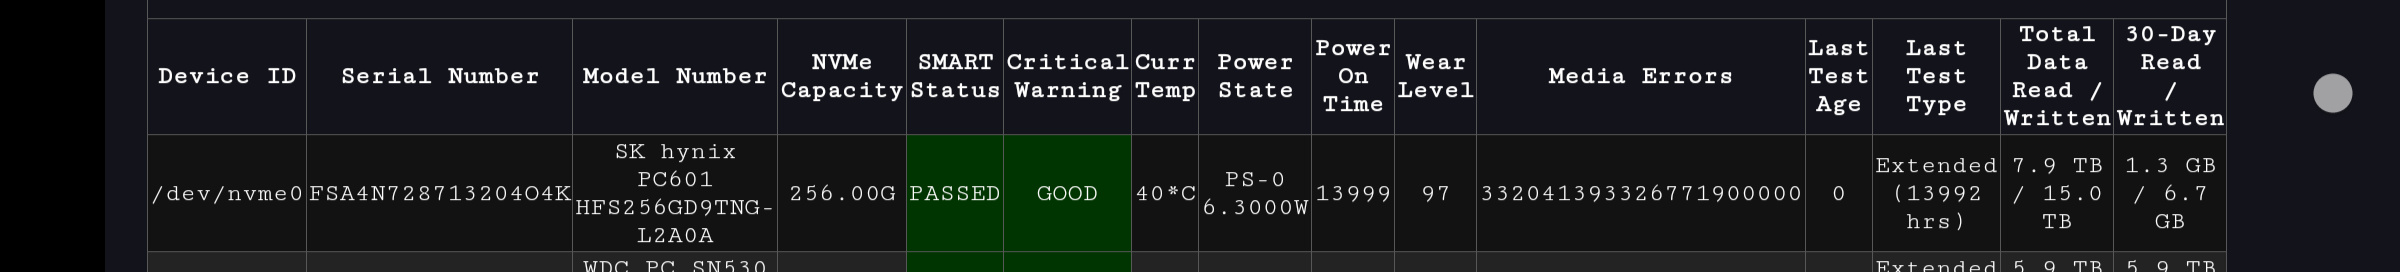
Only today i realize that this disk have a large amount of media and data integrity errors, despite he not fail smart or showed as “warning - danger”.
Let’s make sure the listing is valid.
At a command line prompt enter nvmecontrol logpage -p 0x02 nvme0
This should spit out a similar page to what you posted. The script used smartctl to generate the printout you were provided, this is a different way and we are communicating directly to the NVMe drive. I don’t expect any difference however we must eliminate smartctl is reporting incorrectly.
Also let’s list all the error information we can get: nvmecontrol logpage -p 0x01 nvme0 .
One last thing: nvmecontrol identify nvme0 and I’m looking for what version number you have, plus it provide some extra information that I likely do not need, but ask now just incase.
From the data posted, I actually see nothing wrong with the drive except the Media and Data Integrity Errors.
Definition: Media and Data Integrity Errors: Contains the number of occurrences where the controller detected an unrecovered data integrity error. Errors such as uncorrectable ECC, CRC checksum failure, or LBA tag mismatch are included in this field.
After posting the output of those commands, I would recommend you power down the system and remove the NVMe drive, clean the contacts with a normal pencil erasure, reinstall the drive ensuring it is fully seated and secure. Power on. Keep track of the error count, make sure it does not increase.
I really hope reseating the module corrects the issue but please grab the data first.
SMART/Health Information Log
============================
Critical Warning State: 0x00
Available spare: 0
Temperature: 0
Device reliability: 0
Read only: 0
Volatile memory backup: 0
Temperature: 314 K, 40.85 C, 105.53 F
Available spare: 100
Available spare threshold: 5
Percentage used: 3
Data units (512,000 byte) read: 15491636
Data units written: 29386872
Host read commands: 287170713
Host write commands: 894492096
Controller busy time (minutes): 6843
Power cycles: 40887
Power on hours: 14006
Unsafe shutdowns: 31
Media errors: 332041393326771929088
No. error info log entries: 6
Warning Temp Composite Time: 0
Error Temp Composite Time: 0
Temperature Sensor 1: 314 K, 40.85 C, 105.53 F
Temperature Sensor 2: 318 K, 44.85 C, 112.73 F
Temperature 1 Transition Count: 0
Temperature 2 Transition Count: 0
Total Time For Temperature 1: 0
Total Time For Temperature 2: 0
Error Information Log
=====================
No error entries found
Controller Capabilities/Features
================================
Vendor ID: 1c5c
Subsystem Vendor ID: 1c5c
Serial Number: FSA4N728713204O4K
Model Number: SK hynix PC601 HFS256GD9TNG-L2A0A
Firmware Version: HPS1
Recommended Arb Burst: 4
IEEE OUI Identifier: 2e e4 ac
Multi-Path I/O Capabilities: Not Supported
Max Data Transfer Size: 262144 bytes
Controller ID: 0x0001
Version: 1.3.0
Admin Command Set Attributes
============================
Security Send/Receive: Supported
Format NVM: Supported
Firmware Activate/Download: Supported
Namespace Management: Supported
Device Self-test: Supported
Directives: Not Supported
NVMe-MI Send/Receive: Not Supported
Virtualization Management: Not Supported
Doorbell Buffer Config: Not Supported
Get LBA Status: Not Supported
Sanitize: block,
Abort Command Limit: 4
Async Event Request Limit: 8
Number of Firmware Slots: 3
Firmware Slot 1 Read-Only: No
Per-Namespace SMART Log: No
Error Log Page Entries: 256
Number of Power States: 5
Total NVM Capacity: 256060514304 bytes
Unallocated NVM Capacity: 0 bytes
Firmware Update Granularity: 00 (Not Reported)
Host Buffer Preferred Size: 0 bytes
Host Buffer Minimum Size: 0 bytes
NVM Command Set Attributes
==========================
Submission Queue Entry Size
Max: 64
Min: 64
Completion Queue Entry Size
Max: 16
Min: 16
Number of Namespaces: 1
Compare Command: Supported
Write Uncorrectable Command: Supported
Dataset Management Command: Supported
Write Zeroes Command: Supported
Save Features: Supported
Reservations: Not Supported
Timestamp feature: Supported
Verify feature: Not Supported
Fused Operation Support: Not Supported
Format NVM Attributes: Per-NS Erase, Per-NS Format
Volatile Write Cache: Present
NVM Subsystem Name:
I grab the data, i will try to clean-reseat asap
EDIT: just finish to clean-reseat. Errors count is still there, but not increased
The value translates to 120000000000000000 hex, which looks much less threatening. I think maybe the wrong endian on the number 12 hex (20 decimal), or maybe some other interpretation issue (e g. top 16 bits are used for flags or whatever).
it make sense, and after your input i found other similar case (on same brand disk).
The value is really too high for be true (or i like to think it can’t be ).
Anyway, in 3 days it not increase… for now apart see that number in the dayli report don’t seems giving any problem (fingers crossed)
Time to dig up this thread for a few minutes. My wonderful 4TB NVMe that I’ve had for just over a year has thrown 24 Media Errors during a single Short test. Arg! I didn’t have issues until 24.10.1 was installed. Probably a coincidence but it’s is always nice to blame someone else.
Thankfully these have a 5 year warranty, I’m waiting on a response from the manufacturer which I hope to see in a few days.
After all this disk were replaced.
He give me random problem on reboot: disk disappear nor from BIOS and TN, magically back after some reboot, resilver a bunch of MB of data and then could be up and running for weeks flawlessy. Funny thing, used outside TN and never had this behaviour.
TrueNAS has some odd behaviour with respect for NVMe drives. TrueNAS “appears” to send the same drive commands that it would otherwise send to a standard HDD/SSD, but they are not that type of media/controller. I have so very many illegal commands recorded on all six of my NVMe drives, all thanks to TrueNAS. Maybe it has something to do with Debian, I really do not know. Smartmontools 7.5 will mask some of those errors.
These errors I have before the Media Errors, were illegal commands and the NVMe drive responded per the NVMe 1.4 standard says. But the Media Errors do have my attention. I am investigating more. I did build smartmontools 7.5 last night and while it hides the invalid commands, the Media Errors still exist, Pitty.