Post Dragonfish, multiple errors

After updating to Dragonfish a couple of weeks ago I’ve seen some errors popping up. Today I noticed the network shares were inaccessible and logged into find a number of errors that had popped up since last Friday (4 days ago).

Failed to sync TRUENAS catalog: [EFAULT] Failed to clone ‘GitHub - truenas/charts: TrueNAS SCALE Apps Catalogs & Charts’ repository at ‘/mnt/pool-01/ix-applications/catalogs/github_com_truenas_charts_git_master’ destination: [EFAULT] Failed to clone ‘GitHub - truenas/charts: TrueNAS SCALE Apps Catalogs & Charts’ repository at ‘/mnt/pool-01/ix-applications/catalogs/github_com_truenas_charts_git_master’ destination: fatal: destination path '/mnt/pool-01/ix-…
2024-09-14 12:34:13

In the Alerts section of the web gui there are also a few errors about “cannot open pool” because the pool being suspended.

In the CLI, I see a bunch of similar lines saying:

[904147.311288] systemd-journald[644] : Data hash table of /var/log/journal/blahblah/system.journal has a fill level at 75.0 (8544 of 11377 items, 6553600 file size, 786 bytes per has table item), suggesting rotation.

Then further down, it has a bunch of similar lines saying:

[1035710.287565] sd 2:0:4:0 Power-on or device reset occurred.

Not sure if all these issues are related, or coincidental?

If I run zpool status, it reports the state is SUSPENDED, status is One or more devices are faulted in response to IO failures, scan is scrub repaioreed 0B in 16:02:09 with 0 errors in Mon Sep 2.
All the drives are onlinem, but most have a read error count of 3, one has 6. They all have Write errors between 35 and 70.
I did see an Alert in the gui a couple of weeks ago after the update to Dragonfish that said there were 7 or 8 errors after a scan or scrub, but I can’t remember the specifics.

How do I find out where the real problem is? What should be next steps be?
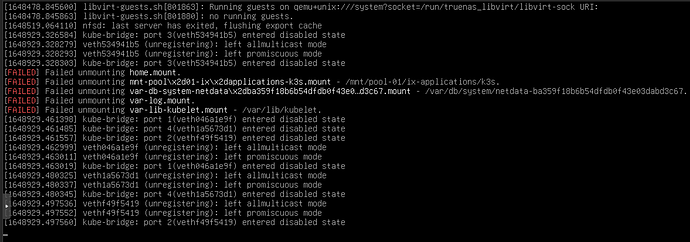
Looks like you have what may be a hardware issue there, but it’s impossible to say without more information.

You need to post a detailed description of the hardware in use, exact TrueNAS version and if you a virtual machine is involved.

The output of zpool status is also going to be vital in order to understand the current pool situation (post the full output).

The TrueCharts issue has happened to everyone because TrueCharts closed and removed their catalogue.

I also had the same message about a system journal being 75% full, and researched it and it is a very minor bug and can be ignored.

The main issue you need to focus on is the pool being suspended.

A full copy and paste of the zpool status -v output would be useful, but if it is still online that is a good thing.

Your first steps should be to run a SHORT smart test on all your drives, and then when that has finished see if there are any errors (indicating whether your drives are working at a basic level or not).

If all the SHORT tests pass, run a Long test on each drive (to check every sector). You can run these in parallel. Wait for these to finish and see if there are any errors.

Finally, if your pool is still online, you can run a scrub and wait for that to finish and see what the results are.

If you get any errors at all in any of the above, don’t do anything further but instead post the results here so that we can advise you.

DO NOT TAKE RANDOM ACTIONS THAT YOU MIGHT READ ONLINE (including this one) WITHOUT GETTING ADVICE ON WHETHER IT IS SENSIBLE. A badly considered action can turn a recoverable pool into an irrecoverable one.

P.S. I am not a ZFS expert - get a second opinion.

Here is the output:

Output of zpool status -v

pool: boot-pool
state: ONLINE
status: Some supported and requested features are not enabled on the pool.
The pool can still be used, but some features are unavailable.
action: Enable all features using ‘zpool upgrade’. Once this is done,
the pool may no longer be accessible by software that does not support
the features. See zpool-features(7) for details.
scan: scrub repaired 0B in 00:00:29 with 0 errors on Fri Sep 13 03:45:31 2024
config:

    NAME        STATE     READ WRITE CKSUM
    boot-pool   ONLINE       0     0     0
      sda3      ONLINE       0     0     0

errors: No known data errors

pool: pool-01
state: SUSPENDED
status: One or more devices are faulted in response to IO failures.
action: Make sure the affected devices are connected, then run ‘zpool clear’.
see: Message ID: ZFS-8000-JQ — OpenZFS documentation
scan: scrub repaired 0B in 16:02:09 with 0 errors on Mon Sep 2 19:32:11 2024
config:

    NAME                                      STATE     READ WRITE CKSUM
    pool-01                                   ONLINE       0     0     0
      raidz2-0                                ONLINE       6    70     0
        714829f4-4998-48c6-aee6-bcba7d5e5cd7  ONLINE       3    36     0
        6f4302bf-871c-4986-a564-8f0378cbce31  ONLINE       3    37     0
        0e93fd9e-a41d-4d89-a43d-c2dccde1727d  ONLINE       3    35     0
        835ce145-2b3d-48b3-b474-c5747fadd00b  ONLINE       3    37     0
        2197ba64-6e1e-404e-899c-61a70c741ee7  ONLINE       3    37     0
        e9a9b999-0918-42eb-982f-fbd9eb81f37f  ONLINE       3    36     0
        51f19c86-369c-4f72-a892-bb66ab1753f6  ONLINE       3    41     0
        6a6fe3f6-6ce3-48bb-b686-fbf4f53bcf32  ONLINE       3    39     0

errors: List of errors unavailable: pool I/O is currently suspended

It’s running on Dragonfish-24.04.2. The hardware is a Supermicro board, w/ ECC memory, and 8x 10TB drives connected to a LSI 9200-8e which is passed through to a VM running TrueNAS on Proxmox.


It is online but parts aren’t working. I can’t seem to run any SMART tests from the GUI, and a bunch of other things.

SHORT test output

=== START OF INFORMATION SECTION ===
Device Model: WDC WD121KFBX-68EF5N0
Serial Number: 5QJRX22B
LU WWN Device Id: 5 000cca 2b0e69888
Firmware Version: 83.00A83
User Capacity: 12,000,138,625,024 bytes [12.0 TB]
Sector Sizes: 512 bytes logical, 4096 bytes physical
Rotation Rate: 7200 rpm
Form Factor: 3.5 inches
Device is: Not in smartctl database 7.3/5528
ATA Version is: ACS-2, ATA8-ACS T13/1699-D revision 4
SATA Version is: SATA 3.2, 6.0 Gb/s (current: 6.0 Gb/s)
Local Time is: Wed Sep 18 16:40:55 2024 EDT
SMART support is: Available - device has SMART capability.
SMART support is: Enabled

=== START OF READ SMART DATA SECTION ===
SMART overall-health self-assessment test result: PASSED

SMART Attributes Data Structure revision number: 16
Vendor Specific SMART Attributes with Thresholds:
ID# ATTRIBUTE_NAME FLAG VALUE WORST THRESH TYPE UPDATED WHEN_FAILED RAW_VALUE
1 Raw_Read_Error_Rate 0x000b 100 100 016 Pre-fail Always - 0
2 Throughput_Performance 0x0004 132 132 054 Old_age Offline - 96
3 Spin_Up_Time 0x0007 100 100 024 Pre-fail Always - 0
4 Start_Stop_Count 0x0012 100 100 000 Old_age Always - 8
5 Reallocated_Sector_Ct 0x0033 100 100 005 Pre-fail Always - 0
7 Seek_Error_Rate 0x000a 100 100 067 Old_age Always - 0
8 Seek_Time_Performance 0x0004 140 140 020 Old_age Offline - 15
9 Power_On_Hours 0x0012 099 099 000 Old_age Always - 10464
10 Spin_Retry_Count 0x0012 100 100 060 Old_age Always - 0
12 Power_Cycle_Count 0x0032 100 100 000 Old_age Always - 7
22 Unknown_Attribute 0x0023 100 100 025 Pre-fail Always - 100
192 Power-Off_Retract_Count 0x0032 100 100 000 Old_age Always - 536
193 Load_Cycle_Count 0x0012 100 100 000 Old_age Always - 536
194 Temperature_Celsius 0x0002 187 187 000 Old_age Always - 32 (Min/Max 19/50)
196 Reallocated_Event_Count 0x0032 100 100 000 Old_age Always - 0
197 Current_Pending_Sector 0x0022 100 100 000 Old_age Always - 0
198 Offline_Uncorrectable 0x0008 100 100 000 Old_age Offline - 0
199 UDMA_CRC_Error_Count 0x000a 200 200 000 Old_age Always - 0

SMART Error Log Version: 1
No Errors Logged

SMART Self-test log structure revision number 1
Num Test_Description Status Remaining LifeTime(hours) LBA_of_first_error

1 Short offline Completed without error 00% 10464 -

2 Short offline Completed without error 00% 10464 -

3 Short offline Completed without error 00% 10451 -

4 Short offline Completed without error 00% 10427 -

5 Extended offline Completed without error 00% 10401 -

6 Short offline Completed without error 00% 10379 -

7 Short offline Completed without error 00% 10355 -

8 Short offline Completed without error 00% 10331 -

9 Short offline Completed without error 00% 10307 -

#10 Short offline Completed without error 00% 10283 -
#11 Short offline Completed without error 00% 10259 -
#12 Extended offline Completed without error 00% 10233 -
#13 Short offline Completed without error 00% 10211 -
#14 Short offline Completed without error 00% 10187 -
#15 Short offline Completed without error 00% 10163 -
#16 Short offline Completed without error 00% 10149 -
#17 Short offline Completed without error 00% 10091 -
#18 Extended offline Completed without error 00% 10066 -
#19 Short offline Completed without error 00% 10043 -
#20 Short offline Completed without error 00% 10019 -
#21 Short offline Completed without error 00% 9995 -

Should I post this for all the drives, or is there a specific set of values I should be looking at?

Ran SHORT tests on all the drives. Most were nominal, but this output was different.
Going to run the LONG test tonight.

Summary

Error 15 occurred at disk power-on lifetime: 10088 hours (420 days + 8 hours)
When the command that caused the error occurred, the device was active or idle.

After command completion occurred, registers were:
ER ST SC SN CL CH DH


84 41 00 00 00 00 00 Error: ICRC, ABRT at LBA = 0x00000000 = 0

Commands leading to the command that caused the error were:
CR FR SC SN CL CH DH DC Powered_Up_Time Command/Feature_Name


60 28 00 48 7d 0e 40 00 28d+02:15:22.414 READ FPDMA QUEUED
60 30 08 18 7d 0e 40 00 28d+02:15:22.413 READ FPDMA QUEUED
60 28 00 f0 7c 0e 40 00 28d+02:15:22.413 READ FPDMA QUEUED
60 28 00 c0 7c 0e 40 00 28d+02:15:22.413 READ FPDMA QUEUED
60 98 10 28 7b 0e 40 00 28d+02:15:22.396 READ FPDMA QUEUED

Error 14 occurred at disk power-on lifetime: 10084 hours (420 days + 4 hours)
When the command that caused the error occurred, the device was active or idle.

After command completion occurred, registers were:
ER ST SC SN CL CH DH


84 41 00 00 00 00 00 Error: ICRC, ABRT at LBA = 0x00000000 = 0

Commands leading to the command that caused the error were:
CR FR SC SN CL CH DH DC Powered_Up_Time Command/Feature_Name


60 d8 00 f8 ca e8 40 00 27d+22:17:32.108 READ FPDMA QUEUED
60 30 10 c8 ca e8 40 00 27d+22:17:32.101 READ FPDMA QUEUED
60 28 00 a0 ca e8 40 00 27d+22:17:32.101 READ FPDMA QUEUED
60 a0 08 f8 c5 e8 40 00 27d+22:17:32.096 READ FPDMA QUEUED
60 10 00 e8 c2 e8 40 00 27d+22:17:32.096 READ FPDMA QUEUED

Error 13 occurred at disk power-on lifetime: 10078 hours (419 days + 22 hours)
When the command that caused the error occurred, the device was active or idle.

After command completion occurred, registers were:
ER ST SC SN CL CH DH


84 41 00 00 00 00 00 Error: ICRC, ABRT at LBA = 0x00000000 = 0

Commands leading to the command that caused the error were:
CR FR SC SN CL CH DH DC Powered_Up_Time Command/Feature_Name


60 b0 08 e0 a9 a9 40 00 27d+16:32:58.158 READ FPDMA QUEUED
60 10 00 c0 ad a9 40 00 27d+16:32:58.156 READ FPDMA QUEUED
60 28 00 98 ad a9 40 00 27d+16:32:58.156 READ FPDMA QUEUED
60 90 00 50 a5 a9 40 00 27d+16:32:58.153 READ FPDMA QUEUED
60 28 00 28 a5 a9 40 00 27d+16:32:58.153 READ FPDMA QUEUED

Error 12 occurred at disk power-on lifetime: 10076 hours (419 days + 20 hours)
When the command that caused the error occurred, the device was active or idle.

After command completion occurred, registers were:
ER ST SC SN CL CH DH


84 41 00 00 00 00 00 Error: ICRC, ABRT at LBA = 0x00000000 = 0

Commands leading to the command that caused the error were:
CR FR SC SN CL CH DH DC Powered_Up_Time Command/Feature_Name


60 e0 10 80 81 5e 40 00 27d+14:19:53.166 READ FPDMA QUEUED
60 00 08 80 7e 5e 40 00 27d+14:19:53.163 READ FPDMA QUEUED
60 f8 00 30 7b 5e 40 00 27d+14:19:53.163 READ FPDMA QUEUED
60 28 08 58 7e 5e 40 00 27d+14:19:53.162 READ FPDMA QUEUED
60 30 00 28 7e 5e 40 00 27d+14:19:53.162 READ FPDMA QUEUED

Error 11 occurred at disk power-on lifetime: 10075 hours (419 days + 19 hours)
When the command that caused the error occurred, the device was active or idle.

After command completion occurred, registers were:
ER ST SC SN CL CH DH


84 41 00 00 00 00 00 Error: ICRC, ABRT at LBA = 0x00000000 = 0

Commands leading to the command that caused the error were:
CR FR SC SN CL CH DH DC Powered_Up_Time Command/Feature_Name


60 e0 10 58 f4 85 40 00 27d+13:19:08.739 READ FPDMA QUEUED
60 18 00 98 f9 85 40 00 27d+13:19:08.739 READ FPDMA QUEUED
60 30 08 68 f9 85 40 00 27d+13:19:08.738 READ FPDMA QUEUED
60 28 00 40 f9 85 40 00 27d+13:19:08.738 READ FPDMA QUEUED
60 30 08 28 f4 85 40 00 27d+13:19:08.738 READ FPDMA QUEUED

The power-on hours for the non-error example you posted were 10,464.

Assuming that all drives have the same power on hours (have to assume because you didn’t post the full output from the failing drive), then these errors were intermittent and were c. 400 hours ago (2.5 weeks).

Please post the full output from the failing drive and use the code block so that it is formatted correctly.

Two suggestions for causes of these SMART error logs from internet research:

  1. A bad SATA cable
  2. A power off during a SMART test

The drives have different power on hours. I’ll post all 8 of the LONG test output once they complete. When I started it estimated 20+ hours.

Here is the one that had the above posted errors.

/sde SMART output after SHORT test.
admin@truenas[~]$ sudo smartctl -a /dev/sde
smartctl 7.4 2023-08-01 r5530 [x86_64-linux-6.6.32-production+truenas] (local build)
Copyright (C) 2002-23, Bruce Allen, Christian Franke, www.smartmontools.org

=== START OF INFORMATION SECTION ===
Device Model:     WDC WD121KFBX-68EF5N0
Serial Number:    D7G2PHMN
LU WWN Device Id: 5 000cca 2dfc13977
Firmware Version: 83.00A83
User Capacity:    12,000,138,625,024 bytes [12.0 TB]
Sector Sizes:     512 bytes logical, 4096 bytes physical
Rotation Rate:    7200 rpm
Form Factor:      3.5 inches
Device is:        Not in smartctl database 7.3/5528
ATA Version is:   ACS-2, ATA8-ACS T13/1699-D revision 4
SATA Version is:  SATA 3.2, 6.0 Gb/s (current: 6.0 Gb/s)
Local Time is:    Fri Sep 20 15:01:25 2024 EDT
SMART support is: Available - device has SMART capability.
SMART support is: Enabled

=== START OF READ SMART DATA SECTION ===
SMART overall-health self-assessment test result: PASSED

General SMART Values:
Offline data collection status:  (0x82) Offline data collection activity
                                        was completed without error.
                                        Auto Offline Data Collection: Enabled.
Self-test execution status:      ( 241) Self-test routine in progress...
                                        10% of test remaining.
Total time to complete Offline
data collection:                (   87) seconds.
Offline data collection
capabilities:                    (0x5b) SMART execute Offline immediate.
                                        Auto Offline data collection on/off support.
                                        Suspend Offline collection upon new
                                        command.
                                        Offline surface scan supported.
                                        Self-test supported.
                                        No Conveyance Self-test supported.
                                        Selective Self-test supported.
SMART capabilities:            (0x0003) Saves SMART data before entering
                                        power-saving mode.
                                        Supports SMART auto save timer.
Error logging capability:        (0x01) Error logging supported.
                                        General Purpose Logging supported.
Short self-test routine
recommended polling time:        (   2) minutes.
Extended self-test routine
recommended polling time:        (1188) minutes.
SCT capabilities:              (0x003d) SCT Status supported.
                                        SCT Error Recovery Control supported.
                                        SCT Feature Control supported.
                                        SCT Data Table supported.

SMART Attributes Data Structure revision number: 16
Vendor Specific SMART Attributes with Thresholds:
ID# ATTRIBUTE_NAME          FLAG     VALUE WORST THRESH TYPE      UPDATED  WHEN_FAILED RAW_VALUE
  1 Raw_Read_Error_Rate     0x000b   100   100   016    Pre-fail  Always       -       0
  2 Throughput_Performance  0x0004   133   133   054    Old_age   Offline      -       92
  3 Spin_Up_Time            0x0007   100   100   024    Pre-fail  Always       -       0
  4 Start_Stop_Count        0x0012   100   100   000    Old_age   Always       -       8
  5 Reallocated_Sector_Ct   0x0033   100   100   005    Pre-fail  Always       -       0
  7 Seek_Error_Rate         0x000a   100   100   067    Old_age   Always       -       0
  8 Seek_Time_Performance   0x0004   140   140   020    Old_age   Offline      -       15
  9 Power_On_Hours          0x0012   099   099   000    Old_age   Always       -       10516
 10 Spin_Retry_Count        0x0012   100   100   060    Old_age   Always       -       0
 12 Power_Cycle_Count       0x0032   100   100   000    Old_age   Always       -       7
 22 Unknown_Attribute       0x0023   100   100   025    Pre-fail  Always       -       100
192 Power-Off_Retract_Count 0x0032   100   100   000    Old_age   Always       -       601
193 Load_Cycle_Count        0x0012   100   100   000    Old_age   Always       -       601
194 Temperature_Celsius     0x0002   166   166   000    Old_age   Always       -       36 (Min/Max 19/50)
196 Reallocated_Event_Count 0x0032   100   100   000    Old_age   Always       -       0
197 Current_Pending_Sector  0x0022   100   100   000    Old_age   Always       -       0
198 Offline_Uncorrectable   0x0008   100   100   000    Old_age   Offline      -       0
199 UDMA_CRC_Error_Count    0x000a   200   200   000    Old_age   Always       -       15

SMART Error Log Version: 1
ATA Error Count: 15 (device log contains only the most recent five errors)
        CR = Command Register [HEX]
        FR = Features Register [HEX]
        SC = Sector Count Register [HEX]
        SN = Sector Number Register [HEX]
        CL = Cylinder Low Register [HEX]
        CH = Cylinder High Register [HEX]
        DH = Device/Head Register [HEX]
        DC = Device Command Register [HEX]
        ER = Error register [HEX]
        ST = Status register [HEX]
Powered_Up_Time is measured from power on, and printed as
DDd+hh:mm:SS.sss where DD=days, hh=hours, mm=minutes,
SS=sec, and sss=millisec. It "wraps" after 49.710 days.

Error 15 occurred at disk power-on lifetime: 10088 hours (420 days + 8 hours)
  When the command that caused the error occurred, the device was active or idle.

  After command completion occurred, registers were:
  ER ST SC SN CL CH DH
  -- -- -- -- -- -- --
  84 41 00 00 00 00 00  Error: ICRC, ABRT at LBA = 0x00000000 = 0

  Commands leading to the command that caused the error were:
  CR FR SC SN CL CH DH DC   Powered_Up_Time  Command/Feature_Name
  -- -- -- -- -- -- -- --  ----------------  --------------------
  60 28 00 48 7d 0e 40 00  28d+02:15:22.414  READ FPDMA QUEUED
  60 30 08 18 7d 0e 40 00  28d+02:15:22.413  READ FPDMA QUEUED
  60 28 00 f0 7c 0e 40 00  28d+02:15:22.413  READ FPDMA QUEUED
  60 28 00 c0 7c 0e 40 00  28d+02:15:22.413  READ FPDMA QUEUED
  60 98 10 28 7b 0e 40 00  28d+02:15:22.396  READ FPDMA QUEUED

Error 14 occurred at disk power-on lifetime: 10084 hours (420 days + 4 hours)
  When the command that caused the error occurred, the device was active or idle.

  After command completion occurred, registers were:
  ER ST SC SN CL CH DH
  -- -- -- -- -- -- --
  84 41 00 00 00 00 00  Error: ICRC, ABRT at LBA = 0x00000000 = 0

  Commands leading to the command that caused the error were:
  CR FR SC SN CL CH DH DC   Powered_Up_Time  Command/Feature_Name
  -- -- -- -- -- -- -- --  ----------------  --------------------
  60 d8 00 f8 ca e8 40 00  27d+22:17:32.108  READ FPDMA QUEUED
  60 30 10 c8 ca e8 40 00  27d+22:17:32.101  READ FPDMA QUEUED
  60 28 00 a0 ca e8 40 00  27d+22:17:32.101  READ FPDMA QUEUED
  60 a0 08 f8 c5 e8 40 00  27d+22:17:32.096  READ FPDMA QUEUED
  60 10 00 e8 c2 e8 40 00  27d+22:17:32.096  READ FPDMA QUEUED

Error 13 occurred at disk power-on lifetime: 10078 hours (419 days + 22 hours)
  When the command that caused the error occurred, the device was active or idle.

  After command completion occurred, registers were:
  ER ST SC SN CL CH DH
  -- -- -- -- -- -- --
  84 41 00 00 00 00 00  Error: ICRC, ABRT at LBA = 0x00000000 = 0

  Commands leading to the command that caused the error were:
  CR FR SC SN CL CH DH DC   Powered_Up_Time  Command/Feature_Name
  -- -- -- -- -- -- -- --  ----------------  --------------------
  60 b0 08 e0 a9 a9 40 00  27d+16:32:58.158  READ FPDMA QUEUED
  60 10 00 c0 ad a9 40 00  27d+16:32:58.156  READ FPDMA QUEUED
  60 28 00 98 ad a9 40 00  27d+16:32:58.156  READ FPDMA QUEUED
  60 90 00 50 a5 a9 40 00  27d+16:32:58.153  READ FPDMA QUEUED
  60 28 00 28 a5 a9 40 00  27d+16:32:58.153  READ FPDMA QUEUED

Error 12 occurred at disk power-on lifetime: 10076 hours (419 days + 20 hours)
  When the command that caused the error occurred, the device was active or idle.

  After command completion occurred, registers were:
  ER ST SC SN CL CH DH
  -- -- -- -- -- -- --
  84 41 00 00 00 00 00  Error: ICRC, ABRT at LBA = 0x00000000 = 0

  Commands leading to the command that caused the error were:
  CR FR SC SN CL CH DH DC   Powered_Up_Time  Command/Feature_Name
  -- -- -- -- -- -- -- --  ----------------  --------------------
  60 e0 10 80 81 5e 40 00  27d+14:19:53.166  READ FPDMA QUEUED
  60 00 08 80 7e 5e 40 00  27d+14:19:53.163  READ FPDMA QUEUED
  60 f8 00 30 7b 5e 40 00  27d+14:19:53.163  READ FPDMA QUEUED
  60 28 08 58 7e 5e 40 00  27d+14:19:53.162  READ FPDMA QUEUED
  60 30 00 28 7e 5e 40 00  27d+14:19:53.162  READ FPDMA QUEUED

Error 11 occurred at disk power-on lifetime: 10075 hours (419 days + 19 hours)
  When the command that caused the error occurred, the device was active or idle.

  After command completion occurred, registers were:
  ER ST SC SN CL CH DH
  -- -- -- -- -- -- --
  84 41 00 00 00 00 00  Error: ICRC, ABRT at LBA = 0x00000000 = 0

  Commands leading to the command that caused the error were:
  CR FR SC SN CL CH DH DC   Powered_Up_Time  Command/Feature_Name
  -- -- -- -- -- -- -- --  ----------------  --------------------
  60 e0 10 58 f4 85 40 00  27d+13:19:08.739  READ FPDMA QUEUED
  60 18 00 98 f9 85 40 00  27d+13:19:08.739  READ FPDMA QUEUED
  60 30 08 68 f9 85 40 00  27d+13:19:08.738  READ FPDMA QUEUED
  60 28 00 40 f9 85 40 00  27d+13:19:08.738  READ FPDMA QUEUED
  60 30 08 28 f4 85 40 00  27d+13:19:08.738  READ FPDMA QUEUED

SMART Self-test log structure revision number 1
Num  Test_Description    Status                  Remaining  LifeTime(hours)  LBA_of_first_error
# 1  Short offline       Completed without error       00%     10480         -
# 2  Short offline       Completed without error       00%     10470         -
# 3  Short offline       Completed without error       00%     10469         -
# 4  Short offline       Completed without error       00%     10456         -
# 5  Short offline       Completed without error       00%     10432         -
# 6  Extended offline    Completed without error       00%     10405         -
# 7  Short offline       Completed without error       00%     10384         -
# 8  Short offline       Completed without error       00%     10360         -
# 9  Short offline       Completed without error       00%     10336         -
#10  Short offline       Completed without error       00%     10312         -
#11  Short offline       Completed without error       00%     10288         -
#12  Short offline       Completed without error       00%     10264         -
#13  Extended offline    Completed without error       00%     10238         -
#14  Short offline       Completed without error       00%     10216         -
#15  Short offline       Completed without error       00%     10192         -
#16  Extended offline    Completed without error       00%     10174         -
#17  Short offline       Completed without error       00%     10096         -
#18  Extended offline    Completed without error       00%     10071         -
#19  Short offline       Completed without error       00%     10048         -
#20  Short offline       Completed without error       00%     10024         -
#21  Short offline       Completed without error       00%     10000         -

SMART Selective self-test log data structure revision number 1
 SPAN  MIN_LBA  MAX_LBA  CURRENT_TEST_STATUS
    1        0        0  Not_testing
    2        0        0  Not_testing
    3        0        0  Not_testing
    4        0        0  Not_testing
    5        0        0  Not_testing
Selective self-test flags (0x0):
  After scanning selected spans, do NOT read-scan remainder of disk.
If Selective self-test is pending on power-up, resume after 0 minute delay.

The above only provides legacy SMART information - try 'smartctl -x' for more

admin@truenas[~]$

Is the above the format I should use?

CRC errors, bad cable or port perhaps.

1 Like

Ok interesting. For my knowledge, where is it showing CRC errors in that SHORT test output?
What value(s) should I look at to see if the error count is increasing?

The drives are in a chassis, with a backplane so I hope a re-seating of the drive will fix it.

Right there.

1 Like

Is that enough to suspend the array?
I was seeing some errors a few weeks ago after a scan and scrub, but the array was still working.

If there’s 1 it’s bad to me. You should have 0 errors. I’d be looking into it today and testing/swapping as needed. As soon as my system detects any disk error, I get notification and I am taking action.

1 Like

Looks like a connection issue to me. Reseating the drive sounds to me like a good next step.

Ok, so next steps, power down, re-seat, power up and run a scrub?

I would guess so but I am not an expert.

I would say yes, and maybe swap cable too from one drive to another, so you can see if the issue comes back did it move with the cable swap.

It’s in a chassis with a backplane, so I can’t swap cables, but I could swap which bay the drives are in. Will ZFS freak out?

Should make no difference to zfs, it uses the drive id.

The shutdown is taking a really long time and is showing a lot of errors.
Wonder if I should have tried to clear the errors first to bring the pool back online?