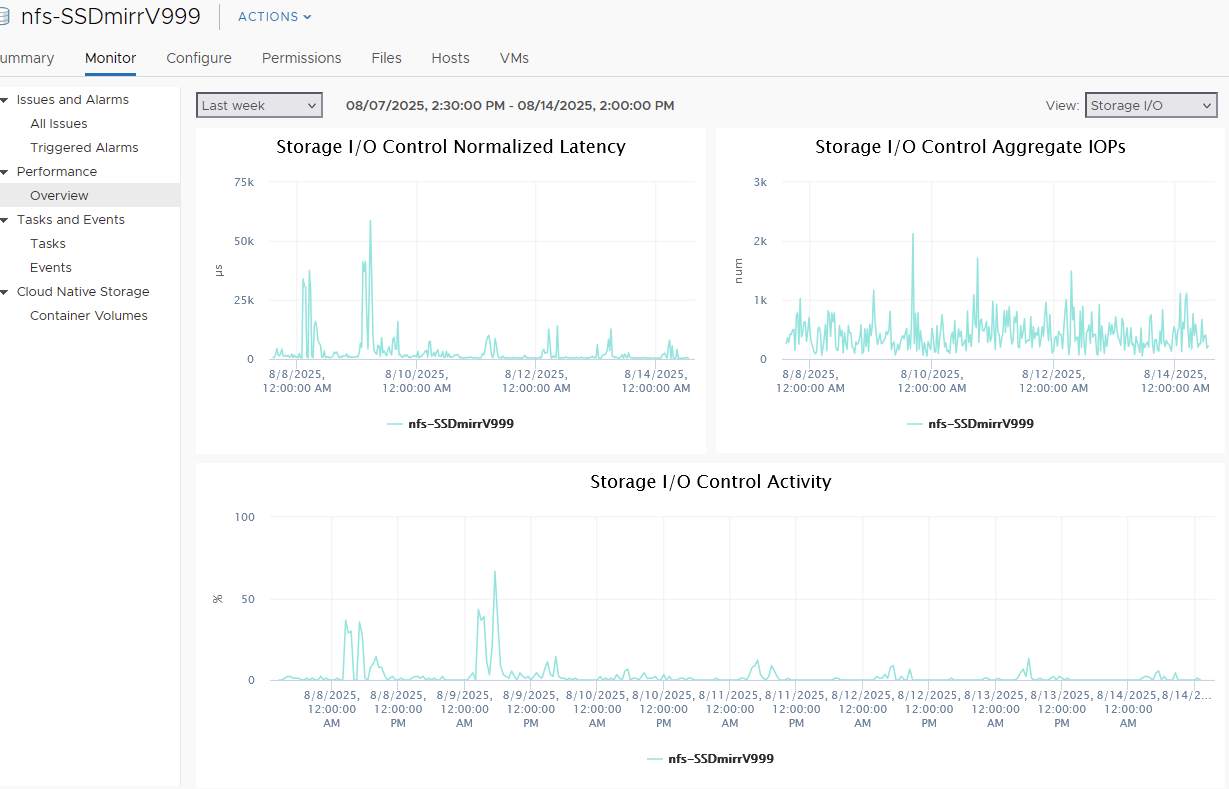
TLDR: please post some of your IOPS usage vs Latency impact graphs , ideally related to vmware → Truenas (or proxmox, or ideally any sync related loads that also measure latency). I’m posting some of mine below. (Honestly I’d appreciate any type of truenas related pool latency graphs/data)
why-
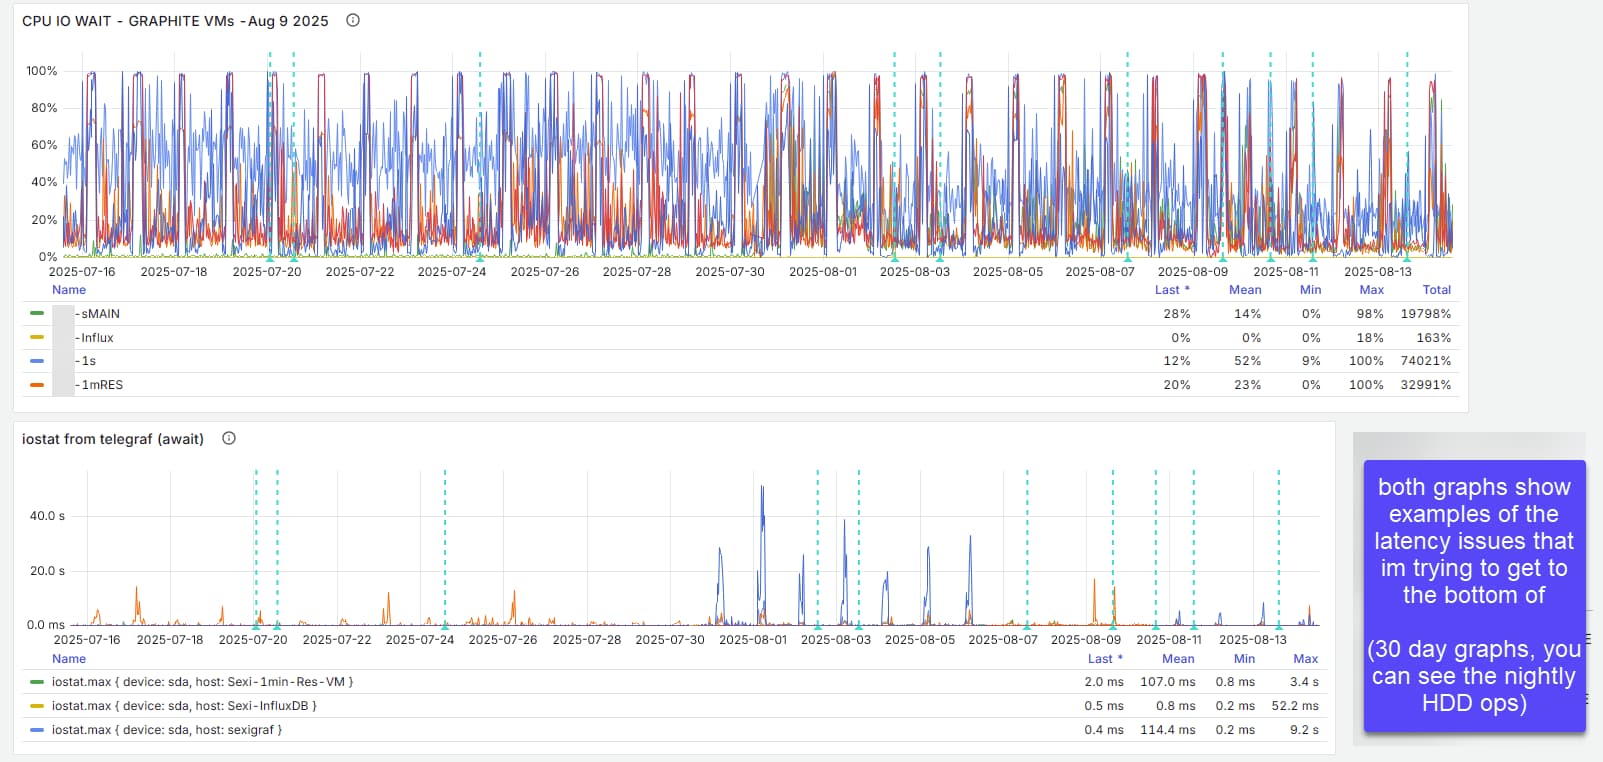
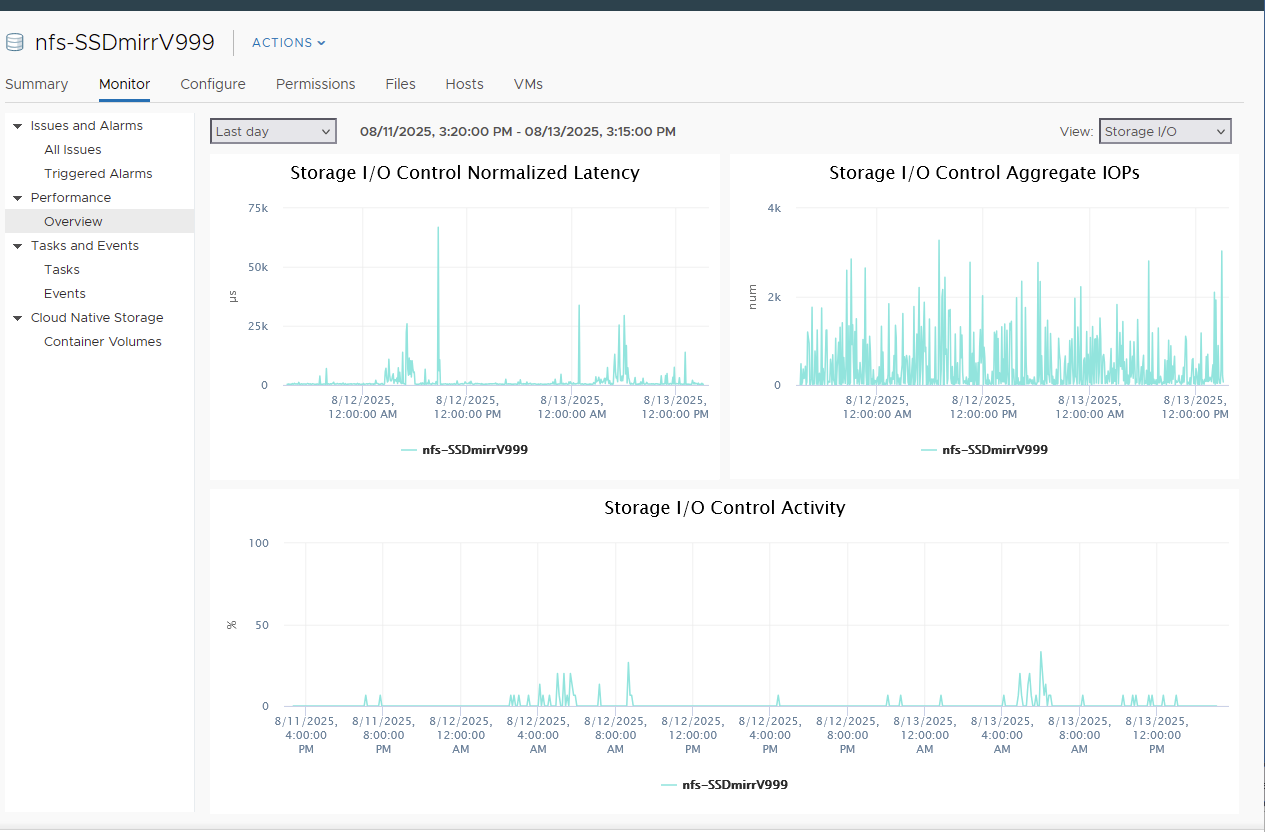
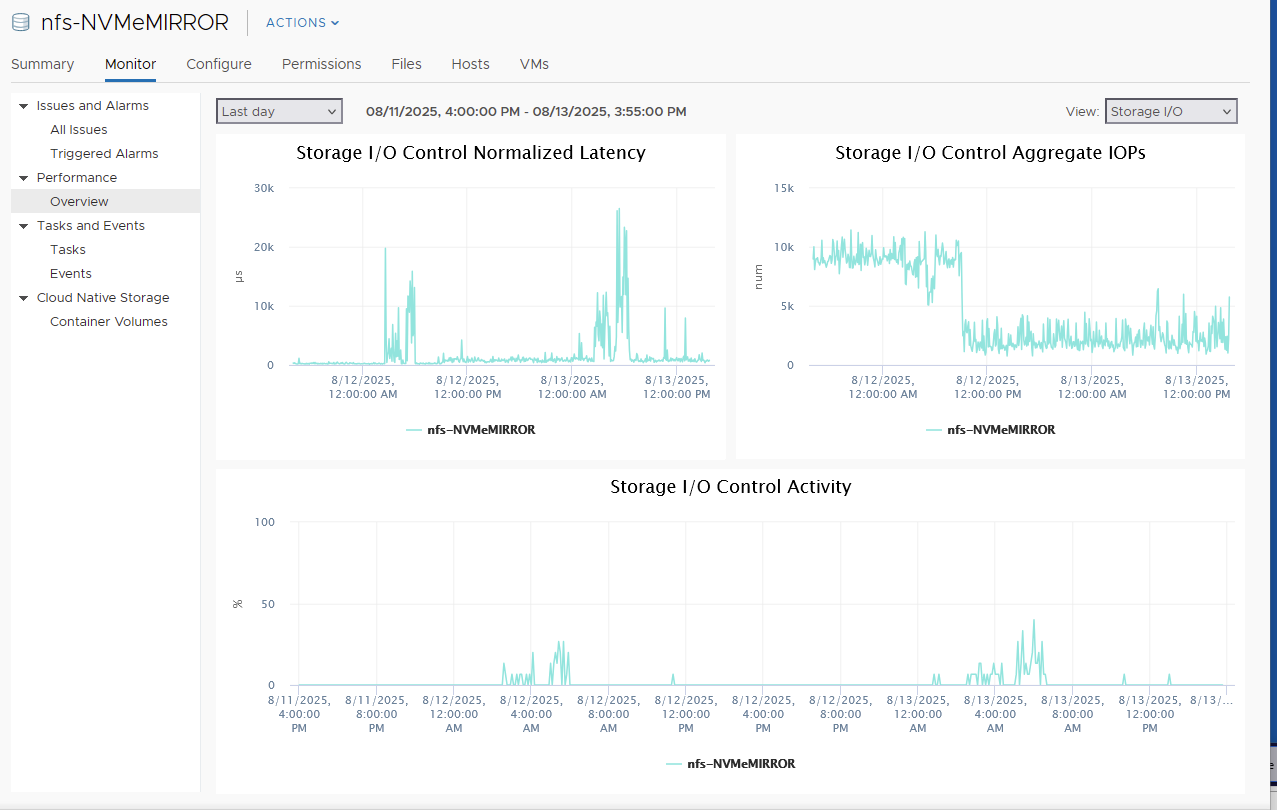
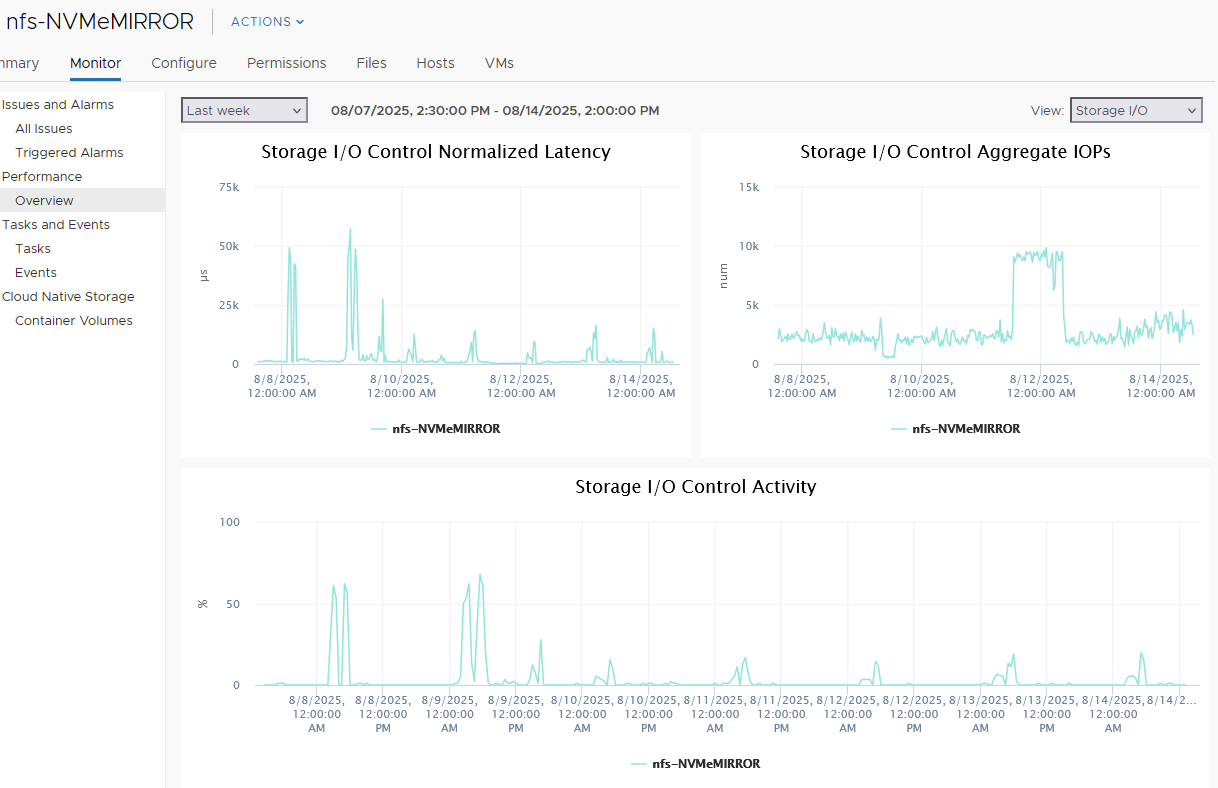
For many years, ive been trying to troubleshoot truenas (or zfs) “cross-pool latency issues” (mostly around NFS) - where if vmware-> TN via NFS datastores is hitting a HDD backed pool (hard), it causes my other pools to latency spike unreasonably high from the standpoint of the VMware hosts. (all are optane p900 slog backed)
for example, every night i have 2x NVR VMs that move about 80GB of video from SSDs to my TN HDD Pool (via nfs VMware disks), The latency spikes have forced me to move some of the VM’s OS boot disks to host direct attached storage as it was causing some services to fail or some OSes to reboot due to IO timeouts.
The 2x VM hosts have 25gb networking, TN (physical) has 100g networking (im aware 10g is more than enough). I do have a decent/high amount of IOPS load from vmware->truenas, So perhaps what I’m seeing is to be expected , I just need some comparisons or points of reference from the community hopefully . Below are my own datapoints, and what im hoping some others will post so i can compare (or im happy to answer any questions on my monitoring system)
I have done a crazy amount of Troubleshooting and testing, and this has been an issue over two entirely different sets of truenas hardware over the years thus:
There is a decent chance that I’m just stressing this SAN system and what I’m seeing is normal /expected with ZFS (and is why Businesses / Enterprises pay so much reoccurring for SANs / something like truenas enterprise )
thank you for your time