I just updated from 24.10.2.2 to 25.04.1 and immediately noticed a constant stream of messages in the console:
May 29 12:20:04 eurybia kernel: dmar_fault: 13029 callbacks suppressed
May 29 12:20:09 eurybia kernel: dmar_fault: 13068 callbacks suppressed
May 29 12:20:14 eurybia kernel: dmar_fault: 13038 callbacks suppressed
Looking at dmesg output gives a little more detail:
[ 3640.688203] dmar_fault: 13206 callbacks suppressed
[ 3640.688213] DMAR: DRHD: handling fault status reg 702
[ 3640.709473] DMAR: [DMA Read NO_PASID] Request device [00:1e.0] fault addr 0x6048000 [fault reason 0x02] Present bit in context entry is clear
[ 3640.732456] DMAR: [DMA Read NO_PASID] Request device [00:1e.0] fault addr 0x6048000 [fault reason 0x02] Present bit in context entry is clear
[ 3640.756838] DMAR: [DMA Read NO_PASID] Request device [00:1e.0] fault addr 0x6048000 [fault reason 0x02] Present bit in context entry is clear
[ 3640.783072] DMAR: [DMA Read NO_PASID] Request device [00:1e.0] fault addr 0x6048000 [fault reason 0x02] Present bit in context entry is clear
[ 3640.810959] DMAR: [DMA Read NO_PASID] Request device [00:1e.0] fault addr 0x6048000 [fault reason 0x02] Present bit in context entry is clear
[ 3640.840416] DMAR: [DMA Read NO_PASID] Request device [00:1e.0] fault addr 0x6048000 [fault reason 0x02] Present bit in context entry is clear
[ 3640.871848] DMAR: [DMA Read NO_PASID] Request device [00:1e.0] fault addr 0x6048000 [fault reason 0x02] Present bit in context entry is clear
[ 3640.905073] DMAR: [DMA Read NO_PASID] Request device [00:1e.0] fault addr 0x6048000 [fault reason 0x02] Present bit in context entry is clear
[ 3640.939412] DMAR: [DMA Read NO_PASID] Request device [00:1e.0] fault addr 0x6048000 [fault reason 0x02] Present bit in context entry is clear
I’m also sometimes seeing a burst of DRHD messages every once in a while:
[ 4301.214471] DMAR: DRHD: handling fault status reg 102
[ 4301.214476] DMAR: [DMA Read NO_PASID] Request device [00:1e.0] fault addr 0x6048000 [fault reason 0x02] Present bit in context entry is clear
[ 4301.215562] DMAR: DRHD: handling fault status reg 202
[ 4301.215571] DMAR: [DMA Read NO_PASID] Request device [00:1e.0] fault addr 0x6048000 [fault reason 0x02] Present bit in context entry is clear
[ 4301.216639] DMAR: DRHD: handling fault status reg 302
[ 4301.216647] DMAR: [DMA Read NO_PASID] Request device [00:1e.0] fault addr 0x6048000 [fault reason 0x02] Present bit in context entry is clear
[ 4301.217716] DMAR: DRHD: handling fault status reg 402
Looking at lspci tells me that device [00:1e.0] is the PCI bridge:
00:1e.0 PCI bridge: Intel Corporation 82801 PCI Bridge (rev 90)
This behaviour is definitely new as of the upgrade today to 25.04.1. The server appears to be running okay The server feels like it’s a bit sluggish, and I can’t edit the properties of any Apps. Clicking the Edit button results in a permanently spinning “Please wait” message, and the sheer volume of errors is concerning
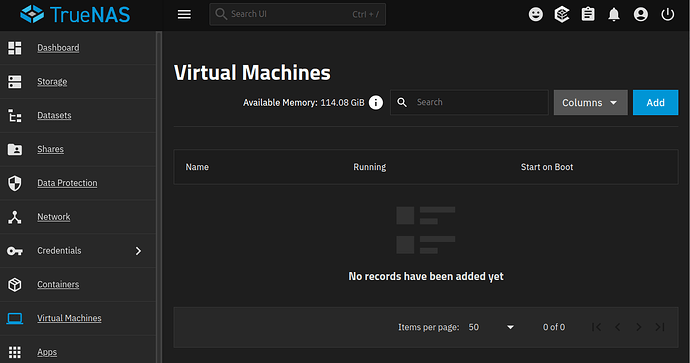
Hardware details are in my sig, but it’s basically an old HP DL380 G6, with the latest available BIOS applied (P62 05/21/2018). There is no GPU installed, and only a Dell Perc H310 controller and an HP SAS expander in the PCI cage. I am running no VMs/Instances
I’m guessing this is something introduced via the new kernel version in this release, and have found a few references online to linux IOMMU support relating to these messages. I suspect the inability to edit Apps is due to it’s trying to poll the status of GPU passthrough? ![]()
I’ve found a few threads suggesting that adding “intel_iommu=off” to the kernel parameters solves this, but I don’t want to try a solution I don’t understand before running it past the forum here.
Any comments/suggestions/dire warnings?
