Sudden slowdows on Scrub speed.
– Before the system has beed rock stable for years and software/firmware changes are freezed.
– Running old: TrueNAS-12.0-U8.1
– This is the first major problem I have seen.
– All drives are 4TB SATA and CRM by spec!
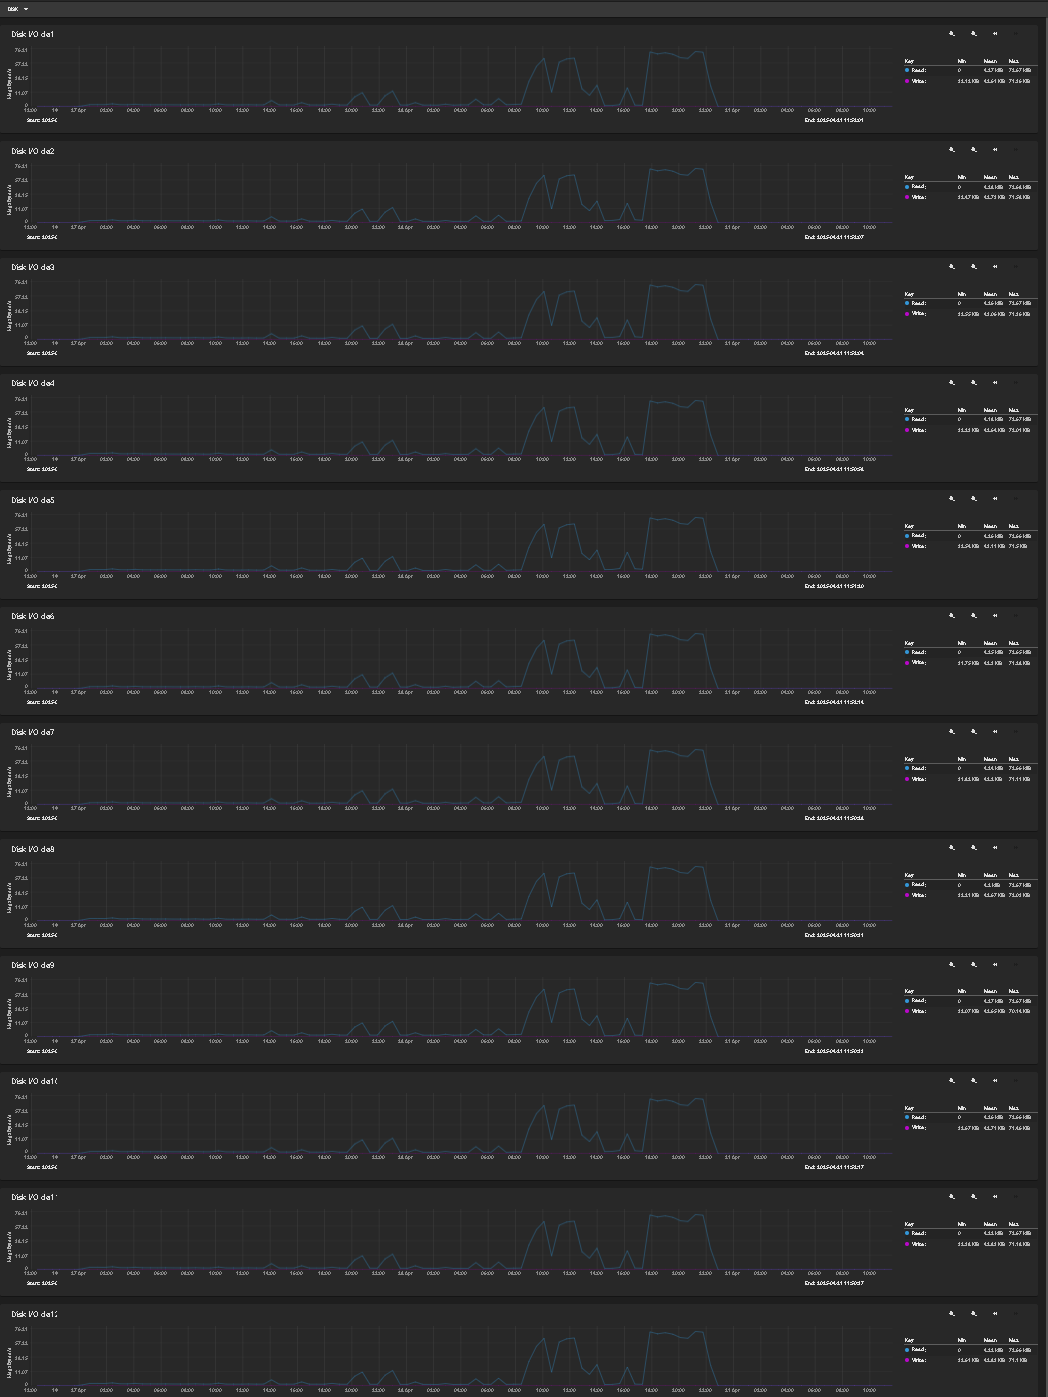
Scrub speed down from 984M/s to 2.26M/s - 4.68M/s
– There are no other load on the disc’s than the Scrub.
Truenas Web interface
SCRUB
Status: SCANNING
Completed: 00.86%
Time Remaining:71 days,22 hours,25 minutes,34 seconds
Errors: 0
Date: 2025-04-27 00:00:01
Only recent change is feb-march 2025 was change of broken disks to new ones.**
The 3 new Red Plus WD40EFPX-68C6CN0) SATA-drives
– They are CRM by spec**
– Resilver was fast and change was succesfully
Noticed that recently errors in “Device-to-host register FISes sent due to a COMRESET”
– Have gone up and big numers only show in WDC drives (Red and Red Plus)
– Only exeption is one da11 WDC Red Plus that does not show big increse, but still 7 for a new disc is stange…
-
da1 = Western Digital Blue, WDC WD40EZRZ-00WN9B0
4 -
da2 = Western Digital Blue, WDC WD40EZRZ-00WN9B0
4 -
da3 = Western Digital Blue, WDC WD40EZRZ-00WN9B0
3 -
da4 = Western Digital Green, WDC WD40EZRX-00SPEB0
4 -
da5 = Seagate Desktop HDD.15 ”almost ironwolf” ST4000DM000-2AE166
4 -
da6 = Western Seagate Desktop HDD.15 ST4000DM000-1F2168
3 -
da7 = Western Digital Red WDC WD40EFRX-68N32N0
129 -
da8 = Western Digital Red WDC WD40EFRX-68N32N0
93 (2025.3.16) → 96 (27.4.2025) -
da9 = Seagate IronWolf ST4000VN008-2DR166
8 -
da10 = Western Digital Red Plus, WDC WD40EFPX-68C6CN0
65 -
da11 = Western Digital Red Plus, WDC WD40EFPX-68C6CN0
7 -
da12 = Western Digital Red Plus, WDC WD40EFPX-68C6CN0
70
Head parking / Idle timers are disabled (exept WDC Red Plus)
- WDC drives “idle3ctl” method used
- Seagate drives “HDAT disable APM” method used
- Info how to disable (needed?) in (WDC Red Plus, WD40EFPX-68C6CN0)?
What could be the problem, ideas how to diagnose the problem?
zpool status
pool: *****
state: ONLINE
  scan: scrub in progress since Sun Apr 27 00:00:01 2025
        240G scanned at 4.68M/s, 225G issued at 4.38M/s, 25.4T total
        0B repaired, 0.86% done, no estimated completion time
config:

        NAME                                            STATE     READ WRITE CKSUM
        *****                                           ONLINE       0     0     0
          raidz2-0                                      ONLINE       0     0     0
            gptid/c70 -> da4				ONLINE       0     0     0
            gptid/c96 -> da3				ONLINE       0     0     0
            gptid/cc1 -> da1 				ONLINE       0     0     0
            gptid/e0a -> da11 				ONLINE       0     0     0
            gptid/d0c -> da2				ONLINE       0     0     0
            gptid/cf7 -> da6  				ONLINE       0     0     0
            gptid/d2a -> da8  				ONLINE       0     0     0
            gptid/d3f -> da5  				ONLINE       0     0     0
            gptid/d5d -> da9				ONLINE       0     0     0
            gptid/e25 -> da12				ONLINE       0     0     0
            gptid/5f2 -> da10  				ONLINE       0     0     0
            gptid/da7d ->da7				ONLINE       0     0     0

errors: No known data errors
uptime: 1:50PM up 39 days, 14:44, 1 user, load averages: 0.72, 0.74, 0.74
zpool iostat -v -l 1
                                                  capacity     operations     bandwidth    total_wait     disk_wait    syncq_wait    asyncq_wait  scrub   trim
pool                                            alloc   free   read  write   read  write   read  write   read  write   read  write   read  write   wait   wait
----------------------------------------------  -----  -----  -----  -----  -----  -----  -----  -----  -----  -----  -----  -----  -----  -----  -----  -----
boot-pool                                       5.93G  25.6G      0      0  11.2K    150   27ms  814us    1ms  159us   18us    6us    2ms  810us   27ms      -
  da0p2                                         5.93G  25.6G      0      0  11.2K    150   27ms  814us    1ms  159us   18us    6us    2ms  810us   27ms      -
----------------------------------------------  -----  -----  -----  -----  -----  -----  -----  -----  -----  -----  -----  -----  -----  -----  -----  -----
*****                                           25.4T  18.2T     52     61  8.37M   524K  880ms  697us   16ms  258us  712us   27us  583us  453us  875ms      -
  raidz2                                        25.4T  18.2T     52     61  8.37M   524K  880ms  697us   16ms  258us  712us   27us  583us  453us  875ms      -
    gptid/c7089767-9e0b-11eb-8c0d-000c2994e4e5      -      -      4      5   711K  43.6K  798ms  599us   17ms  226us  643us   27us  570us  383us  792ms      -
    gptid/c961973e-9e0b-11eb-8c0d-000c2994e4e5      -      -      4      5   715K  43.6K     1s  595us   17ms  227us  656us   27us  537us  378us     1s      -
    gptid/cc1a6f1a-9e0b-11eb-8c0d-000c2994e4e5      -      -      4      5   715K  43.7K     1s  593us   17ms  226us  642us   27us  557us  377us     1s      -
    gptid/e0afbd2f-e436-11ef-80ef-000c2994e4e5      -      -      4      5   714K  43.8K  805ms  810us   15ms  282us  424us   26us  775us  542us  800ms      -
    gptid/d0c2bd83-9e0b-11eb-8c0d-000c2994e4e5      -      -      4      5   717K  43.4K     1s  594us   17ms  223us  722us   27us  538us  379us     1s      -
    gptid/cf718244-9e0b-11eb-8c0d-000c2994e4e5      -      -      4      5   714K  43.6K  940ms  741us   16ms  291us  562us   27us  435us  467us  936ms      -
    gptid/d2a57cec-9e0b-11eb-8c0d-000c2994e4e5      -      -      4      5   713K  43.6K  666ms  630us   15ms  210us  369us   27us  627us  433us  658ms      -
    gptid/d3fd40b4-9e0b-11eb-8c0d-000c2994e4e5      -      -      4      5   715K  43.7K  738ms  719us   15ms  299us  864us   27us  407us  439us  732ms      -
    gptid/d5deb979-9e0b-11eb-8c0d-000c2994e4e5      -      -      4      5   715K  43.8K  874ms  701us   16ms  298us  835us   26us  590us  422us  869ms      -
    gptid/e2524766-f243-11ef-93fd-000c2994e4e5      -      -      4      4   714K  43.8K  901ms  869us   16ms  296us  848us   26us  688us  590us  898ms      -
    gptid/5f29ba93-e321-11ef-925f-000c2994e4e5      -      -      4      4   716K  43.6K  995ms  880us   15ms  304us    1ms   26us  619us  594us  991ms      -
    gptid/da7d8690-9e0b-11eb-8c0d-000c2994e4e5      -      -      4      5   713K  43.5K  696ms  654us   16ms  219us  889us   27us  641us  447us  689ms      -
----------------------------------------------  -----  -----  -----  -----  -----  -----  -----  -----  -----  -----  -----  -----  -----  -----  -----  -----
                                                  capacity     operations     bandwidth    total_wait     disk_wait    syncq_wait    asyncq_wait  scrub   trim
pool                                            alloc   free   read  write   read  write   read  write   read  write   read  write   read  write   wait   wait
----------------------------------------------  -----  -----  -----  -----  -----  -----  -----  -----  -----  -----  -----  -----  -----  -----  -----  -----
boot-pool                                       5.93G  25.6G      0      0      0      0      -      -      -      -      -      -      -      -      -      -
  da0p2                                         5.93G  25.6G      0      0      0      0      -      -      -      -      -      -      -      -      -      -
----------------------------------------------  -----  -----  -----  -----  -----  -----  -----  -----  -----  -----  -----  -----  -----  -----  -----  -----
*****                                          25.4T  18.2T  2.65K      0  18.8M      0  882ms      -   14ms      -      -      -      -      -  867ms      -
  raidz2                                        25.4T  18.2T  2.65K      0  18.8M      0  882ms      -   14ms      -      -      -      -      -  867ms      -
    gptid/c7089767-9e0b-11eb-8c0d-000c2994e4e5      -      -    208      0  1017K      0  459ms      -   15ms      -      -      -      -      -  442ms      -
    gptid/c961973e-9e0b-11eb-8c0d-000c2994e4e5      -      -    221      0  1.05M      0  555ms      -   14ms      -      -      -      -      -  538ms      -
    gptid/cc1a6f1a-9e0b-11eb-8c0d-000c2994e4e5      -      -    229      0  1.88M      0  782ms      -   14ms      -      -      -      -      -  781ms      -
    gptid/e0afbd2f-e436-11ef-80ef-000c2994e4e5      -      -    215      0  1.88M      0  512ms      -   15ms      -      -      -      -      -  494ms      -
    gptid/d0c2bd83-9e0b-11eb-8c0d-000c2994e4e5      -      -    227      0  1013K      0  573ms      -   14ms      -      -      -      -      -  557ms      -
    gptid/cf718244-9e0b-11eb-8c0d-000c2994e4e5      -      -    214      0  1.74M      0  824ms      -   15ms      -      -      -      -      -  822ms      -
    gptid/d2a57cec-9e0b-11eb-8c0d-000c2994e4e5      -      -    170      0  1.70M      0     2s      -   19ms      -      -      -      -      -     2s      -
    gptid/d3fd40b4-9e0b-11eb-8c0d-000c2994e4e5      -      -    215      0  1.36M      0     1s      -   15ms      -      -      -      -      -     1s      -
    gptid/d5deb979-9e0b-11eb-8c0d-000c2994e4e5      -      -    243      0  1.38M      0  664ms      -   13ms      -      -      -      -      -  639ms      -
    gptid/e2524766-f243-11ef-93fd-000c2994e4e5      -      -    264      0  2.22M      0     1s      -   12ms      -      -      -      -      -     1s      -
    gptid/5f29ba93-e321-11ef-925f-000c2994e4e5      -      -    254      0  1.46M      0  726ms      -   13ms      -      -      -      -      -  715ms      -
    gptid/da7d8690-9e0b-11eb-8c0d-000c2994e4e5      -      -    243      0  2.05M      0  789ms      -   13ms      -      -      -      -      -  789ms      -
----------------------------------------------  -----  -----  -----  -----  -----  -----  -----  -----  -----  -----  -----  -----  -----  -----  -----  -----
                                                  capacity     operations     bandwidth    total_wait     disk_wait    syncq_wait    asyncq_wait  scrub   trim
pool                                            alloc   free   read  write   read  write   read  write   read  write   read  write   read  write   wait   wait
----------------------------------------------  -----  -----  -----  -----  -----  -----  -----  -----  -----  -----  -----  -----  -----  -----  -----  -----
boot-pool                                       5.93G  25.6G      0      0      0      0      -      -      -      -      -      -      -      -      -      -
  da0p2                                         5.93G  25.6G      0      0      0      0      -      -      -      -      -      -      -      -      -      -
----------------------------------------------  -----  -----  -----  -----  -----  -----  -----  -----  -----  -----  -----  -----  -----  -----  -----  -----
*****                                           25.4T  18.2T  2.14K      0  29.3M      0     2s      -   17ms      -      -      -      -      -     2s      -
  raidz2                                        25.4T  18.2T  2.14K      0  29.3M      0     2s      -   17ms      -      -      -      -      -     2s      -
    gptid/c7089767-9e0b-11eb-8c0d-000c2994e4e5      -      -    162      0  1.74M      0     3s      -   20ms      -      -      -      -      -     3s      -
    gptid/c961973e-9e0b-11eb-8c0d-000c2994e4e5      -      -    169      0  2.28M      0     3s      -   19ms      -      -      -      -      -     3s      -
    gptid/cc1a6f1a-9e0b-11eb-8c0d-000c2994e4e5      -      -    173      0  2.52M      0     2s      -   19ms      -      -      -      -      -     2s      -
    gptid/e0afbd2f-e436-11ef-80ef-000c2994e4e5      -      -    145      0  1.77M      0     4s      -   21ms      -      -      -      -      -     4s      -
    gptid/d0c2bd83-9e0b-11eb-8c0d-000c2994e4e5      -      -    164      0  3.34M      0     3s      -   19ms      -      -      -      -      -     3s      -
    gptid/cf718244-9e0b-11eb-8c0d-000c2994e4e5      -      -    191      0  4.09M      0     1s      -   17ms      -      -      -      -      -     1s      -
    gptid/d2a57cec-9e0b-11eb-8c0d-000c2994e4e5      -      -    225      0  1.06M      0     1s      -   13ms      -      -      -      -      -     1s      -
    gptid/d3fd40b4-9e0b-11eb-8c0d-000c2994e4e5      -      -    244      0  1.11M      0     1s      -   13ms      -      -      -      -      -     1s      -
    gptid/d5deb979-9e0b-11eb-8c0d-000c2994e4e5      -      -    184      0  3.30M      0     4s      -   17ms      -      -      -      -      -     4s      -
    gptid/e2524766-f243-11ef-93fd-000c2994e4e5      -      -    178      0  2.15M      0     1s      -   18ms      -      -      -      -      -     1s      -
    gptid/5f29ba93-e321-11ef-925f-000c2994e4e5      -      -    167      0  3.48M      0     3s      -   19ms      -      -      -      -      -     3s      -
    gptid/da7d8690-9e0b-11eb-8c0d-000c2994e4e5      -      -    186      0  2.44M      0     1s      -   17ms      -      -      -      -      -     1s      -
----------------------------------------------  -----  -----  -----  -----  -----  -----  -----  -----  -----  -----  -----  -----  -----  -----  -----  -----
./badblocks4
da1
  5 Reallocated_Sector_Ct   0x0033   200   200   140    Pre-fail  Always       -       0
196 Reallocated_Event_Count 0x0032   200   200   000    Old_age   Always       -       0
Sector Sizes:     512 bytes logical, 4096 bytes physical
  5 Reallocated_Sector_Ct   0x0033   200   200   140    Pre-fail  Always       -       0
197 Current_Pending_Sector  0x0032   200   200   000    Old_age   Always       -       0
198 Offline_Uncorrectable   0x0030   200   200   000    Old_age   Offline      -       0
No Errors Logged
da2
  5 Reallocated_Sector_Ct   0x0033   200   200   140    Pre-fail  Always       -       0
196 Reallocated_Event_Count 0x0032   200   200   000    Old_age   Always       -       0
Sector Sizes:     512 bytes logical, 4096 bytes physical
  5 Reallocated_Sector_Ct   0x0033   200   200   140    Pre-fail  Always       -       0
197 Current_Pending_Sector  0x0032   200   200   000    Old_age   Always       -       0
198 Offline_Uncorrectable   0x0030   200   200   000    Old_age   Offline      -       0
No Errors Logged
da3
  5 Reallocated_Sector_Ct   0x0033   200   200   140    Pre-fail  Always       -       0
196 Reallocated_Event_Count 0x0032   200   200   000    Old_age   Always       -       0
Sector Sizes:     512 bytes logical, 4096 bytes physical
  5 Reallocated_Sector_Ct   0x0033   200   200   140    Pre-fail  Always       -       0
197 Current_Pending_Sector  0x0032   200   200   000    Old_age   Always       -       0
198 Offline_Uncorrectable   0x0030   200   200   000    Old_age   Offline      -       0
No Errors Logged
da4
  5 Reallocated_Sector_Ct   0x0033   200   200   140    Pre-fail  Always       -       0
196 Reallocated_Event_Count 0x0032   200   200   000    Old_age   Always       -       0
Sector Sizes:     512 bytes logical, 4096 bytes physical
  5 Reallocated_Sector_Ct   0x0033   200   200   140    Pre-fail  Always       -       0
197 Current_Pending_Sector  0x0032   200   200   000    Old_age   Always       -       0
198 Offline_Uncorrectable   0x0030   200   200   000    Old_age   Offline      -       0
No Errors Logged
da5
  5 Reallocated_Sector_Ct   0x0033   100   100   010    Pre-fail  Always       -       0
Sector Sizes:     512 bytes logical, 4096 bytes physical
  5 Reallocated_Sector_Ct   0x0033   100   100   010    Pre-fail  Always       -       0
197 Current_Pending_Sector  0x0012   100   100   000    Old_age   Always       -       0
198 Offline_Uncorrectable   0x0010   100   100   000    Old_age   Offline      -       0
No Errors Logged
0x04  =====  =               =  ===  == General Errors Statistics (rev 1) ==
0x04  0x008  4               0  ---  Number of Reported Uncorrectable Errors
0x06  0x018  4               2  ---  Number of Interface CRC Errors
0x03  0x030  4               0  ---  Number of Mechanical Start Failures
da6
  5 Reallocated_Sector_Ct   0x0033   100   100   010    Pre-fail  Always       -       0
Sector Sizes:     512 bytes logical, 4096 bytes physical
  5 Reallocated_Sector_Ct   0x0033   100   100   010    Pre-fail  Always       -       0
197 Current_Pending_Sector  0x0012   100   100   000    Old_age   Always       -       0
198 Offline_Uncorrectable   0x0010   100   100   000    Old_age   Offline      -       0
No Errors Logged
0x04  =====  =               =  ===  == General Errors Statistics (rev 1) ==
0x04  0x008  4               0  ---  Number of Reported Uncorrectable Errors
0x03  0x030  4               0  ---  Number of Mechanical Start Failures
da7
  5 Reallocated_Sector_Ct   0x0033   200   200   140    Pre-fail  Always       -       0
196 Reallocated_Event_Count 0x0032   200   200   000    Old_age   Always       -       0
Sector Sizes:     512 bytes logical, 4096 bytes physical
  5 Reallocated_Sector_Ct   0x0033   200   200   140    Pre-fail  Always       -       0
197 Current_Pending_Sector  0x0032   200   200   000    Old_age   Always       -       0
198 Offline_Uncorrectable   0x0030   100   253   000    Old_age   Offline      -       0
No Errors Logged
0x04  =====  =               =  ===  == General Errors Statistics (rev 1) ==
0x04  0x008  4               0  ---  Number of Reported Uncorrectable Errors
0x06  0x018  4               0  ---  Number of Interface CRC Errors
0x03  0x030  4               0  ---  Number of Mechanical Start Failures
da8
  5 Reallocated_Sector_Ct   0x0033   200   200   140    Pre-fail  Always       -       0
196 Reallocated_Event_Count 0x0032   200   200   000    Old_age   Always       -       0
Sector Sizes:     512 bytes logical, 4096 bytes physical
  5 Reallocated_Sector_Ct   0x0033   200   200   140    Pre-fail  Always       -       0
197 Current_Pending_Sector  0x0032   200   200   000    Old_age   Always       -       0
198 Offline_Uncorrectable   0x0030   100   253   000    Old_age   Offline      -       0
0x04  =====  =               =  ===  == General Errors Statistics (rev 1) ==
0x04  0x008  4             691  ---  Number of Reported Uncorrectable Errors
0x06  0x018  4               0  ---  Number of Interface CRC Errors
0x03  0x030  4               0  ---  Number of Mechanical Start Failures
da9
  5 Reallocated_Sector_Ct   0x0033   100   100   010    Pre-fail  Always       -       0
Sector Sizes:     512 bytes logical, 4096 bytes physical
  5 Reallocated_Sector_Ct   0x0033   100   100   010    Pre-fail  Always       -       0
197 Current_Pending_Sector  0x0012   100   100   000    Old_age   Always       -       0
198 Offline_Uncorrectable   0x0010   100   100   000    Old_age   Offline      -       0
No Errors Logged
0x04  =====  =               =  ===  == General Errors Statistics (rev 1) ==
0x04  0x008  4               0  ---  Number of Reported Uncorrectable Errors
0x06  0x018  4             364  ---  Number of Interface CRC Errors
0x03  0x030  4               0  ---  Number of Mechanical Start Failures
da10
  5 Reallocated_Sector_Ct   0x0033   200   200   140    Pre-fail  Always       -       0
196 Reallocated_Event_Count 0x0032   200   200   000    Old_age   Always       -       0
Sector Sizes:     512 bytes logical, 4096 bytes physical
  5 Reallocated_Sector_Ct   0x0033   200   200   140    Pre-fail  Always       -       0
197 Current_Pending_Sector  0x0032   200   200   000    Old_age   Always       -       0
198 Offline_Uncorrectable   0x0030   100   253   000    Old_age   Offline      -       0
No Errors Logged
0x04  =====  =               =  ===  == General Errors Statistics (rev 1) ==
0x04  0x008  4               0  ---  Number of Reported Uncorrectable Errors
0x06  0x018  4               0  ---  Number of Interface CRC Errors
0x03  0x030  4               0  ---  Number of Mechanical Start Failures
da11
  5 Reallocated_Sector_Ct   0x0033   200   200   140    Pre-fail  Always       -       0
196 Reallocated_Event_Count 0x0032   200   200   000    Old_age   Always       -       0
Sector Sizes:     512 bytes logical, 4096 bytes physical
  5 Reallocated_Sector_Ct   0x0033   200   200   140    Pre-fail  Always       -       0
197 Current_Pending_Sector  0x0032   200   200   000    Old_age   Always       -       0
198 Offline_Uncorrectable   0x0030   100   253   000    Old_age   Offline      -       0
No Errors Logged
0x04  =====  =               =  ===  == General Errors Statistics (rev 1) ==
0x04  0x008  4               0  ---  Number of Reported Uncorrectable Errors
0x06  0x018  4               0  ---  Number of Interface CRC Errors
0x03  0x030  4               0  ---  Number of Mechanical Start Failures
da12
  5 Reallocated_Sector_Ct   0x0033   200   200   140    Pre-fail  Always       -       0
196 Reallocated_Event_Count 0x0032   200   200   000    Old_age   Always       -       0
Sector Sizes:     512 bytes logical, 4096 bytes physical
  5 Reallocated_Sector_Ct   0x0033   200   200   140    Pre-fail  Always       -       0
197 Current_Pending_Sector  0x0032   200   200   000    Old_age   Always       -       0
198 Offline_Uncorrectable   0x0030   100   253   000    Old_age   Offline      -       0
No Errors Logged
0x04  =====  =               =  ===  == General Errors Statistics (rev 1) ==
0x04  0x008  4               0  ---  Number of Reported Uncorrectable Errors
0x06  0x018  4               0  ---  Number of Interface CRC Errors
0x03  0x030  4               0  ---  Number of Mechanical Start Failures
No Bad Blocks detected
Known issues:
-
da9 = Seagate IronWolf, ST4000VN008-2DR166
– Gets stedy increase in “UDMA_CRC_Error_Count” considered: Normal for this system… -
da8 = Western Digital Red, WDC WD40EFRX-68N32N0
– 691 — Number of Reported Uncorrectable Errors
– Drive had “1 Uncorrectable error” in the past 2025.2.26 and had “drive regeneration” and tested to be ok.
–No erors since. If this latest scrub slowdown ising one…
Only to grow after the fix/tests are:
Number of Hardware Resets: 15133 → 15338 UP 205
Number of ASR Events: 317 → 322 UP 5
Number of High Priority Unload Events: 111 → 113 UP 2
Hardware specs:
– Running as a VM on ESXi
- SAS9201-16i (LSI2116) is passtrue to the vm
– 12* 4TB SATA drives in Raidz2 and encryption is used, but no dedup. - 16GB vRam
- 2 vCPUs
mpsutil show all
Adapter: mps0 Adapter:
       Board Name: SAS9201-16i
   Board Assembly:
        Chip Name: LSISAS2116
    Chip Revision: ALL
    BIOS Revision: 7.37.00.00
Firmware Revision: 19.00.00.00
  Integrated RAID: no
         SATA NCQ: ENABLED
 PCIe Width/Speed: x8 (5.0 GB/sec)
        IOC Speed: Full
      Temperature: Unknown/Unsupported

PhyNum  CtlrHandle  DevHandle  Disabled  Speed   Min    Max    Device
0       0001        0011       N         6.0     1.5    6.0    SAS Initiator
1       0002        0012       N         6.0     1.5    6.0    SAS Initiator
2       0003        0013       N         6.0     1.5    6.0    SAS Initiator
3       0005        0015       N         6.0     1.5    6.0    SAS Initiator
4       0004        0014       N         6.0     1.5    6.0    SAS Initiator
5       0006        0016       N         6.0     1.5    6.0    SAS Initiator
6       0008        0018       N         6.0     1.5    6.0    SAS Initiator
7       0007        0017       N         6.0     1.5    6.0    SAS Initiator
8       000a        001a       N         6.0     1.5    6.0    SAS Initiator
9       0009        0019       N         6.0     1.5    6.0    SAS Initiator
10      000c        001c       N         6.0     1.5    6.0    SAS Initiator
11      000b        001b       N         6.0     1.5    6.0    SAS Initiator
12                             N                 1.5    6.0    SAS Initiator
13                             N                 1.5    6.0    SAS Initiator
14                             N                 1.5    6.0    SAS Initiator
15                             N                 1.5    6.0    SAS Initiator

Devices:
B____T    SAS Address      Handle  Parent    Device        Speed Enc  Slot  Wdt
00   36   4433221100000000 0011    0001      SATA Target   6.0   0001 03    1
00   33   4433221101000000 0012    0002      SATA Target   6.0   0001 02    1
00   55   4433221102000000 0013    0003      SATA Target   6.0   0001 01    1
00   35   4433221104000000 0014    0004      SATA Target   6.0   0001 07    1
00   41   4433221103000000 0015    0005      SATA Target   6.0   0001 00    1
00   30   4433221105000000 0016    0006      SATA Target   6.0   0001 06    1
00   40   4433221107000000 0017    0007      SATA Target   6.0   0001 04    1
00   62   4433221106000000 0018    0008      SATA Target   6.0   0001 05    1
00   31   4433221109000000 0019    0009      SATA Target   6.0   0001 10    1
00   60   4433221108000000 001a    000a      SATA Target   6.0   0001 11    1
00   34   443322110b000000 001b    000b      SATA Target   6.0   0001 08    1
00   64   443322110a000000 001c    000c      SATA Target   6.0   0001 09    1

Enclosures:
Slots      Logical ID     SEPHandle  EncHandle    Type
  16    500605b002c8c141               0001     Direct Attached SGPIO

Expanders:
NumPhys   SAS Address     DevHandle   Parent  EncHandle  SAS Level
sas2flash -list
LSI Corporation SAS2 Flash Utility
Version 16.00.00.00 (2013.03.01)
Copyright (c) 2008-2013 LSI Corporation. All rights reserved

        Adapter Selected is a LSI SAS: SAS2116_1(B1)

        Controller Number              : 0
        Controller                     : SAS2116_1(B1)
        PCI Address                    : 00:03:00:00
        SAS Address                    : 500605b-0-02c8-c141
        NVDATA Version (Default)       : 11.00.00.06
        NVDATA Version (Persistent)    : 11.00.00.06
        Firmware Product ID            : 0x2213 (IT)
        Firmware Version               : 19.00.00.00
        NVDATA Vendor                  : LSI
        NVDATA Product ID              : SAS9201-16i
        BIOS Version                   : 07.37.00.00
        UEFI BSD Version               : N/A
        FCODE Version                  : N/A
        Board Name                     : SAS9201-16i
        Board Assembly                 : N/A
        Board Tracer Number            : N/A
dmesg:
mps0: Controller reported scsi ioc terminated tgt 55 SMID 1938 loginfo 31120303
(da9:mps0:0:55:0): WRITE(10). CDB: 2a 00 be 1b 60 98 00 00 18 00
(da9:mps0:0:55:0): CAM status: CCB request completed with an error
(da9:mps0:0:55:0): Retrying command, 3 more tries remain
(da9:mps0:0:55:0): WRITE(10). CDB: 2a 00 be 1b 60 98 00 00 18 00
(da9:mps0:0:55:0): CAM status: SCSI Status Error
(da9:mps0:0:55:0): SCSI status: Check Condition
(da9:mps0:0:55:0): SCSI sense: UNIT ATTENTION asc:29,0 (Power on, reset, or bus device reset occurred)
(da9:mps0:0:55:0): Retrying command (per sense data)
(da9:mps0:0:55:0): WRITE(10). CDB: 2a 00 be 00 20 80 00 00 10 00
(da9:mps0:0:55:0): CAM status: SCSI Status Error
(da9:mps0:0:55:0): SCSI status: Check Condition
(da9:mps0:0:55:0): SCSI sense: UNIT ATTENTION asc:29,0 (Power on, reset, or bus device reset occurred)
(da9:mps0:0:55:0): Retrying command (per sense data)
mps0: Controller reported scsi ioc terminated tgt 55 SMID 1497 loginfo 31120303
(da9:mps0:0:55:0): WRITE(10). CDB: 2a 00 be 9e da 58 00 00 18 00
(da9:mps0:0:55:0): CAM status: CCB request completed with an error
(da9:mps0:0:55:0): Retrying command, 3 more tries remain
(da9:mps0:0:55:0): WRITE(10). CDB: 2a 00 be 9e da 58 00 00 18 00
(da9:mps0:0:55:0): CAM status: SCSI Status Error
(da9:mps0:0:55:0): SCSI status: Check Condition
(da9:mps0:0:55:0): SCSI sense: UNIT ATTENTION asc:29,0 (Power on, reset, or bus device reset occurred)
(da9:mps0:0:55:0): Retrying command (per sense data)
(da9:mps0:0:55:0): WRITE(10). CDB: 2a 00 b9 dd 5b a8 00 00 10 00
(da9:mps0:0:55:0): CAM status: SCSI Status Error
(da9:mps0:0:55:0): SCSI status: Check Condition
(da9:mps0:0:55:0): SCSI sense: UNIT ATTENTION asc:29,0 (Power on, reset, or bus device reset occurred)
(da9:mps0:0:55:0): Retrying command (per sense data)
mps0: Controller reported scsi ioc terminated tgt 55 SMID 1097 loginfo 31120303
(da9:mps0:0:55:0): WRITE(10). CDB: 2a 00 bf 78 ec 18 00 00 18 00
(da9:mps0:0:55:0): CAM status: CCB request completed with an error
(da9:mps0:0:55:0): Retrying command, 3 more tries remain
(da9:mps0:0:55:0): READ(10). CDB: 28 00 be d5 91 c0 00 00 10 00
(da9:mps0:0:55:0): CAM status: SCSI Status Error
(da9:mps0:0:55:0): SCSI status: Check Condition
(da9:mps0:0:55:0): SCSI sense: UNIT ATTENTION asc:29,0 (Power on, reset, or bus device reset occurred)
(da9:mps0:0:55:0): Retrying command (per sense data)
(da9:mps0:0:55:0): WRITE(10). CDB: 2a 00 bf 63 f2 e0 00 00 08 00
(da9:mps0:0:55:0): CAM status: SCSI Status Error
(da9:mps0:0:55:0): SCSI status: Check Condition
(da9:mps0:0:55:0): SCSI sense: UNIT ATTENTION asc:29,0 (Power on, reset, or bus device reset occurred)
(da9:mps0:0:55:0): Retrying command (per sense data)
mps0: Controller reported scsi ioc terminated tgt 55 SMID 1765 loginfo 31120303
(da9:mps0:0:55:0): WRITE(10). CDB: 2a 00 c5 ee 26 30 00 00 20 00
(da9:mps0:0:55:0): CAM status: CCB request completed with an error
(da9:mps0:0:55:0): Retrying command, 3 more tries remain
(da9:mps0:0:55:0): WRITE(10). CDB: 2a 00 c5 ee 26 30 00 00 20 00
(da9:mps0:0:55:0): CAM status: SCSI Status Error
(da9:mps0:0:55:0): SCSI status: Check Condition
(da9:mps0:0:55:0): SCSI sense: UNIT ATTENTION asc:29,0 (Power on, reset, or bus device reset occurred)
(da9:mps0:0:55:0): Retrying command (per sense data)
(da9:mps0:0:55:0): WRITE(10). CDB: 2a 00 c5 55 76 f0 00 00 10 00
(da9:mps0:0:55:0): CAM status: SCSI Status Error
(da9:mps0:0:55:0): SCSI status: Check Condition
(da9:mps0:0:55:0): SCSI sense: UNIT ATTENTION asc:29,0 (Power on, reset, or bus device reset occurred)
(da9:mps0:0:55:0): Retrying command (per sense data)
These type of dmesg errors are common for the server.
– I dont know why but only the disk connected to:
- SAS9201-16i = Slot 1 (Slots 0-11) → (Controllers Fysical= A port (Ports A-D)) → 8087 SATA cable: SATA-Port= 2 (1-4) → Hot Swap Bay = 2 (Bay’s 1-12) → Currently assingned to da9
- Gets stedy increase in “UDMA_CRC_Error_Count”, but it has not cause any other issues than shown up in dmesg / smart log.
– Tryed change cable (Helped a litle, I too long time to get new errors, but errors arrived over time)
– Because it takes long time to get errors, Its possible I did not catch the first ones, or old version of TrueNAS did not cause them.
– Changed a disk. the errors followed the new disc.
– Changed Hot swap sled, no help
– Disks have always passes checks etc
– This has been seen just a annoying problem for years, but not have seen causing any “real world issues” and I dont think is a direct cause of this scrub problem currently.
– Still I Wonder is this firmware, card or bay problem…?
→ Have you experienced similar problem of stedy crowing “UDMA_CRC_Error_Count”
→ Any ideas?
What is the current recomended firmware for this card for TrueNAS-12.0-U8.1 and/or later version? Could firmware upgrade sold some of the issues?
Update noticed errors in ESXi dmesg log
ESXi dmesg errors related to Truenas VM
2025-04-16T18:08:13.639Z cpu5:67819)VSCSIFs: 3908: handle 8192(vscsi0:0):Invalid Opcode (0x4d) from (vmm0:TrueNas_Core)
2025-04-22T13:03:13.605Z cpu2:67815)VSCSIFs: 3908: handle 8192(vscsi0:0):Invalid Opcode (0x4d) from (vmm0:TrueNas_Core)

ESXi dmesg errors that keep popping up every 10minutes...
2025-04-13T04:06:07.216Z cpu10:66122)DVFilter: 6027: Checking disconnected filters for timeouts
2025-04-13T04:16:07.231Z cpu6:66122)DVFilter: 6027: Checking disconnected filters for timeouts
2025-04-13T04:26:07.246Z cpu8:66122)DVFilter: 6027: Checking disconnected filters for timeouts
...
When the scrub started
2025-04-26T23:36:36.883Z cpu10:66122)DVFilter: 6027: Checking disconnected filters for timeouts
2025-04-26T23:46:36.898Z cpu10:66122)DVFilter: 6027: Checking disconnected filters for timeouts
2025-04-26T23:56:36.912Z cpu8:66122)DVFilter: 6027: Checking disconnected filters for timeouts
2025-04-27T00:06:36.927Z cpu8:66122)DVFilter: 6027: Checking disconnected filters for timeouts
2025-04-27T00:16:36.942Z cpu8:66122)DVFilter: 6027: Checking disconnected filters for timeouts
2025-04-27T00:26:36.957Z cpu6:66122)DVFilter: 6027: Checking disconnected filters for timeouts
...
2025-04-27T12:26:38.033Z cpu8:66122)DVFilter: 6027: Checking disconnected filters for timeouts
2025-04-27T12:36:38.048Z cpu7:66122)DVFilter: 6027: Checking disconnected filters for timeouts
2025-04-27T12:46:38.063Z cpu9:66122)DVFilter: 6027: Checking disconnected filters for timeouts
...
2025-04-27T17:36:38.495Z cpu4:66122)DVFilter: 6027: Checking disconnected filters for timeouts
2025-04-27T17:46:38.510Z cpu5:66122)DVFilter: 6027: Checking disconnected filters for timeouts
2025-04-27T17:56:38.525Z cpu3:66122)DVFilter: 6027: Checking disconnected filters for timeouts
At 2025-04-27T17:56:38.525 came latest DVFilter: 6027 error (at least no more since 3 housrs have passed)
Hmm…