Would installing an upgrade offline via usb and the latest iso correct this or am I inviting more potential risk by not resolving it first?
Netdata spam issue is already fixed in 24.04.2 IIRC.
1 Like
Thanks for confirming! Any way to fix it so it boots from the cli?
I honestly don’t see a way that the netdata log spam could cause middleware start to timeout.
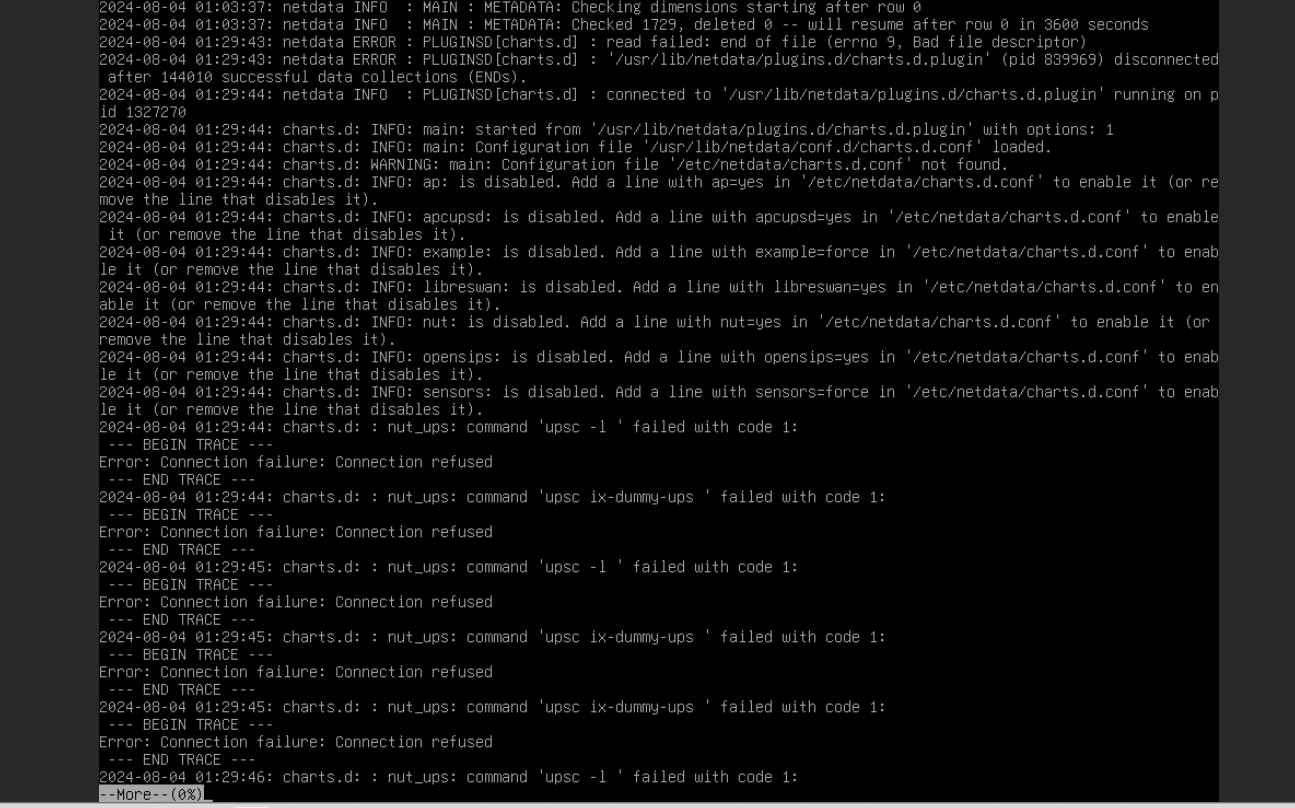
yeah weird. The Netdata service wont load which is probably needed for the plugin (audit) in the middlewared. So thats probably why it wont load and fails during plug 110 (audit) out of 111.
FYI to those affected by this. We’re changing the defaults for the audit page in Electric Eel to not display SMB audit entries. These will still be visible via the services form or by performing an advanced query. The main audit form will show administrative actions (configuration changes made via API / UI and commands that users run with sudo access).
This should make the form somewhat more intuitive and improve performance significantly.
Inquiring minds want to know: Can I have details about each log levels? (Minimum, Normal, Full, and Debug) I want to know what kind of events each of them catch.
Well, if you’re in doubt you can always ask an engineer or support team member. ![]()
Log levels for samba:
- MINIMUM - what you should use unless you are trying to debug a problem
- everything else - what you should not use unless you are debugging a problem.
These are debug logs, they’re not audit logs. TL;DR, unless you’re a developer - no touchy.
2 Likes
I too am impacted by this when the client-side is Proxmox. While there is a workaround, the reality is there should be a way to completely disable successful authentication logging; my experience has been that having a log of successful logins provides no value for nearly every use case. No matter where I try disabling it or them being hidden in the UI, the messages spam constantly and are visible if following journalctl:
Feb 12 02:53:38 jupiter TNAUDIT_SMB[257136]: @cee:{“TNAUDIT”: {“aid”: “6bf2a9b1-ad56-40ca-bd20-393c1259c805”, “vers”: {“major”: 0, “minor”: 1}, “addr”: “192.168.86.22”, “user”: “prox”, “sess”: null, “time”: “2025-02-12 08:53:38.136068Z”, “svc”: “SMB”, “svc_data”: “{"vers": {"major": 0, "minor": 1}, "service": null, "session_id": null, "tcon_id": null}”, “event”: “AUTHENTICATION”, “event_data”: “{"logonId": "0", "logonType": 3, "localAddress": "ipv4:192.168.86.54:445", "remoteAddress": "ipv4:192.168.86.22:37102", "serviceDescription": "SMB2", "authDescription": null, "clientDomain": "WORKGROUP", "clientAccount": "prox", "workstation": "PROX2", "becameAccount": "prox", "becameDomain": "TRUENAS", "becameSid": "S-1-5-21-2440438680-2492962824-1104764361-20075", "mappedAccount": "prox", "mappedDomain": "WORKGROUP", "netlogonComputer": null, "netlogonTrustAccount": null, "netlogonNegotiateFlags": "0x00000000", "netlogonSecureChannelType": 0, "netlogonTrustAccountSid": null, "passwordType": "NTLMv2", "clientPolicyAccessCheck": null, "serverPolicyAccessCheck": null, "vers": {"major": 0, "minor": 1}, "result": {"type": "NTSTATUS", "value_raw": 0, "value_parsed": "SUCCESS"}}”, “success”: true}}
This happens so often that dmesg is constantly showing log rotations:
[ 5584.903076] systemd-journald[1419]: Data hash table of /var/log/journal/c962545ccffb427595843507f8c8bf45/system.journal has a fill level at 75.0 (8533 of 11377 items, 6553600 file size, 768 bytes per hash table item), suggesting rotation.
[ 5584.903083] systemd-journald[1419]: /var/log/journal/c962545ccffb427595843507f8c8bf45/system.journal: Journal header limits reached or header out-of-date, rotating.
I have an all-flash system (72 enterprise SSDs) so this has additional meaning to me. When the system is otherwise completely idle, the pool containing the system dataset is constantly writing these pointless audit messages. I’ve moved it to my boot pool, but it’s a SATADOM and cannot support this long term. I’m on SCALE 24.10, for what it’s worth.
Having a client continuously spin on authentication attempts is a bug that needs to be fixed on their side. This means the parent smbd process is under constant load of forking/execing. It is equivalent to a DOS attempt honestly.
You’re not incorrect in the assessment, though two things can be at fault. Proxmox’s approach is annoying, but it’s not a wrong way to do it. Other NAS vendors allow for disabling this nearly pointless message. Not all data points are useful all the time, and a successful login message is closer to a debug message than something necessary to log except in a regulated environment with the most verbose of logging requirements. If we don’t want to call this a bug, and I agree it’s not, then we need a toggle.
I’m experiencing a similar issue using zfs over iscsi on proxmox. The system polls via ssh every 10 seconds filling up the logs. I can’t seem to find a way to get proxmox to back off or to limit the logging on the truenas end. I recently added an SMB share to the mix and now the only thing I can see in pages of logs are successful authentication. I agree some granularity on filtering logging events might be called for.
This is a design flaw in proxmox that should be fixed. There is an actual dedicated SMB message for SMB keepalives, see [MS-SMB2]: SMB2 ECHO Request | Microsoft Learn
And probably many other ways to check for that server is up that don’t require constant authentication attempts.