I’m currently Running the following:
OS Version:TrueNAS-SCALE-23.10.2
Product:MS-7B79
Model:AMD Ryzen 7 2700 Eight-Core Processor
Memory:63 GiB
I have added a GTX 1060 and a AMD/ATI RV620LE HD3450 to the computer and allocated the GTX 1060 to Jellyfin. Ever since that, the utilization of my memory has slowly increased until it reached 100%
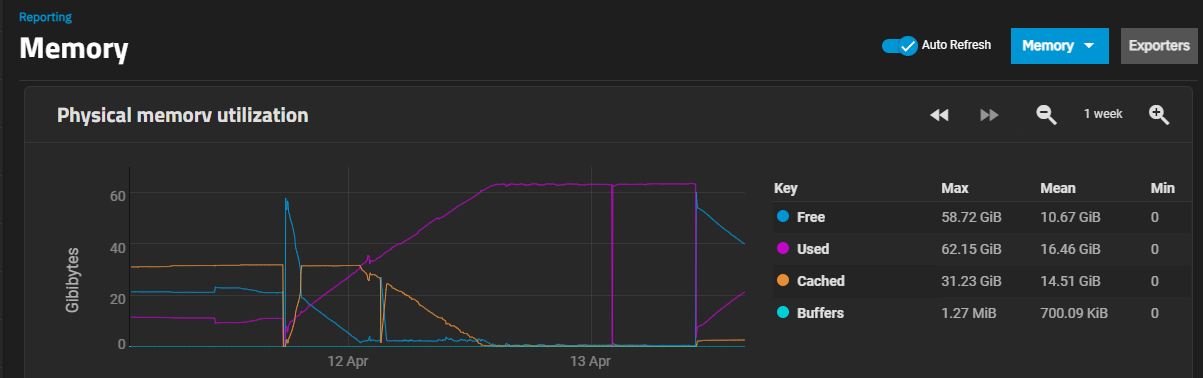
I have restarted the computer and now its starting again. See screenshot. Any Idea as to what may be happening?
Can you provide detail on how you are running Jellyfin… as an App or VM?
How is it configured?
You sure it’s not the ARC that is filling up as you play media?
1 Like
It is the purple line that you need to look at. This is memory used by apps.
So something (probably Jellyfin) is using increasing amounts of memory until the memory is fully used, pushing down the orange line which is the cache.
So, this is either a serious memory leak in Jellyfin where it is allocating memory and then not releasing it, or it is Jellyfin media transcoding using memory excessively.
I also wonder what is happening when the purple line suddenly drops to zero - is Jellyfin crashing due to being out of memory or what?
- Check that you are not using /tmp for the transcoding temporary files. /tmp is an in-memory file system.
- Check that you put a limit of (say) 30GB on the Jellyfin app to preserve the cache.
1 Like