Bit of an OCD request, but not all UPSs support all of the variables that are being graphed.
Would it be possible for each UPS configuration to include which variables should or should not be graphed? That way, variables that are not available could be omitted from the reporting page (this could perhaps be made automatic, perhaps if a variable being graphed returns null on first connection to the UPS - but simple might also be best!)
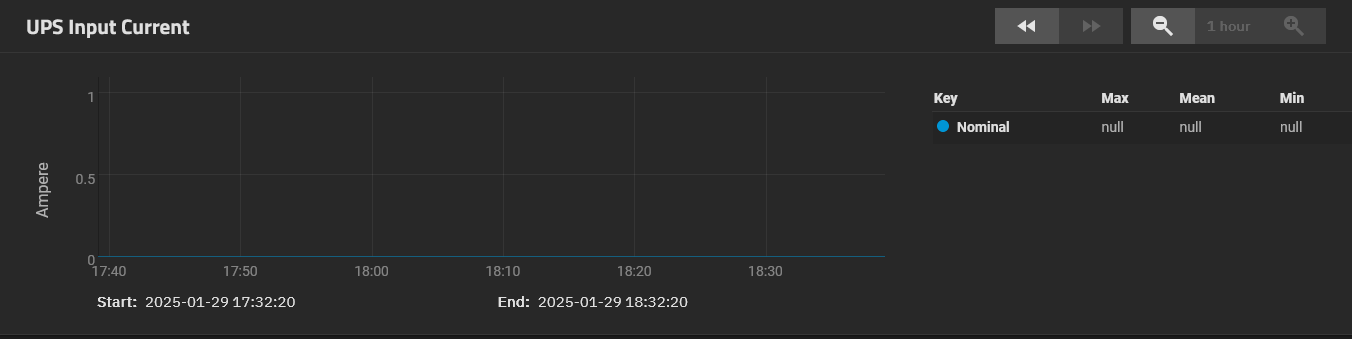
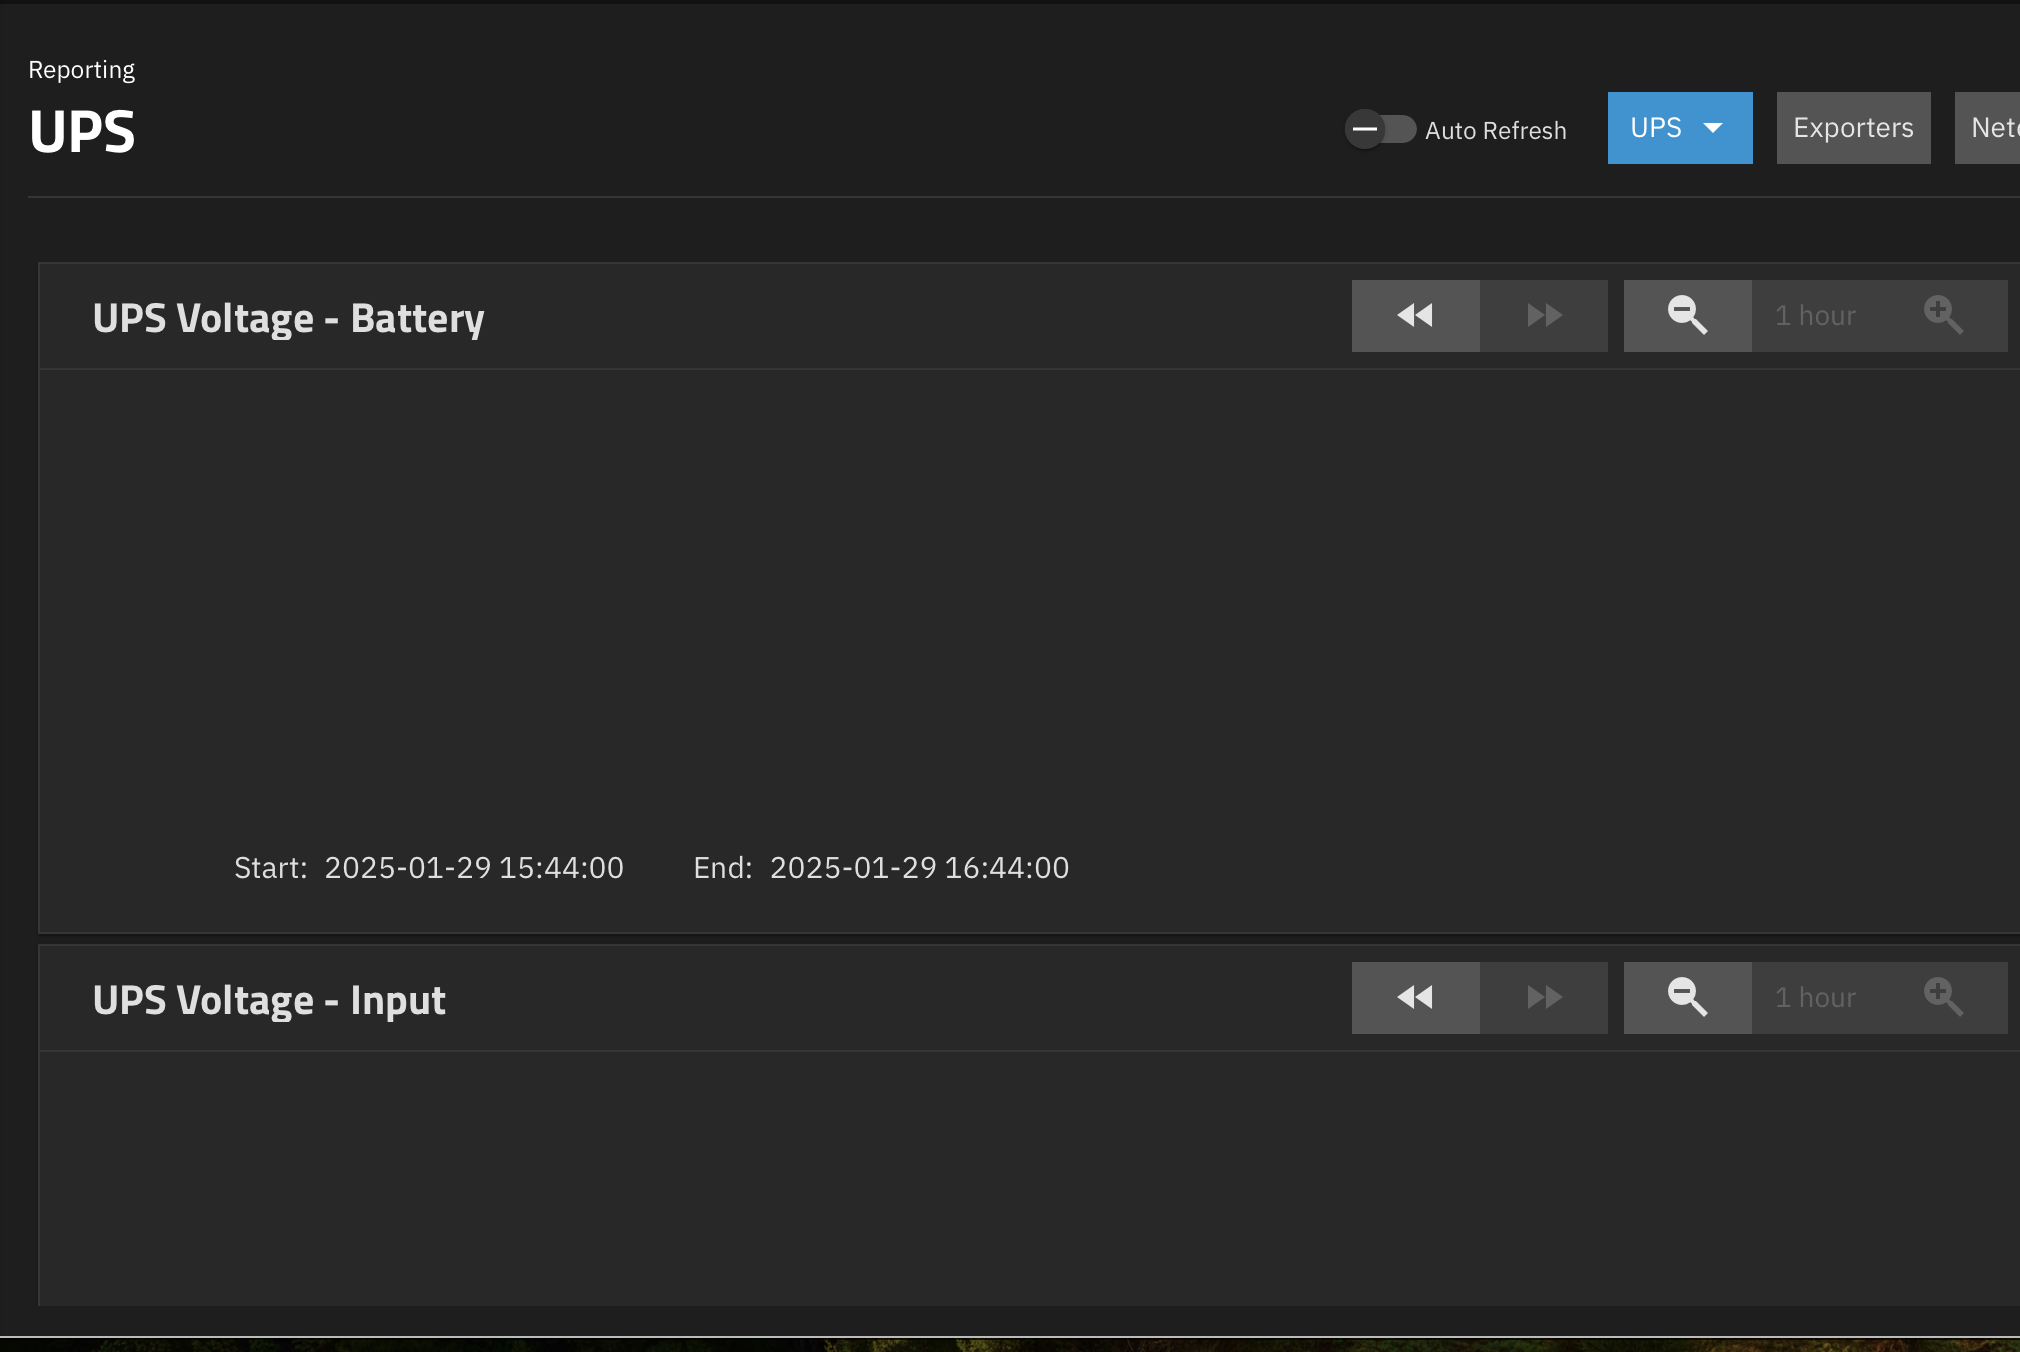
For example my Cyberpower CP1500EPFCLCD doesn’t support temperature, input current or input frequency. Consequently I have graphs being generated/rendered that are not useful:
I think a standard, consistent UI is easier across all the TrueNAS setups out there. I would want the same Widgets showing on the screens when troubleshooting problems over the internet and in screenshots.
You should be thankful you get any graphs in SCALE. All I get is blank pages. I have reported it many times and it never seems to get any traction, so I stopped caring. There was a similar problem in CORE many moons ago, which eventually got fixed.
Thanks. The only thing I did differently was to make nut_ups.conf a symbolic link.
cd /mnt/data/Software/truenas # path to a dataset
nano nut_ups.conf # paste conf file example, update host ip, save, exit
chmod a+x nut_ups.conf
cd /etc/netdata/charts.d
ln -sf /mnt/data/Software/truenas/nut_ups.conf
systemctl restart netdata.service
Now at least I get charts. We just need to get iXSystems fix it, automatically suppress unsupported (null) charts, and update runtime scale from days to minutes. Last time I used CORE the UPS charts worked reasonably well, but I think CORE used RRD.