I have recently spun up a TN Scale Dragonfish server from a Supermicro SSG-6028R-E1CR24N. It has the Intel 82599 2x SFP+ 10Gb SIOM in it. Writes are averaging 10 Mb/s in the dashboard. iperf3 is showing even slower.
Way too little info to be able to diagnose anything.
Apologies @Protopia, I thought an expert’s query would tell me what I needed to give.
2 x Intel(R) Xeon(R) CPU E5-2683 v4 @ 2.10GHz
128 GB ECC RAM
No L2ARC
Here are the iperf3 results:
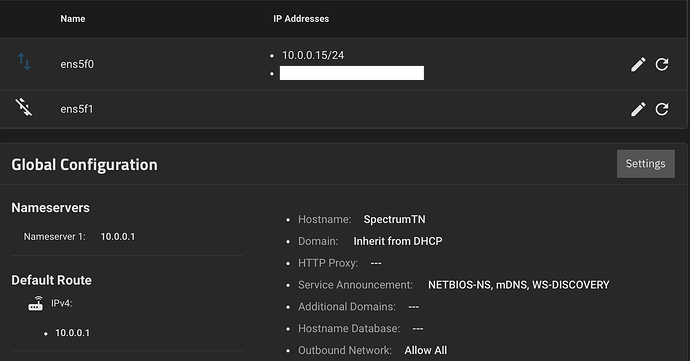
Here are my general network settings:
Here is what my pool is testing at:
admin@SpectrumTN[~]$ fio --ramp_time=5 --gtod_reduce=1 --numjobs=1 --bs=1M --size=100G --runtime=60s --readwrite=write --name=testfile
testfile: (g=0): rw=write, bs=(R) 1024KiB-1024KiB, (W) 1024KiB-1024KiB, (T) 1024KiB-1024KiB, ioengine=psync, iodepth=1
fio-3.33
Starting 1 process
testfile: Laying out IO file (1 file / 102400MiB)
Jobs: 1 (f=1): [W(1)][14.6%][w=98.1MiB/s][w=98 IOPS][eta 06m:27s]
testfile: (groupid=0, jobs=1): err= 0: pid=389557: Sat Aug  3 19:18:10 2024
  write: IOPS=231, BW=231MiB/s (242MB/s)(13.6GiB/60291msec); 0 zone resets
   bw (  KiB/s): min=69632, max=515078, per=100.00%, avg=237504.77, stdev=165054.68, samples=120
   iops        : min=   68, max=  503, avg=231.83, stdev=161.12, samples=120
  cpu          : usr=1.18%, sys=13.66%, ctx=14650, majf=0, minf=306
  IO depths    : 1=100.0%, 2=0.0%, 4=0.0%, 8=0.0%, 16=0.0%, 32=0.0%, >=64=0.0%
     submit    : 0=0.0%, 4=100.0%, 8=0.0%, 16=0.0%, 32=0.0%, 64=0.0%, >=64=0.0%
     complete  : 0=0.0%, 4=100.0%, 8=0.0%, 16=0.0%, 32=0.0%, 64=0.0%, >=64=0.0%
     issued rwts: total=0,13937,0,0 short=0,0,0,0 dropped=0,0,0,0
     latency   : target=0, window=0, percentile=100.00%, depth=1

Run status group 0 (all jobs):
  WRITE: bw=231MiB/s (242MB/s), 231MiB/s-231MiB/s (242MB/s-242MB/s), io=13.6GiB (14.6GB), run=60291-60291msec
@ericloewe any ideas where to look?
Running fiber or DAC? Maybe bad transceiver?
Fiber. The SFP is brand new, but I guess it’s possible the Rx on the server side is bad.
Straight up the only thing I could imagine.
*Edit: for arguements sake you can switch the SFPs around & see if you get bad reads instead of writes now ![]()
So that’s what I just did and it’s still the same problem.
EDIT: It’s my understanding that the Intel 82599ES was a well-supported chipset in TN Scale.
As well as any relevant OS made after 2010.
You’ve got unusable results receiving and terrible results sending. What’s on the other side of the link? How is the network structured? What happens if you remove all middlemen and run the tests directly attached to the other host?
Your iperf shows lower speeds, that’s totally a networking issue!
@ericloewe @Davvo Thank you for your responses. Let me elaborate @ericloewe
The 10Gb NIC in the back of my server is using a Ubiquiti MM SFP+ and the matching SFP+ on the other end of that goes into a 10Gb port my UDM Pro. I am accessing via a GbE connection to a laptop that I ran the iperf3 test from so the 900ish Mb read speed was expected, however, the 10Mb speed is abysmal. I do have a short DAC I am going to try and test with.
@Davvo I saw your original post on running my fio test on the boot pool. I am not a linux native and when I attempted to cd into my dataset it gave me an error. Would this be correct?
cd /Main/Spectrum
On CORE it would be cd /mnt/Main/Spectrum.
That being said, your iperf test showed that your system’s performance is of no significance to your current issue: you either have faulty networking hardware or improper networking configuration.
I was afraid of that. Is there a chance that my NIC has a firmware update? How would I check? Would I have to build a binary in the Linux shell? Is there guide somewhere for this?
I have absolutely no clue, but would start from testing with other hardware before delving into software/firmware.
It was indeed a hardware issue. Replaced SFPs with DAC and data is moving at full clip. Thank you for your input.
Hows the noise on this supermicro?

