I have my first TrueNAS SCALE system in place for a few weeks now, so far seems to be working well.
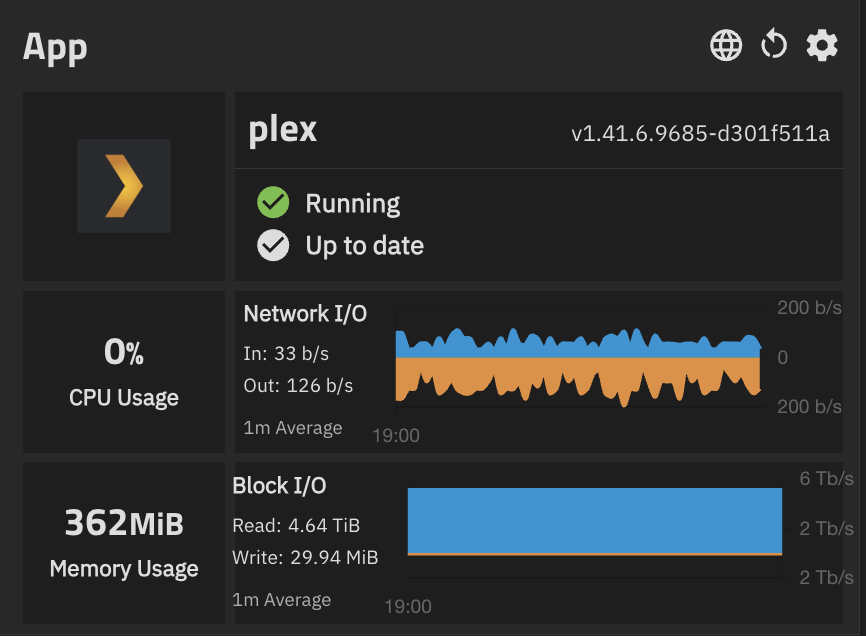
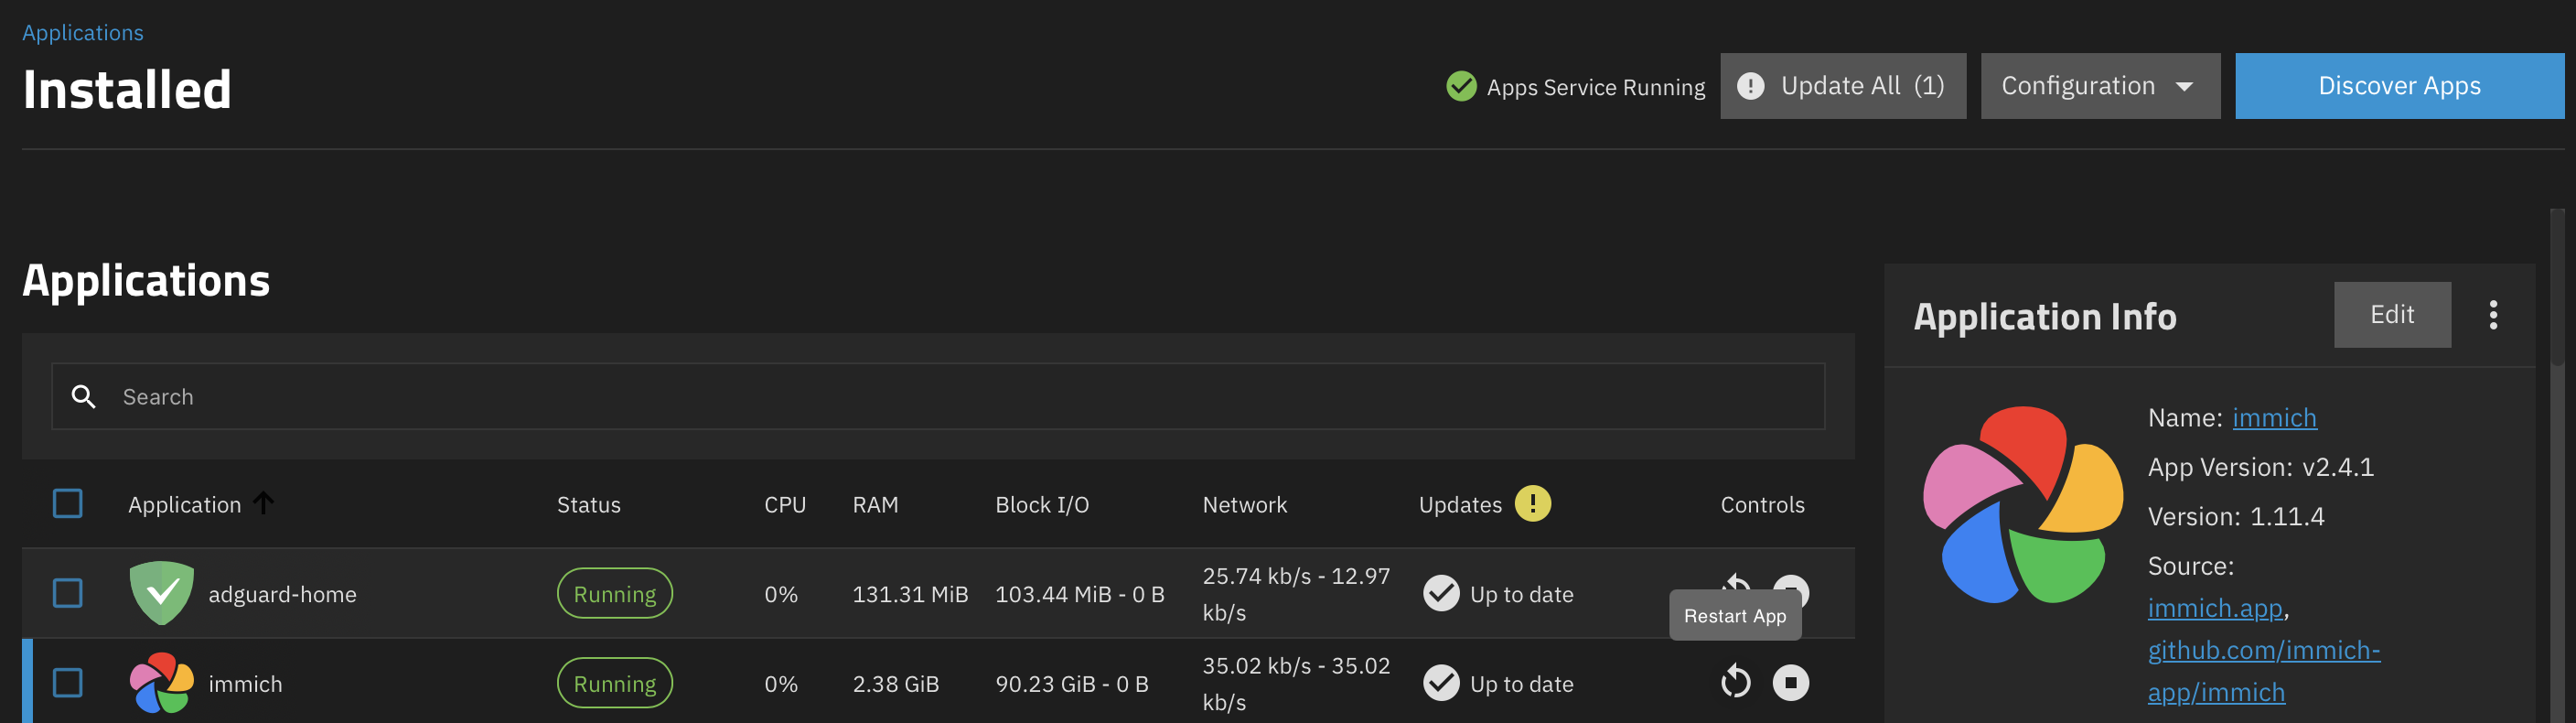
For the apps I have installed, in the applications table (as well as in the dashboard app widget) there is an entry for Block I/O. In both places the values are the same. I expected that they represent the amount of I/O that the apps are consuming at the current moment (in the widgets the values are in xxx/s). However the actual values seems way too high, almost like a cumulative amount. For example, Plex app is reporting 4.6 TiB/s reads!!! All the other apps also show very high numbers - my current disk I/O total accross all disks is in the single MiB / s range in the reports screen. Is this an issue with the apps screen or am I supposed to interpret this differently?
Lets start with the version of software you are running?
The Read readings are clearly too high. There might be a similar bug reported.
I’m running SCALE 25.04.0
Looks like NAS-134286 exists for this, though not much detail. The reported value is cumulative as opposed to realtime, restarting the app should reset it to zero, same as the “Block I/O” column in the apps pane.
Thanks - looks like this is probably it, so I’ll wait for the fix which looks like maybe it will be part of 25.10. I can’t tell from looking at the ticket that it was the cumulative value that is showing, or what is wrong with the network I/O since that was also referenced in the ticket.
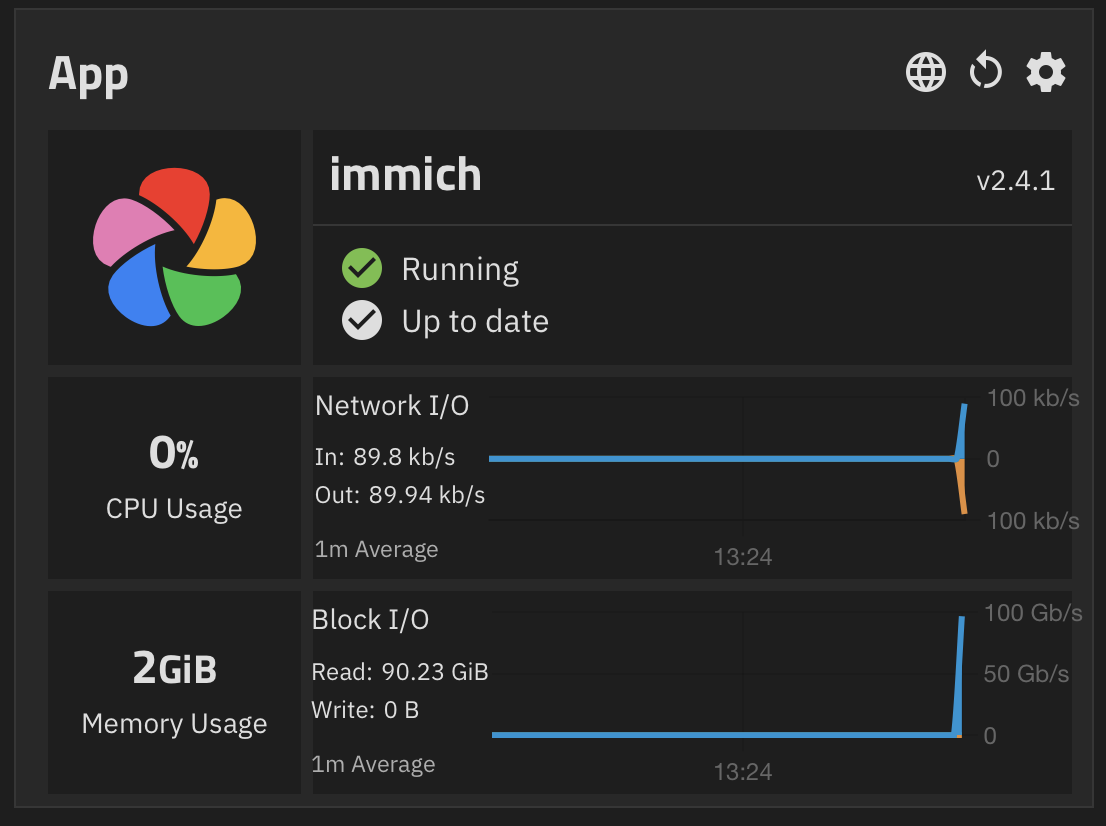
Goldeye 25.10.1 - 90 GiB for Immich
Block I/O is cumulative, so in your case it has read through 90GiB worth of data since being started, which is quite a lot! In my case I’m seeing 11.08GiB since Dec 21st, which sounds about correct to me.
Should be the same as what is reported if you run docker stats in terminal.
It is clear that the values currently shown are cumulative but is that what is supposed to be? From a dashboard perspective the rate is much more valuable than “total since last restart.” Also, the fact that it is labeled as “1m Average” with a vertical axis measured in “GB/s” is incompatible with a cumulative value.
The NAS-134286 ticket was just closed with a remark “We have reason to believe your issue has been fixed in the latest stable version available. Please upgrade and report back if the problem persists” but it’s very unclear what the fix was in what exact version and whether there is even agreement on the issue itself.
Block I/O is supposed to be cumulative yes though I personally think it could be improved to represent a shorter timeframe, but this is a bit more complex than what is currently being done (literally just a docker stats collection).
As for the graph, I’m not 100% sure what it looks like, but prior to this change this would show a full “block”, as in if you had 2G of Block I/O the graph would show 2Gb/s of Block I/O at all times, which is obviously incorrect. I think there might be a secondary bug here that occurs if middleware does not have prior information on historical blkio stats. I’ll have a poke at this when I can and will raise a ticket once I find the root cause.
I understand that a raw docker stats command provides the cumulative values for both Net I/O and Block I/O since the container was created. It seems to me that the graphs (see example I posted at the beginning of this thread) show something different for Net I/O - the values go up and down with time, so perhaps each data point is computed by subtracting the current - previous value and normalizing to 1 second (since the unit is displayed in a “per second” basis). However for Block I/O it also has a “per second” unit but it appears it is simply graphing the cumulative total. The graphs both look identical so it would make sense to use the same logic (my preference would be to use the Net I/O logic for both so we can determine at any moment by looking at the dashboard which apps are consuming resources at that particular moment).