Never mind, not tomorrow, here’s some AFR data…
This estimates the annual failure rate (AFR) of a pool assuming the individual disks in that pool have a 3% AFR (which is a decent estimate for consumer disks).
I’m using “effective width” here to more easily compare the different dRAID2/3 layouts to the RAIDZ2/Z3 layouts. Effective width for dRAID2 and 3 are the data disk quantities plus the parity level (so draid3:16d has an effective width of 3+16 = 19). Effective width for RAIDZ2 and 3 are just the vdev width.
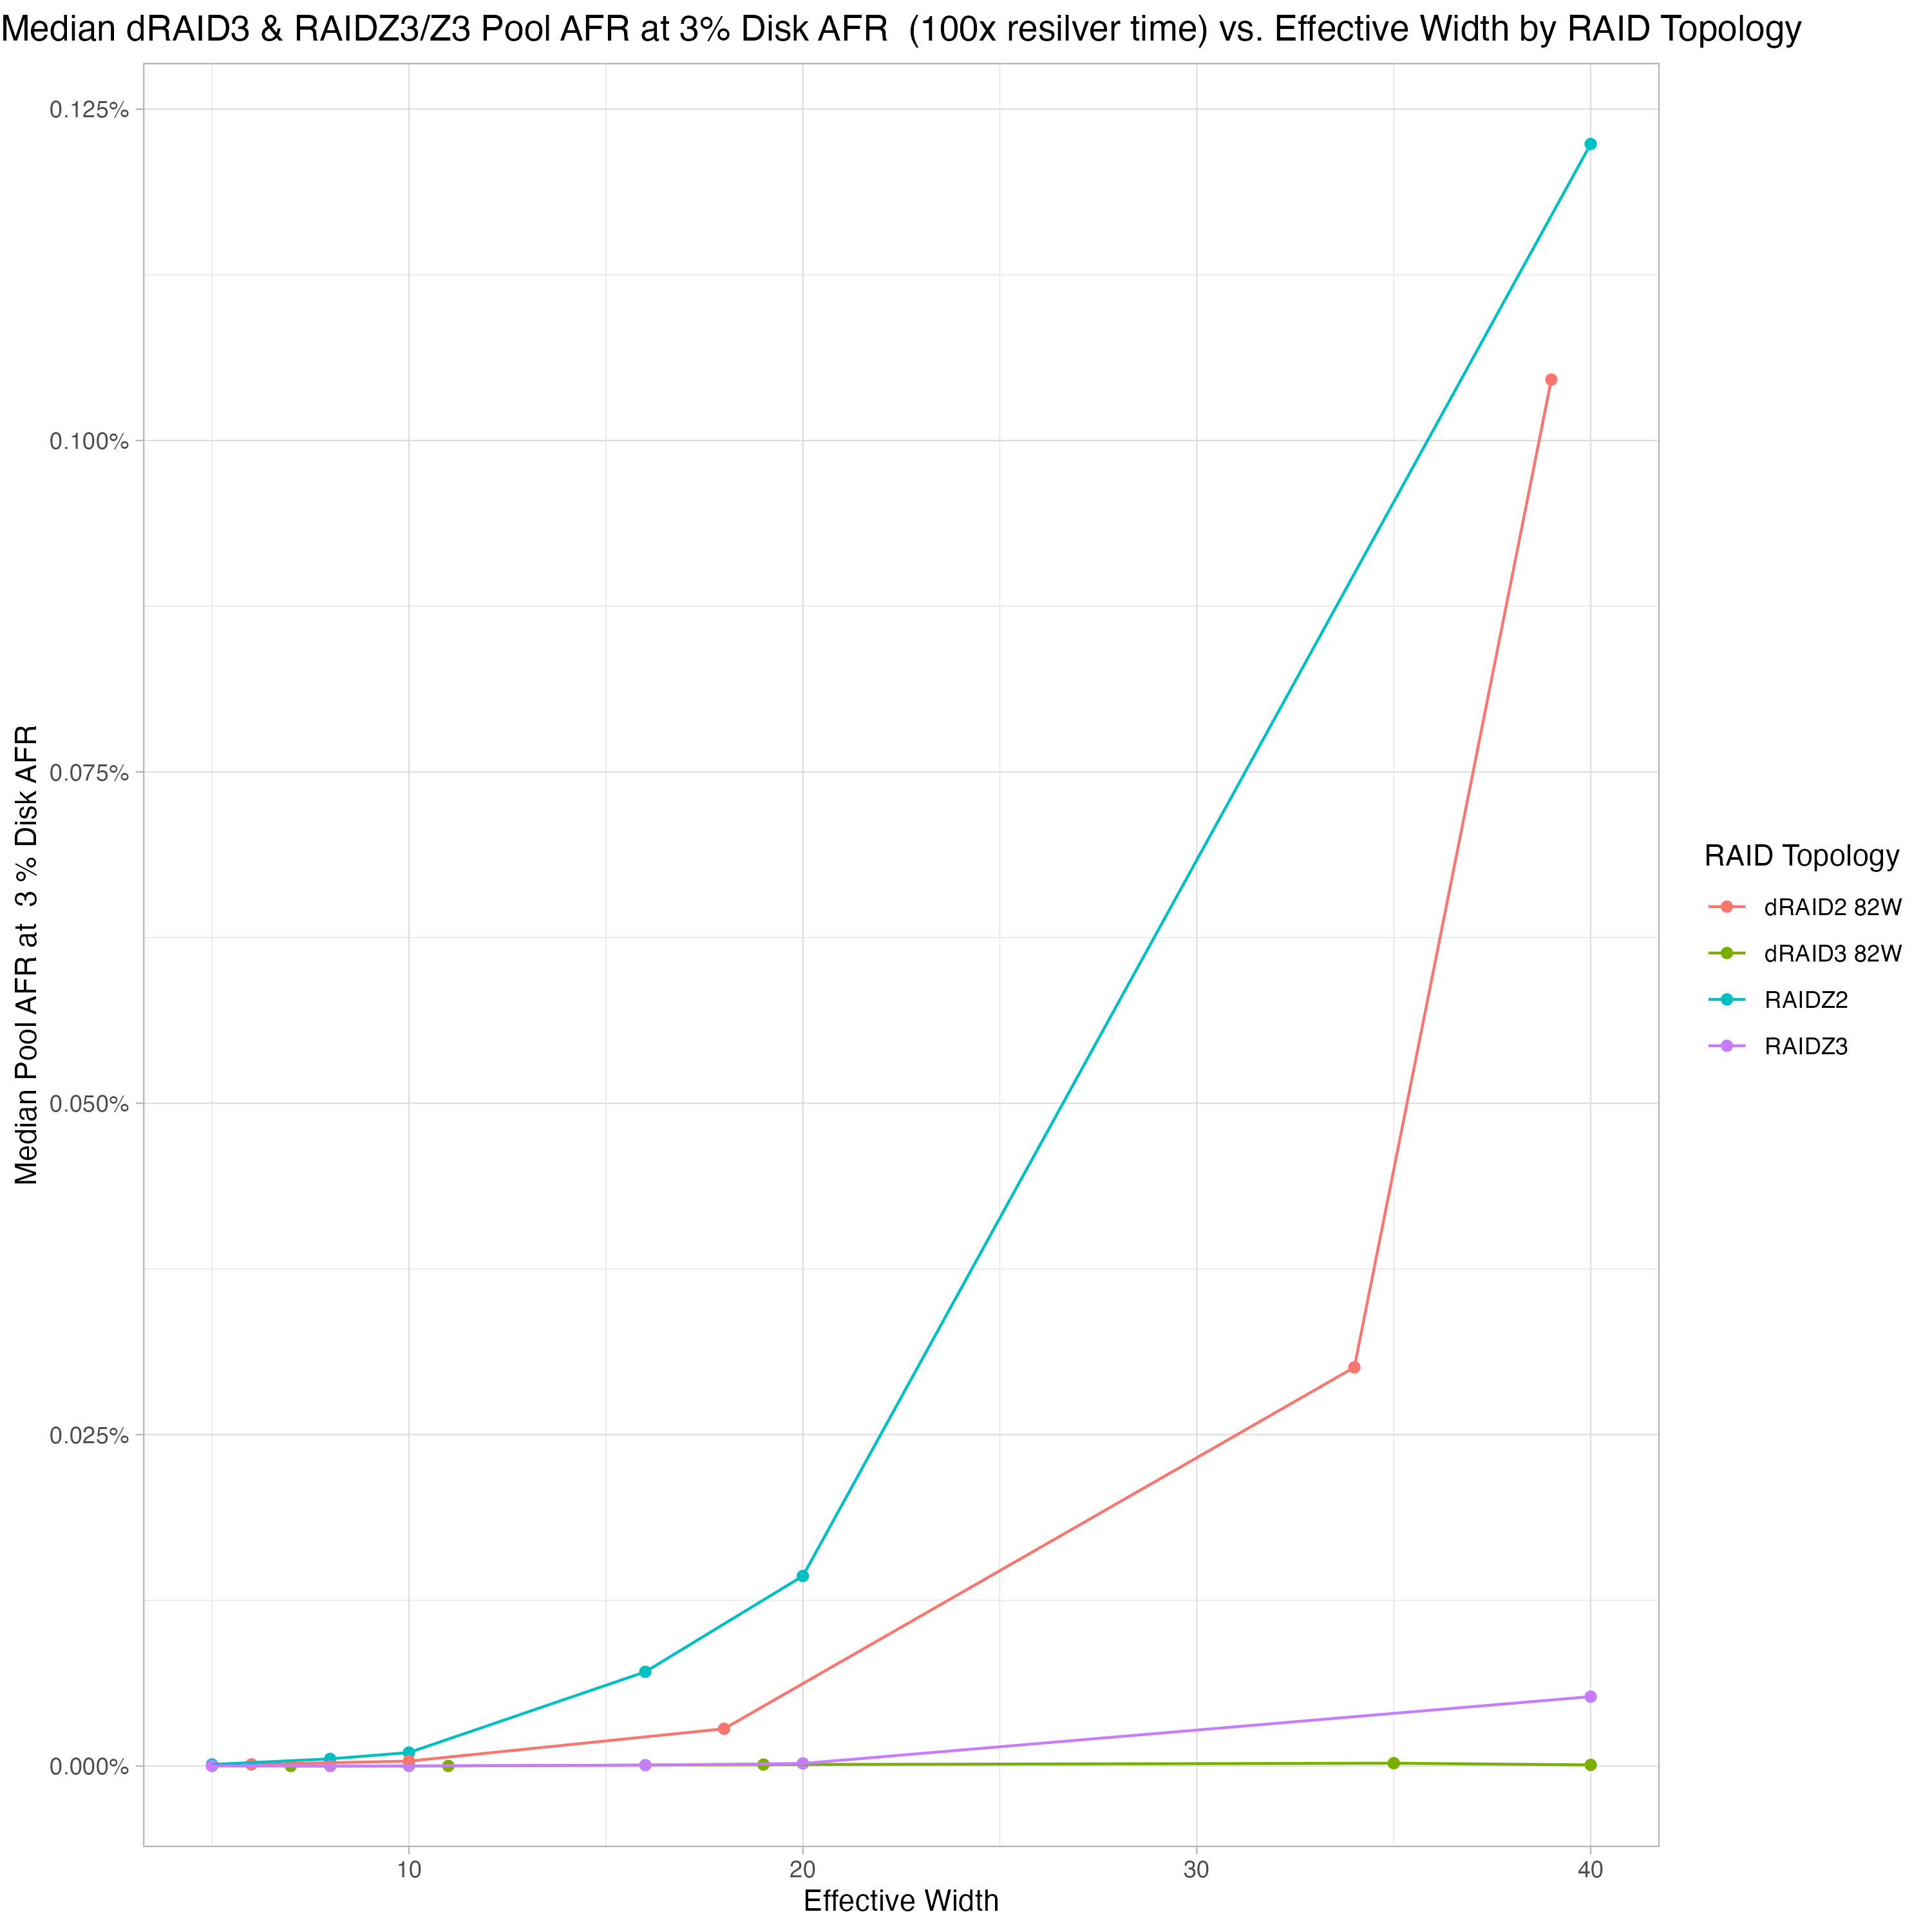
This was rushed, so it could be laid out better, and the plot title should say “RAIDZ2/Z3”, but you can clearly see that dRAID2 is a bit more reliable than RAIDZ2 at a given effective width and dRAID3 is a bit more reliable than RAIDZ3 at a given width. In my opinion, that little bit of extra reliability going from Z2 to dRAID2 or Z3 to dRAID3 doesn’t offset the major dRAID drawbacks (huge pool growth increments and no partial stripe write support).
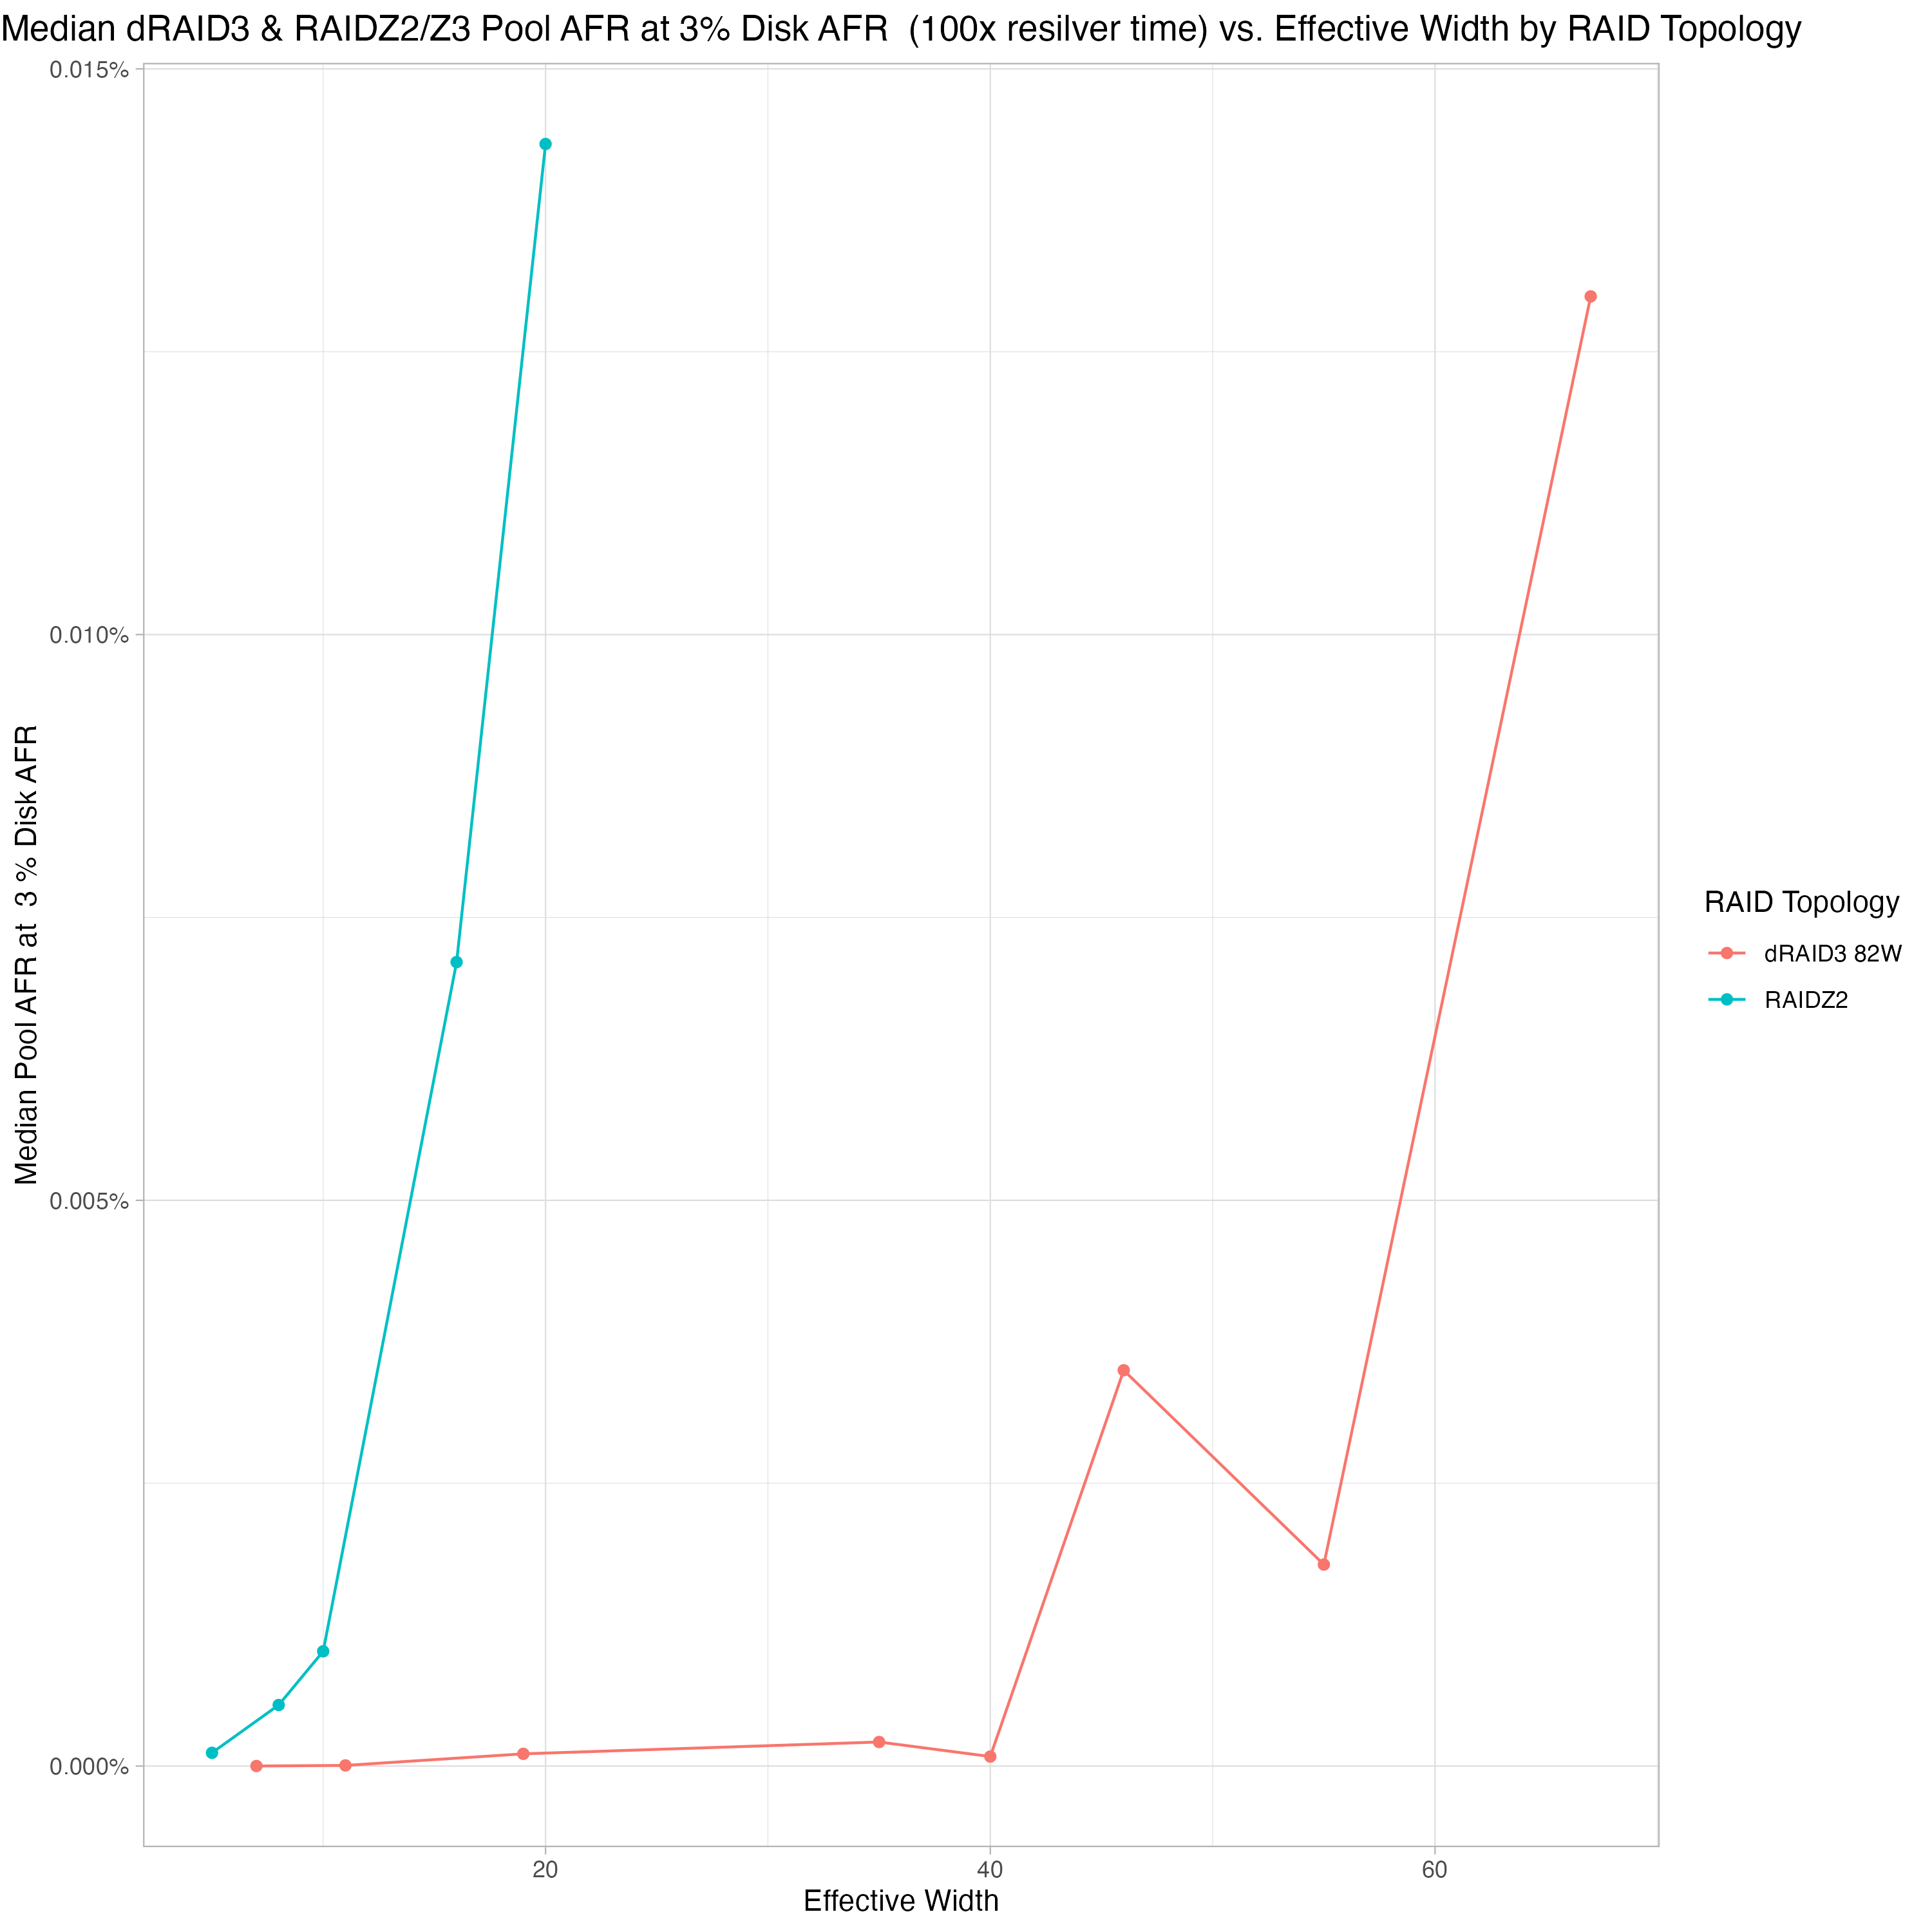
I think where dRAID can shine is by using dRAID3 instead of RAIDZ2. 10wZ2 is generally considered pretty safe and we can see that even super-wide dRAID3 layouts are at least as safe:

Beyond an effective width of 40, dRAID3 gets pretty wacky:
Again, after all this testing is complete, I plan to more carefully look over the data and write up something a bit more organized. I’m also going to try to create a statistical model of all the resilver data I’ve gathered (at this point, over 3,000 different data points, each one a resilver of a different pool layout with different fragmentation levels, pool stress levels, cpu stress levels, recordsizes, disk sizes, etc) and make it available in a javascript app.