Where should I put the L2ARC disk?

Hi folks ^^)

Well, as you see I have a silly question again :wink:

in my TrueNAS Scale I have 1 Zpool in Raid Z2 and 1 L2ARC ssd
 by the way that question bugs me :
The L2arc Cache disk must be integrated to the Zpool or not ???

I ask as the ‘topology’ report 1 data Vdevs of mixed capacity
 this annoy me :wink:

Mixed vdev

all disks are 10 TiB and the ssd is 500 GiB that’s why.

so,
can I pop out the ssd of the only VDEV and add it to its own cache VDEV ?
is such a configuration valid ?

there is 32 GB ram in this machine, and I can see that the L2arc cache is used a lot at times, enough to have been replaced one time since the creation of my TrueNas Scale box, the old ssd had ‘reached its end of life limit’ and I was getting a lot of read/write errors from my NAs 'till I puta new one in its place.

So, a cache vdev of a solo disk will be used as L2arc by the big disks RaidZ2 zpool or not ?

by advance TY :slight_smile:
Jeff

It IS a distinct vdev within the pool.
Look closely at your “10 TB” drives: At least one of them must be 9.999 TB instead


1 Like

Hello :slight_smile:

well all real HDDs are 9.1 TB (real size of a thieves 10 TiB HDD)
the HDD all report as 9.1 TB size
t(he SSD is smaller at only 500 GiB


btw where/how can I check reliably the size of each individual drive and get a block count ?

As usual, we need the fine detail to get to the absolute cause of this.

Can you please run the following commands and post the output from each in its own </> Preformatted Text box:

  • lsblk -bo NAME,MODEL,ROTA,PTTYPE,TYPE,START,SIZE,PARTTYPENAME,PARTUUID
  • sudo zpool status -v

These will tell us a little more info about the pool layout and a lot of info about the disks you have.

Voili :

elNas[~]$ lsblk -bo NAME,MODEL,ROTA,PTTYPE,TYPE,START,SIZE,PARTTYPENAME,PARTUUID
NAME   MODEL                    ROTA PTTYPE TYPE    START           SIZE PARTTYPENAME             PARTUUID
sda    HUH721010ALE601             1 gpt    disk          10000831348736                          
└─sda1                             1 gpt    part     4096 10000829234688 Solaris /usr & Apple ZFS aab036a6-7e2b-4632-b16d-cd7866845e5e
sdb    HUH721010ALE601             1 gpt    disk          10000831348736                          
└─sdb1                             1 gpt    part     4096 10000829234688 Solaris /usr & Apple ZFS a10d9ac9-ef2c-4ede-9e6b-eba01e901361
sdc    ST10000NE0008-2PL103        1 gpt    disk          10000831348736                          
└─sdc1                             1 gpt    part     4096 10000829234688 Solaris /usr & Apple ZFS 9f2dce88-cde7-4923-b0bb-bf4de890ea52
sdd    ST10000NE0008-2PL103        1 gpt    disk          10000831348736                          
└─sdd1                             1 gpt    part     4096 10000829234688 Solaris /usr & Apple ZFS 7a8f8da1-836b-4a4c-9eaa-2aa29da2beb7
sde    HUH721010ALE601             1 gpt    disk          10000831348736                          
└─sde1                             1 gpt    part     4096 10000829234688 Solaris /usr & Apple ZFS b74d4b85-0436-4814-8515-b405d7e40e24
sdf    HUH721010ALE601             1 gpt    disk          10000831348736                          
└─sdf1                             1 gpt    part     4096 10000829234688 Solaris /usr & Apple ZFS ea3b911a-d478-4341-b4cd-4549385fcdde
sdg    ST10000NM0046               1 gpt    disk          10009952870400                          
└─sdg1                             1 gpt    part     2048 10009950814208 Solaris /usr & Apple ZFS b4dbc538-a334-417c-9b6a-7265693bc710
sdh    ST10000NM0046               1 gpt    disk          10009952870400                          
└─sdh1                             1 gpt    part     2048 10009950814208 Solaris /usr & Apple ZFS 96d445ec-e8b2-42ce-8f1a-63ca963eead9
sdi    ST10000DM005-3AW101         1 gpt    disk          10000831348736                          
└─sdi1                             1 gpt    part     4096 10000829234688 Solaris /usr & Apple ZFS fd7f4ef7-237a-48c0-8a72-bebaf1cd3fb5
sdj    ST10000DM005-3AW101         1 gpt    disk          10000831348736                          
└─sdj1                             1 gpt    part     4096 10000829234688 Solaris /usr & Apple ZFS 83e62634-a0a5-4c2f-abb8-10b763833042
sdk    ST10000DM005-3AW101         1 gpt    disk          10000831348736                          
└─sdk1                             1 gpt    part     4096 10000829234688 Solaris /usr & Apple ZFS 52c0cc19-1576-4186-b41f-8ee005e7ebaf
sdl    ST10000DM005-3AW101         1 gpt    disk          10000831348736                          
└─sdl1                             1 gpt    part     4096 10000829234688 Solaris /usr & Apple ZFS ee9542ae-6266-4615-bcaa-6a0f06dafb87
sdm    ST10000DM005-3AW101         1 gpt    disk          10000831348736                          
└─sdm1                             1 gpt    part     2048 10000829251584 Solaris /usr & Apple ZFS af112e1e-211c-4061-a0bf-4e7f943903ca
sdn    WDC WD101EDBZ-11B1DA0       1 gpt    disk          10000831348736                          
└─sdn1                             1 gpt    part     2048 10000829251584 Solaris /usr & Apple ZFS c2c7b568-7eff-4f85-998b-eb4e1ac51897
sdo    WDC WDS500G1R0A-68A4W0      0 gpt    disk            500107862016                          
└─sdo1                             0 gpt    part     2048   500106788864 Solaris /usr & Apple ZFS b7523e48-e07b-4fbb-94c5-c6de97a7d33c
sdp    ST10000NM0046               1 gpt    disk          10009952870400                          
└─sdp1                             1 gpt    part     2048 10009950814208 Solaris /usr & Apple ZFS 0b764a40-fd5d-4631-922d-625178717347
sr0    HL-DT-ST DVDRAM GH24NSD5    1        rom               1073741312                          
sdq    ST10000NM0046               1 gpt    disk          10000831348736                          
└─sdq1                             1 gpt    part     2048 10000829251584 Solaris /usr & Apple ZFS e0df314c-cc1e-460e-9591-842264306d5b
sdr    ST3000DM001-1ER166          1 gpt    disk           3000592982016                          
├─sdr1                             1 gpt    part     4096        1048576 BIOS boot                c28d4013-73fe-49a9-a1a5-625da7d77eeb
├─sdr2                             1 gpt    part     6144      536870912 EFI System               020e5b7a-a0a9-4652-97ab-e7b3cd691ec8
├─sdr3                             1 gpt    part 34609152  2982873079296 Solaris /usr & Apple ZFS 1bd10b2f-e316-4326-b71b-106c5927adc2
└─sdr4                             1 gpt    part  1054720    17179869184 Linux swap               dfa1aa72-54ec-46e8-a749-caeaaf1d2621

and :

elNas[~]$ sudo zpool status -v


  pool: elZ2
 state: ONLINE
  scan: resilvered 16.3G in 00:35:38 with 0 errors on Sun Feb 23 03:13:13 2025
expand: expanded raidz2-0 copied 111T in 4 days 10:00:04, on Mon Jan  6 05:44:54 2025
config:

        NAME                                      STATE     READ WRITE CKSUM
        elZ2                                      ONLINE       0     0     0
          raidz2-0                                ONLINE       0     0     0
            aab036a6-7e2b-4632-b16d-cd7866845e5e  ONLINE       0     0     0
            7a8f8da1-836b-4a4c-9eaa-2aa29da2beb7  ONLINE       0     0     0
            a10d9ac9-ef2c-4ede-9e6b-eba01e901361  ONLINE       0     0     0
            9f2dce88-cde7-4923-b0bb-bf4de890ea52  ONLINE       0     0     0
            b74d4b85-0436-4814-8515-b405d7e40e24  ONLINE       0     0     0
            96d445ec-e8b2-42ce-8f1a-63ca963eead9  ONLINE       0     0     0
            b4dbc538-a334-417c-9b6a-7265693bc710  ONLINE       0     0     0
            fd7f4ef7-237a-48c0-8a72-bebaf1cd3fb5  ONLINE       0     0     0
            83e62634-a0a5-4c2f-abb8-10b763833042  ONLINE       0     0     0
            ea3b911a-d478-4341-b4cd-4549385fcdde  ONLINE       0     0     0
            52c0cc19-1576-4186-b41f-8ee005e7ebaf  ONLINE       0     0     0
            ee9542ae-6266-4615-bcaa-6a0f06dafb87  ONLINE       0     0     0
            0b764a40-fd5d-4631-922d-625178717347  ONLINE       0     0     0
            e0df314c-cc1e-460e-9591-842264306d5b  ONLINE       0     0     0
            af112e1e-211c-4061-a0bf-4e7f943903ca  ONLINE       0     0     0
            c2c7b568-7eff-4f85-998b-eb4e1ac51897  ONLINE       0     0     0
        cache
          b7523e48-e07b-4fbb-94c5-c6de97a7d33c    ONLINE       0     0     0

errors: No known data errors

  pool: boot-pool
 state: ONLINE
  scan: scrub repaired 0B in 00:05:36 with 0 errors on Mon Feb 17 03:50:38 2025
config:

        NAME        STATE     READ WRITE CKSUM
        boot-pool   ONLINE       0     0     0
          sdr3      ONLINE       0     0     0

errors: No known data errors

done :slight_smile:
Jeff

So, lsblk confirms what the GUI’s telling you–your “10 TB” disks are not all equal in size. You can ignore the warning if you like, but it’s correct. Your 16-wide RAIDZ2 vdev is a considerably larger problem.

4 Likes

Incidentally, this is another case where not any “10 TB” drive could be used to replace a drive in the pool

I wonder if the “mixed capacity” warning would even exist if the pool had been created in CORE or an earlier version of SCALE with about 2 GB set aside to allow adjustments.

1 Like

Indeed, in the case of the OP, it looks like the difference is just a tad over a 1GB, or did I miss a significantly larger drive in there somewhere?

The warning message appears overzealous.

Hmmm.

So we have:

The BarraCuda and Elements drives are consumer grade with firmware optimised for workstations, which can mean different drive timeouts and less diagnostic information and no vibration protection. Whilst they are also 7200rpm which is good, they are not Helium drives and so are likely to run hotter which (depending upon cooling airflow) can be a problem when closely packed in a NAS.

The problem with longer timeouts is that they can appear to ZFS to have hung and then they will be marked Offline or Unavailable or Errored and the pool will be Degraded. Lose any 3 of these 6 drives at the same time and your entire pool and your data will be gone.

Worst of all are the 5x BarraCuda drives which are SMR and utterly and absolutely unsuitable for ZFS redundant pools particularly one as wide as 16x. They will perform fine in a home environment under low load, but when you try to bulk write to them - especially during a resilver - they will perform like a dog and this may precipitate a timeout error and thus increase the likelihood of 3 drives erroring at the same time.

The good news is that the pool is already working with the smaller drive size used on all drives, so resilvering should work.

Regarding the L2ARC drive, it looks like it is configured correctly, but whether it does anything for you is a different question.

Results of a quick search for the model number suggest these are CMR, “Barracuda Pro” drives only sold as external drives. So no worse (but no better) than the WD Elements.
Barracuda SMR are 8 TB or less.

According to NasCompares this specific model is SMR.

According to The HDD Platter Capacity Database likely to be CMR.

Amazingly, the first question about whether this drive is CMR or SMR was 3-4 years ago, and there still doesn’t appear to be a definitive answer.

Perhaps @jeffv03 can run sudo smartctl -x /dev/sdj and post the results and it will tell us.

1 Like

According to the table at the bottom of the page, and the Seagate PDF datasheet you linked, SMR Barracuda Compute tops at 8 TB.
In the database I could retrieve, it is CMR


although the second entry with type “SATA” suggests that reliability may not be the highest


Hello ^^)

as the drive support Farm log, I added it to see what :slight_smile:

Smart test results /sdj

elNas[~]$ sudo smartctl -x -l farm /dev/sdj

smartctl 7.4 2023-08-01 r5530 [x86_64-linux-6.6.44-production+truenas] (local build)
Copyright (C) 2002-23, Bruce Allen, Christian Franke, www.smartmontools.org

=== START OF INFORMATION SECTION ===
Device Model: ST10000DM005-3AW101
Serial Number: WP00BHLQ
LU WWN Device Id: 5 000c50 0e3cf9267
Firmware Version: DN04
User Capacity: 10,000,831,348,736 bytes [10.0 TB]
Sector Sizes: 512 bytes logical, 4096 bytes physical
Rotation Rate: 7200 rpm
Form Factor: 3.5 inches
Device is: Not in smartctl database 7.3/5528
ATA Version is: ACS-4 (minor revision not indicated)
SATA Version is: SATA 3.3, 6.0 Gb/s (current: 6.0 Gb/s)
Local Time is: Sun Feb 23 22:37:58 2025 CET
SMART support is: Available - device has SMART capability.
SMART support is: Enabled
AAM feature is: Unavailable
APM feature is: Unavailable
Rd look-ahead is: Enabled
Write cache is: Enabled
DSN feature is: Disabled
ATA Security is: Disabled, NOT FROZEN [SEC1]
Write SCT (Get) Feature Control Command failed: scsi error aborted command
Wt Cache Reorder: Unknown (SCT Feature Control command failed)

=== START OF READ SMART DATA SECTION ===
SMART overall-health self-assessment test result: PASSED

General SMART Values:
Offline data collection status: (0x82) Offline data collection activity
was completed without error.
Auto Offline Data Collection: Enabled.
Self-test execution status: ( 0) The previous self-test routine completed
without error or no self-test has ever
been run.
Total time to complete Offline
data collection: ( 559) seconds.
Offline data collection
capabilities: (0x7b) SMART execute Offline immediate.
Auto Offline data collection on/off support.
Suspend Offline collection upon new
command.
Offline surface scan supported.
Self-test supported.
Conveyance Self-test supported.
Selective Self-test supported.
SMART capabilities: (0x0003) Saves SMART data before entering
power-saving mode.
Supports SMART auto save timer.
Error logging capability: (0x01) Error logging supported.
General Purpose Logging supported.
Short self-test routine
recommended polling time: ( 1) minutes.
Extended self-test routine
recommended polling time: ( 872) minutes.
Conveyance self-test routine
recommended polling time: ( 2) minutes.
SCT capabilities: (0x50bd) SCT Status supported.
SCT Error Recovery Control supported.
SCT Feature Control supported.
SCT Data Table supported.

SMART Attributes Data Structure revision number: 10
Vendor Specific SMART Attributes with Thresholds:
ID# ATTRIBUTE_NAME FLAGS VALUE WORST THRESH FAIL RAW_VALUE
1 Raw_Read_Error_Rate POSR-- 067 064 044 - 4877520
3 Spin_Up_Time PO---- 088 087 000 - 0
4 Start_Stop_Count -O–CK 100 100 020 - 66
5 Reallocated_Sector_Ct PO–CK 100 100 010 - 0
7 Seek_Error_Rate POSR-- 085 060 045 - 353416351
9 Power_On_Hours -O–CK 081 081 000 - 16946
10 Spin_Retry_Count PO–C- 100 100 097 - 0
12 Power_Cycle_Count -O–CK 100 100 020 - 66
18 Unknown_Attribute PO-R-- 100 100 050 - 0
187 Reported_Uncorrect -O–CK 100 100 000 - 0
188 Command_Timeout -O–CK 100 100 000 - 1
190 Airflow_Temperature_Cel -O—K 059 033 000 - 41 (Min/Max 40/42)
192 Power-Off_Retract_Count -O–CK 100 100 000 - 57
193 Load_Cycle_Count -O–CK 100 100 000 - 1508
194 Temperature_Celsius -O—K 041 067 000 - 41 (0 19 0 0 0)
197 Current_Pending_Sector -O–C- 100 100 000 - 0
198 Offline_Uncorrectable ----C- 100 100 000 - 0
199 UDMA_CRC_Error_Count -OSRCK 200 200 000 - 0
240 Head_Flying_Hours ------ 100 253 000 - 16724 (202 250 0)
241 Total_LBAs_Written ------ 100 253 000 - 182632510326
242 Total_LBAs_Read ------ 100 253 000 - 143485005624052
||||||_ K auto-keep
|||||__ C event count
||||___ R error rate
|||____ S speed/performance
||_____ O updated online
|______ P prefailure warning

General Purpose Log Directory Version 1
SMART Log Directory Version 1 [multi-sector log support]
Address Access R/W Size Description
0x00 GPL,SL R/O 1 Log Directory
0x01 SL R/O 1 Summary SMART error log
0x02 SL R/O 5 Comprehensive SMART error log
0x03 GPL R/O 5 Ext. Comprehensive SMART error log
0x04 GPL R/O 256 Device Statistics log
0x04 SL R/O 8 Device Statistics log
0x06 SL R/O 1 SMART self-test log
0x07 GPL R/O 1 Extended self-test log
0x08 GPL R/O 2 Power Conditions log
0x09 SL R/W 1 Selective self-test log
0x0a GPL R/W 8 Device Statistics Notification
0x0c GPL R/O 2048 Pending Defects log
0x10 GPL R/O 1 NCQ Command Error log
0x11 GPL R/O 1 SATA Phy Event Counters log
0x13 GPL R/O 1 SATA NCQ Send and Receive log
0x21 GPL R/O 1 Write stream error log
0x22 GPL R/O 1 Read stream error log
0x24 GPL R/O 768 Current Device Internal Status Data log
0x2f GPL R/O 1 Set Sector Configuration
0x30 GPL,SL R/O 9 IDENTIFY DEVICE data log
0x80-0x9f GPL,SL R/W 16 Host vendor specific log
0xa1 GPL,SL VS 160 Device vendor specific log
0xa2 GPL VS 16320 Device vendor specific log
0xa4 GPL,SL VS 160 Device vendor specific log
0xa6 GPL VS 192 Device vendor specific log
0xa8-0xa9 GPL,SL VS 136 Device vendor specific log
0xab GPL VS 1 Device vendor specific log
0xad GPL VS 16 Device vendor specific log
0xb1 GPL,SL VS 160 Device vendor specific log
0xb6 GPL VS 1920 Device vendor specific log
0xbe-0xbf GPL VS 65535 Device vendor specific log
0xc1 GPL,SL VS 8 Device vendor specific log
0xc3 GPL,SL VS 24 Device vendor specific log
0xc6 GPL VS 5184 Device vendor specific log
0xc7 GPL,SL VS 8 Device vendor specific log
0xc9 GPL,SL VS 8 Device vendor specific log
0xca GPL,SL VS 16 Device vendor specific log
0xcd GPL,SL VS 1 Device vendor specific log
0xce GPL VS 1 Device vendor specific log
0xcf GPL VS 512 Device vendor specific log
0xd1 GPL VS 656 Device vendor specific log
0xd2 GPL VS 10256 Device vendor specific log
0xd4 GPL VS 2048 Device vendor specific log
0xda GPL,SL VS 1 Device vendor specific log
0xe0 GPL,SL R/W 1 SCT Command/Status
0xe1 GPL,SL R/W 1 SCT Data Transfer

SMART Extended Comprehensive Error Log Version: 1 (5 sectors)
No Errors Logged

SMART Extended Self-test Log Version: 1 (1 sectors)
No self-tests have been logged. [To run self-tests, use: smartctl -t]

SMART Selective self-test log data structure revision number 1
SPAN MIN_LBA MAX_LBA CURRENT_TEST_STATUS
1 0 0 Not_testing
2 0 0 Not_testing
3 0 0 Not_testing
4 0 0 Not_testing
5 0 0 Not_testing
Selective self-test flags (0x0):
After scanning selected spans, do NOT read-scan remainder of disk.
If Selective self-test is pending on power-up, resume after 0 minute delay.

SCT Status Version: 3
SCT Version (vendor specific): 522 (0x020a)
Device State: Active (0)
Current Temperature: 41 Celsius
Power Cycle Min/Max Temperature: 40/42 Celsius
Lifetime Min/Max Temperature: 19/67 Celsius
Under/Over Temperature Limit Count: 0/10
SMART Status: 0xc24f (PASSED)
Vendor specific:
00 00 00 00 00 00 00 00 00 00 00 00 00 00 00 00
00 00 00 00 03 00 00 00 00 00 00 00 00 00 00 00

SCT Temperature History Version: 2
Temperature Sampling Period: 4 minutes
Temperature Logging Interval: 59 minutes
Min/Max recommended Temperature: 10/25 Celsius
Min/Max Temperature Limit: 5/70 Celsius
Temperature History Size (Index): 128 (19)

Index Estimated Time Temperature Celsius
20 2025-02-18 17:24 39 ********************

 
( 19 skipped). 
 ********************
40 2025-02-19 13:04 39 ********************
41 2025-02-19 14:03 40 *********************
42 2025-02-19 15:02 40 *********************
43 2025-02-19 16:01 40 *********************
44 2025-02-19 17:00 39 ********************

 
( 3 skipped). 
 ********************
48 2025-02-19 20:56 39 ********************
49 2025-02-19 21:55 40 *********************

 
( 3 skipped). 
 *********************
53 2025-02-20 01:51 40 *********************
54 2025-02-20 02:50 41 **********************
55 2025-02-20 03:49 40 *********************
56 2025-02-20 04:48 40 *********************
57 2025-02-20 05:47 41 **********************
58 2025-02-20 06:46 40 *********************

 
( 5 skipped). 
 *********************
64 2025-02-20 12:40 40 *********************
65 2025-02-20 13:39 41 **********************

 
( 46 skipped). 
 **********************
112 2025-02-22 11:52 41 **********************
113 2025-02-22 12:51 42 ***********************
114 2025-02-22 13:50 41 **********************

 
( 11 skipped). 
 **********************
126 2025-02-23 01:38 41 **********************
127 2025-02-23 02:37 38 *******************
0 2025-02-23 03:36 38 *******************
1 2025-02-23 04:35 37 ******************
2 2025-02-23 05:34 38 *******************
3 2025-02-23 06:33 37 ******************
4 2025-02-23 07:32 40 *********************
5 2025-02-23 08:31 41 **********************

 
( 2 skipped). 
 **********************
8 2025-02-23 11:28 41 **********************
9 2025-02-23 12:27 ? -
10 2025-02-23 13:26 40 *********************
11 2025-02-23 14:25 41 **********************
12 2025-02-23 15:24 40 *********************
13 2025-02-23 16:23 41 **********************

 
( 5 skipped). 
 **********************
19 2025-02-23 22:17 41 **********************

SCT Error Recovery Control:
Read: 70 (7.0 seconds)
Write: 70 (7.0 seconds)

Device Statistics (GP Log 0x04)
Page Offset Size Value Flags Description
0x01 ===== = = === == General Statistics (rev 1) ==
0x01 0x008 4 66 — Lifetime Power-On Resets
0x01 0x010 4 16946 — Power-on Hours
0x01 0x018 6 182628060868 — Logical Sectors Written
0x01 0x020 6 8015400132 — Number of Write Commands
0x01 0x028 6 143480542394112 — Logical Sectors Read
0x01 0x030 6 8903360371 — Number of Read Commands
0x01 0x038 6 - — Date and Time TimeStamp
0x03 ===== = = === == Rotating Media Statistics (rev 1) ==
0x03 0x008 4 16932 — Spindle Motor Power-on Hours
0x03 0x010 4 16801 — Head Flying Hours
0x03 0x018 4 1508 — Head Load Events
0x03 0x020 4 0 — Number of Reallocated Logical Sectors
0x03 0x028 4 0 — Read Recovery Attempts
0x03 0x030 4 0 — Number of Mechanical Start Failures
0x03 0x038 4 0 — Number of Realloc. Candidate Logical Sectors
0x03 0x040 4 57 — Number of High Priority Unload Events
0x04 ===== = = === == General Errors Statistics (rev 1) ==
0x04 0x008 4 0 — Number of Reported Uncorrectable Errors
0x04 0x010 4 1 — Resets Between Cmd Acceptance and Completion
0x04 0x018 4 0 -D- Physical Element Status Changed
0x05 ===== = = === == Temperature Statistics (rev 1) ==
0x05 0x008 1 41 — Current Temperature
0x05 0x010 1 40 — Average Short Term Temperature
0x05 0x018 1 40 — Average Long Term Temperature
0x05 0x020 1 67 — Highest Temperature
0x05 0x028 1 28 — Lowest Temperature
0x05 0x030 1 55 — Highest Average Short Term Temperature
0x05 0x038 1 37 — Lowest Average Short Term Temperature
0x05 0x040 1 51 — Highest Average Long Term Temperature
0x05 0x048 1 40 — Lowest Average Long Term Temperature
0x05 0x050 4 0 — Time in Over-Temperature
0x05 0x058 1 70 — Specified Maximum Operating Temperature
0x05 0x060 4 0 — Time in Under-Temperature
0x05 0x068 1 5 — Specified Minimum Operating Temperature
0x06 ===== = = === == Transport Statistics (rev 1) ==
0x06 0x008 4 97 — Number of Hardware Resets
0x06 0x010 4 22 — Number of ASR Events
0x06 0x018 4 0 — Number of Interface CRC Errors
0xff ===== = = === == Vendor Specific Statistics (rev 1) ==
0xff 0x010 7 0 — Vendor Specific
0xff 0x018 7 0 — Vendor Specific
|||_ C monitored condition met
||__ D supports DSN
|___ N normalized value

Pending Defects log (GP Log 0x0c)
No Defects Logged

SATA Phy Event Counters (GP Log 0x11)
ID Size Value Description
0x000a 2 1 Device-to-host register FISes sent due to a COMRESET
0x0001 2 0 Command failed due to ICRC error
0x0003 2 0 R_ERR response for device-to-host data FIS
0x0004 2 0 R_ERR response for host-to-device data FIS
0x0006 2 0 R_ERR response for device-to-host non-data FIS
0x0007 2 0 R_ERR response for host-to-device non-data FIS

Seagate Field Access Reliability Metrics log (FARM) (GP Log 0xa6)
FARM Log Page 0: Log Header
FARM Log Version: 4.19
Pages Supported: 6
Log Size: 98304
Page Size: 16384
Heads Supported: 24
Number of Copies: 0
Reason for Frame Capture: 0
FARM Log Page 1: Drive Information
Serial Number: WP00BHLQ
World Wide Name: 0x5000c500e3cf9267
Device Interface: SATA
Device Capacity in Sectors: 19532873728
Physical Sector Size: 4096
Logical Sector Size: 512
Device Buffer Size: 268435456
Number of Heads: 10
Device Form Factor: 3.5 inches
Rotation Rate: 7200 rpm
Firmware Rev: DN04
ATA Security State (ID Word 128): 0x01621
ATA Features Supported (ID Word 78): 0x016cc
ATA Features Enabled (ID Word 79): 0x0000000000000044
Power on Hours: 16946
Spindle Power on Hours: 16932
Head Flight Hours: 16801
Head Load Events: 1508
Power Cycle Count: 67
Hardware Reset Count: 97
Spin-up Time: 13 ms
Time to ready of the last power cycle: 31340 ms
Time drive is held in staggered spin: 0 ms
Model Number: ST10000DM005-3AW101
Drive Recording Type: CMR
Max Number of Available Sectors for Reassignment: 16384
Assembly Date (YYWW): 1225
Depopulation Head Mask: 0
FARM Log Page 2: Workload Statistics
Total Number of Read Commands: 8904147095
Total Number of Write Commands: 8015584202
Total Number of Random Read Commands: 153165706
Total Number of Random Write Commands: 7980797363
Total Number Of Other Commands: 34922286
Logical Sectors Written: 182631895113
Logical Sectors Read: 10678794775811
Number of dither events during current power cycle: 545
Number of times dither was held off during random workloads: 1035
Number of times dither was held off during sequential workloads: 7
Number of Read commands from 0-3.125% of LBA space for last 3 SMART Summary Frames: 44738258
Number of Read commands from 3.125-25% of LBA space for last 3 SMART Summary Frames: 161441082
Number of Read commands from 25-75% of LBA space for last 3 SMART Summary Frames: 182739622
Number of Read commands from 75-100% of LBA space for last 3 SMART Summary Frames: 188650180
Number of Write commands from 0-3.125% of LBA space for last 3 SMART Summary Frames: 684671
Number of Write commands from 3.125-25% of LBA space for last 3 SMART Summary Frames: 0
Number of Write commands from 25-75% of LBA space for last 3 SMART Summary Frames: 0
Number of Write commands from 75-100% of LBA space for last 3 SMART Summary Frames: 20881589
FARM Log Page 3: Error Statistics
Unrecoverable Read Errors: 0
Unrecoverable Write Errors: 0
Number of Reallocated Sectors: 0
Number of Read Recovery Attempts: 0
Number of Mechanical Start Failures: 0
Number of Reallocated Candidate Sectors: 0
Number of ASR Events: 22
Number of Interface CRC Errors: 0
Spin Retry Count: 0
Spin Retry Count Normalized: 100
Spin Retry Count Worst: 100
Number of IOEDC Errors (Raw): 0
CTO Count Total: 1
CTO Count Over 5s: 0
CTO Count Over 7.5s: 0
Total Flash LED (Assert) Events: 0
Index of the last Flash LED: 0
Flash LED Event 0:
Event Information: 0x0000000000000000
Timestamp of Event 0 (hours): 0
Power Cycle Event 0: 0
Flash LED Event 1:
Event Information: 0x0000000000000000
Timestamp of Event 1 (hours): 0
Power Cycle Event 1: 0
Flash LED Event 2:
Event Information: 0x0000000000000000
Timestamp of Event 2 (hours): 0
Power Cycle Event 2: 0
Flash LED Event 3:
Event Information: 0x0000000000000000
Timestamp of Event 3 (hours): 0
Power Cycle Event 3: 0
Flash LED Event 4:
Event Information: 0x0000000000000000
Timestamp of Event 4 (hours): 0
Power Cycle Event 4: 0
Flash LED Event 5:
Event Information: 0x0000000000000000
Timestamp of Event 5 (hours): 0
Power Cycle Event 5: 0
Flash LED Event 6:
Event Information: 0x0000000000000000
Timestamp of Event 6 (hours): 0
Power Cycle Event 6: 0
Flash LED Event 7:
Event Information: 0x0000000000000000
Timestamp of Event 7 (hours): 0
Power Cycle Event 7: 0
Uncorrectable errors: 0
Cumulative Lifetime Unrecoverable Read errors due to ERC: 0
Cum Lifetime Unrecoverable by head 0:
Cumulative Lifetime Unrecoverable Read Repeating: 0
Cumulative Lifetime Unrecoverable Read Unique: 0
Cum Lifetime Unrecoverable by head 1:
Cumulative Lifetime Unrecoverable Read Repeating: 0
Cumulative Lifetime Unrecoverable Read Unique: 0
Cum Lifetime Unrecoverable by head 2:
Cumulative Lifetime Unrecoverable Read Repeating: 0
Cumulative Lifetime Unrecoverable Read Unique: 0
Cum Lifetime Unrecoverable by head 3:
Cumulative Lifetime Unrecoverable Read Repeating: 0
Cumulative Lifetime Unrecoverable Read Unique: 0
Cum Lifetime Unrecoverable by head 4:
Cumulative Lifetime Unrecoverable Read Repeating: 0
Cumulative Lifetime Unrecoverable Read Unique: 0
Cum Lifetime Unrecoverable by head 5:
Cumulative Lifetime Unrecoverable Read Repeating: 0
Cumulative Lifetime Unrecoverable Read Unique: 0
Cum Lifetime Unrecoverable by head 6:
Cumulative Lifetime Unrecoverable Read Repeating: 0
Cumulative Lifetime Unrecoverable Read Unique: 0
Cum Lifetime Unrecoverable by head 7:
Cumulative Lifetime Unrecoverable Read Repeating: 0
Cumulative Lifetime Unrecoverable Read Unique: 0
Cum Lifetime Unrecoverable by head 8:
Cumulative Lifetime Unrecoverable Read Repeating: 0
Cumulative Lifetime Unrecoverable Read Unique: 0
Cum Lifetime Unrecoverable by head 9:
Cumulative Lifetime Unrecoverable Read Repeating: 0
Cumulative Lifetime Unrecoverable Read Unique: 0
FARM Log Page 4: Environment Statistics
Current Temperature (Celsius): 41
Highest Temperature: 67
Lowest Temperature: 28
Average Short Term Temperature: 40
Average Long Term Temperature: 40
Highest Average Short Term Temperature: 55
Lowest Average Short Term Temperature: 37
Highest Average Long Term Temperature: 51
Lowest Average Long Term Temperature: 40
Time In Over Temperature (minutes): 0
Time In Under Temperature (minutes): 0
Specified Max Operating Temperature: 70
Specified Min Operating Temperature: 5
Current Relative Humidity: 0
Current Motor Power: 6064
Current 12 volts: 12.070
Minimum 12 volts: 11.992
Maximum 12 volts: 12.141
Current 5 volts: 4.821
Minimum 5 volts: 4.710
Maximum 5 volts: 4.935
12V Power Average: 0.000
12V Power Minimum: 0.000
12V Power Maximum: 0.000
5V Power Average: 0.000
5V Power Minimum: 0.000
5V Power Maximum: 0.000
FARM Log Page 5: Reliability Statistics
Error Rate (SMART Attribute 1 Raw): 0x00000000004a7880
Error Rate (SMART Attribute 1 Normalized): 67
Error Rate (SMART Attribute 1 Worst): 64
Seek Error Rate (SMART Attr 7 Raw): 0x000000001510b4f0
Seek Error Rate (SMART Attr 7 Normalized): 85
Seek Error Rate (SMART Attr 7 Worst): 60
High Priority Unload Events: 57
Helium Pressure Threshold Tripped: 0
LBAs Corrected By Parity Sector: 0
DVGA Skip Write Detect by Head 0: 0
DVGA Skip Write Detect by Head 1: 0
DVGA Skip Write Detect by Head 2: 0
DVGA Skip Write Detect by Head 3: 0
DVGA Skip Write Detect by Head 4: 0
DVGA Skip Write Detect by Head 5: 0
DVGA Skip Write Detect by Head 6: 0
DVGA Skip Write Detect by Head 7: 0
DVGA Skip Write Detect by Head 8: 0
DVGA Skip Write Detect by Head 9: 0
RVGA Skip Write Detect by Head 0: 0
RVGA Skip Write Detect by Head 1: 0
RVGA Skip Write Detect by Head 2: 0
RVGA Skip Write Detect by Head 3: 0
RVGA Skip Write Detect by Head 4: 0
RVGA Skip Write Detect by Head 5: 0
RVGA Skip Write Detect by Head 6: 0
RVGA Skip Write Detect by Head 7: 0
RVGA Skip Write Detect by Head 8: 0
RVGA Skip Write Detect by Head 9: 0
FVGA Skip Write Detect by Head 0: 0
FVGA Skip Write Detect by Head 1: 0
FVGA Skip Write Detect by Head 2: 0
FVGA Skip Write Detect by Head 3: 0
FVGA Skip Write Detect by Head 4: 0
FVGA Skip Write Detect by Head 5: 0
FVGA Skip Write Detect by Head 6: 0
FVGA Skip Write Detect by Head 7: 0
FVGA Skip Write Detect by Head 8: 0
FVGA Skip Write Detect by Head 9: 0
Skip Write Detect Threshold Exceeded by Head 0: 0
Skip Write Detect Threshold Exceeded by Head 1: 0
Skip Write Detect Threshold Exceeded by Head 2: 0
Skip Write Detect Threshold Exceeded by Head 3: 0
Skip Write Detect Threshold Exceeded by Head 4: 0
Skip Write Detect Threshold Exceeded by Head 5: 0
Skip Write Detect Threshold Exceeded by Head 6: 0
Skip Write Detect Threshold Exceeded by Head 7: 0
Skip Write Detect Threshold Exceeded by Head 8: 0
Skip Write Detect Threshold Exceeded by Head 9: 0
Write Power On (hrs) by Head 0: 184223
Write Power On (hrs) by Head 1: 175921
Write Power On (hrs) by Head 2: 221545
Write Power On (hrs) by Head 3: 174641
Write Power On (hrs) by Head 4: 180510
Write Power On (hrs) by Head 5: 196650
Write Power On (hrs) by Head 6: 184761
Write Power On (hrs) by Head 7: 195088
Write Power On (hrs) by Head 8: 183397
Write Power On (hrs) by Head 9: 191659
MR Head Resistance from Head 0: 0
MR Head Resistance from Head 1: 0
MR Head Resistance from Head 2: 0
MR Head Resistance from Head 3: 0
MR Head Resistance from Head 4: 0
MR Head Resistance from Head 5: 0
MR Head Resistance from Head 6: 0
MR Head Resistance from Head 7: 0
MR Head Resistance from Head 8: 0
MR Head Resistance from Head 9: 0
Second MR Head Resistance by Head 0: 0
Second MR Head Resistance by Head 1: 0
Second MR Head Resistance by Head 2: 0
Second MR Head Resistance by Head 3: 0
Second MR Head Resistance by Head 4: 0
Second MR Head Resistance by Head 5: 0
Second MR Head Resistance by Head 6: 0
Second MR Head Resistance by Head 7: 0
Second MR Head Resistance by Head 8: 0
Second MR Head Resistance by Head 9: 0
Number of Reallocated Sectors by Head 0: 0
Number of Reallocated Sectors by Head 1: 0
Number of Reallocated Sectors by Head 2: 0
Number of Reallocated Sectors by Head 3: 0
Number of Reallocated Sectors by Head 4: 0
Number of Reallocated Sectors by Head 5: 0
Number of Reallocated Sectors by Head 6: 0
Number of Reallocated Sectors by Head 7: 0
Number of Reallocated Sectors by Head 8: 0
Number of Reallocated Sectors by Head 9: 0
Number of Reallocation Candidate Sectors by Head 0: 0
Number of Reallocation Candidate Sectors by Head 1: 0
Number of Reallocation Candidate Sectors by Head 2: 0
Number of Reallocation Candidate Sectors by Head 3: 0
Number of Reallocation Candidate Sectors by Head 4: 0
Number of Reallocation Candidate Sectors by Head 5: 0
Number of Reallocation Candidate Sectors by Head 6: 0
Number of Reallocation Candidate Sectors by Head 7: 0
Number of Reallocation Candidate Sectors by Head 8: 0
Number of Reallocation Candidate Sectors by Head 9: 0

admin@elNas[~]$

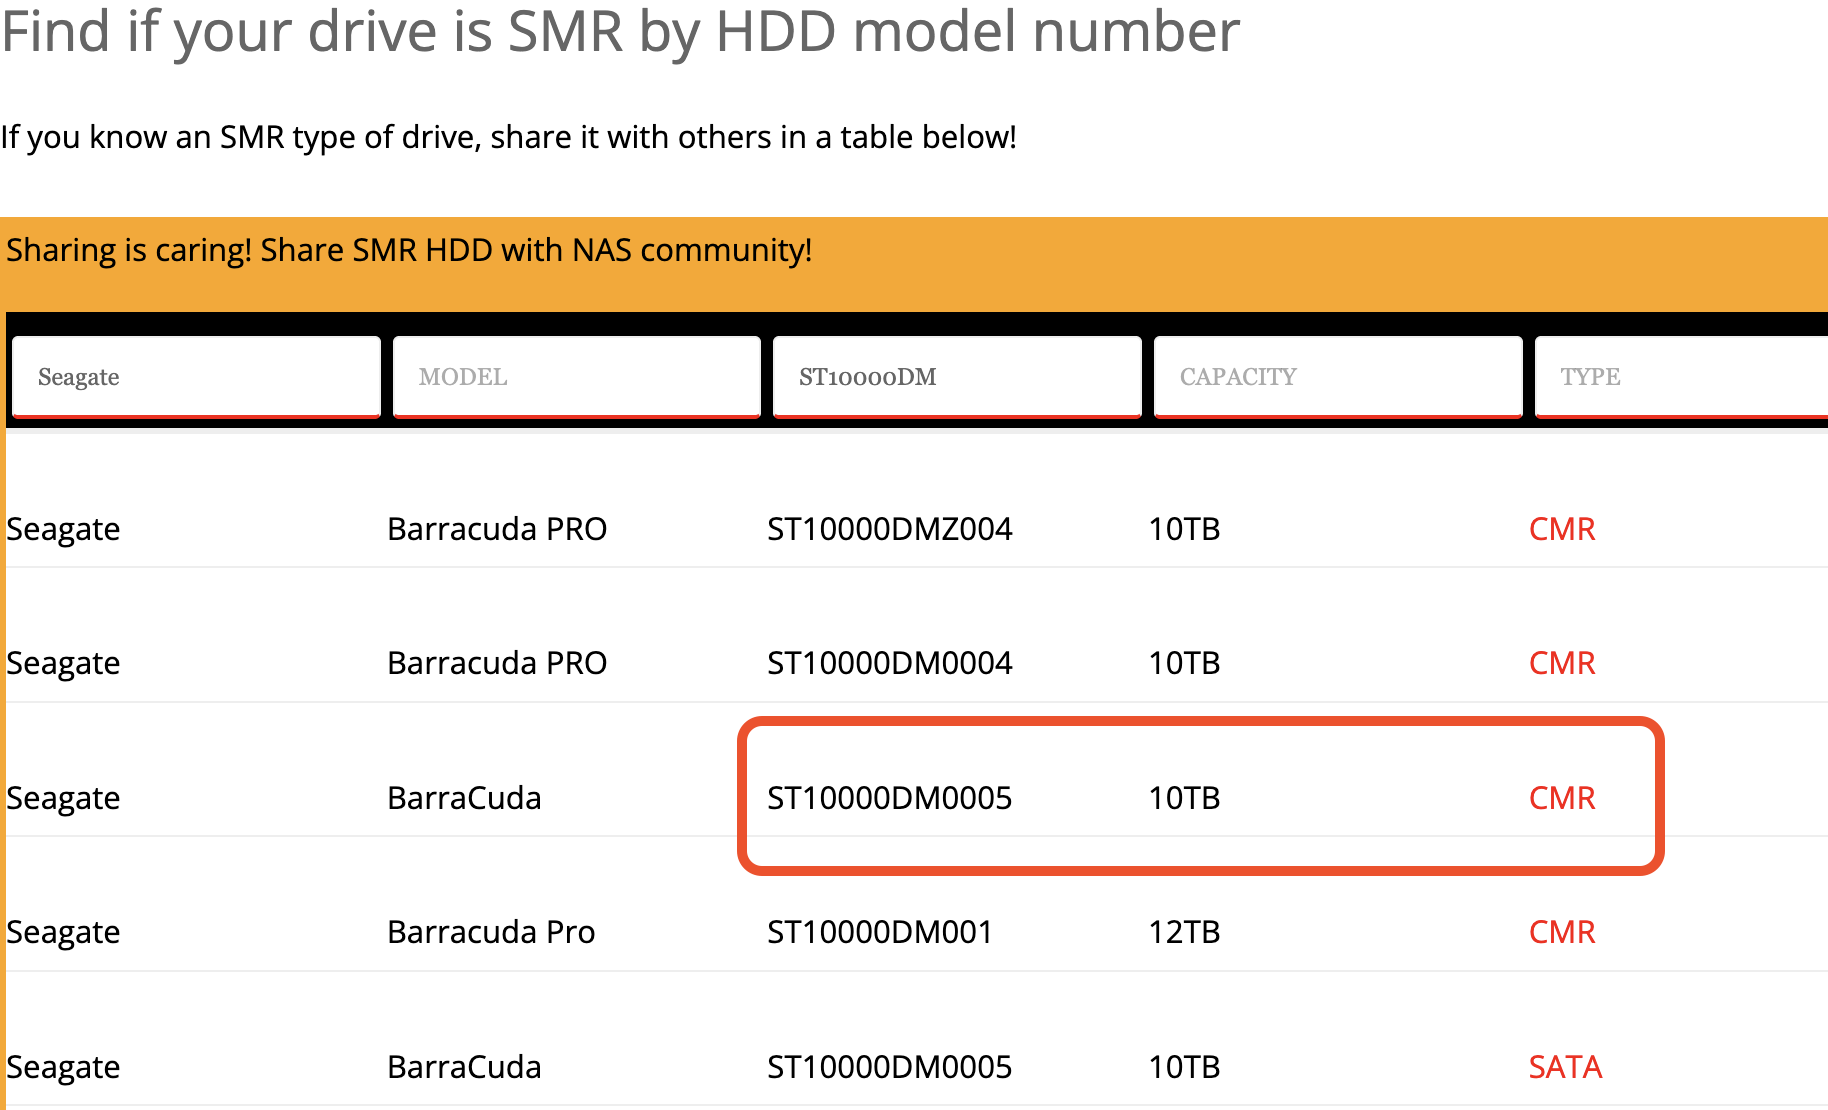
the two faulty HDDs replaced here was 2 x ST10000NM0046 [Seagate Enterprise 10TB SATA 7200rpm Helium SED], surprizingly not of the consumer type ones


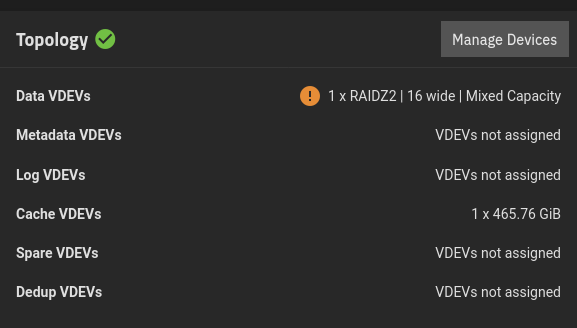
Just a note, I need a lotsa room in the NAS to keep backups and such stuff, so I think it will size up to a PB later :slight_smile:
BTW as I don’t have lotsa money to spare for disks I take what I can find not too pricey, and it are damn’ pricey
 I’ve built it in early 2021, took me 4 years to get 16 HDD in it :frowning: and I’m already short on room, arg.

the plan is another build with one/two Fractal Design Define 7XL and 22 Tib (20 REAL TB) disks, just waiting those guys to drop in price :wink:

So it is CMR


1 Like

You’re getting the units wrong. 22 TB is about 20 TiB, and there’s no thievery there.
tibi (Ti) = 2^40 = 1024 gibi (Gi)
tera (T) = 10^12 = 1000 giga (G)

Nope : That’s the industry that have false there : from the beginning 1 KiloByte have ever been 1024 Bytes, and 1 GigaByte ever been 1024 MegaBytes.

then the indusrty comes and found that ‘silly’ HDD sizes of 9.1 Gigabytes was not ‘cool’ for sales.
so they thunk of a trick : why could’nt we make the GigaByte=1000 MegaBytes instead of the reality that is 1 GygaByte IS 1024 MegaBytes ? cool no ? let’s do that!

and pushing NEW 9.1 TeraBytes disks sold AS 10 TeraBytes ones (and so for the price of 10 TB
) and so on, while pushing for the acceptance that these false TeraByte of 1000 GygaBytes (not 1024 as it should) was the REAL one TB and that the former real one was a false one that needed to be called TiB instead
 and so on.

all HDD plant applauded and pushed too in this. and after some times that became the reality and the norme.

BTW , I’ve looked at the Smart tests of the ‘bad disks’ I’ve just replaced (remember the ones that has near 1700 ‘unrecoverable errors’ and smart says that it are all good


look at it :slight_smile:

20250224_SmartReport_ZA23C8KF

Gestionnaire de partitions de KDE : rapport d’état SMART
Date : 24/02/2025 23:32
Version de programme : 22.12.3
Moteur : pmsfdiskbackendplugin (1)
Version de KDE Frameworks : 5.103.0
Machine : Linux voxdeb 6.1.0-31-amd64 #1 SMP PREEMPT_DYNAMIC Debian 6.1.128-1 (2025-02-07) x86_64

État SMART : bon
ModĂšle : ST10000NM0046
Numéro de série : ZA23C8KF
Révision du micro-logiciel : G00A
Température : 42° C / 108° F
Secteurs défectueux : aucun
En fonctionnement depuis : 213 jours et 19 heures
Cycles d’alimentation : 9 436
Auto tests : Réussi
Évaluation globale : Sain

1 Taux d’erreurs de lecture
Taux d’erreurs matĂ©rielles lors de la lecture de donnĂ©es Ă  partir de la surface du disque. PrĂ©dĂ©faillance ConnectĂ© 64 80 44 0x000005c10eb7 bon 96 538 295
3 Temps moyen de mise en rotation
Temps moyen de mise en rotation, de zĂ©ro tour par minute jusqu’au fonctionnement complet. PrĂ©dĂ©faillance ConnectĂ© 91 94 0 0x000000000000 N / A N / A
4 Nombre de dĂ©marrages / d’arrĂȘts
Un dĂ©compte des cycles de dĂ©marrage/d’arrĂȘt de rotation. Fin de vie ConnectĂ© 91 91 20 0x0000000024dc bon 9 436
5 Nombre de secteurs ré-alloués
Nombre de secteurs rĂ©-allouĂ©s. Lorsque le disque dur trouve une erreur de lecture/Ă©criture / vĂ©rification, il marque ce secteur comme “rĂ©-allouĂ©â€ et transfĂšre les donnĂ©es vers une zone rĂ©servĂ©e spĂ©ciale (zone de rĂ©serve). PrĂ©dĂ©faillance ConnectĂ© 100 100 10 0x000000000000 bon 0 secteur
7 Taux d’erreurs de positionnement des tĂȘtes
Taux d’erreurs de positionnement des tĂȘtes magnĂ©tiques. S’il y a une dĂ©faillance partielle dans le systĂšme de positionnement mĂ©canique, alors des erreurs de positionnement apparaĂźtront. PrĂ©dĂ©faillance ConnectĂ© 60 89 45 0x00002d7dcf4e bon 763 219 790
9 Nombre d’heures de fonctionnement
Nombre d’heures en Ă©tat de fonctionnement. Fin de vie ConnectĂ© 95 95 0 0x00000000140b N / A 213 jours et 19 heures
10 Nombre de relances de rotation
Nombre de relances de tentatives de rotation si la premiĂšre tentative a Ă©chouĂ©. Une augmentation de cette valeur d’attribut est signe de problĂšmes dans le sous-systĂšme mĂ©canique du disque dur. PrĂ©dĂ©faillance ConnectĂ© 100 100 97 0x000000000000 bon 0
12 Nombre de cycles de fonctionnement
Nombre de cycles marche / arrĂȘt complets du disque dur. Fin de vie ConnectĂ© 91 91 20 0x0000000024dc bon 9 436
184 Erreur de bout en bout
Composant de la technologie SMART IV de HP : aprĂšs le transfert via le tampon de donnĂ©es en mĂ©moire vive du cache, les donnĂ©es de paritĂ© entre l’hĂŽte et le disque dur ne correspondent pas. Fin de vie ConnectĂ© 100 100 99 0x000000000000 bon 0
187 Erreurs incorrigibles signalées
Nombre d’erreurs incorrigibles Ă  l’aide du code correcteur d’erreurs. Fin de vie ConnectĂ© 100 100 0 0x000000000000 N / A 0 secteur
188 Temps imparti Ă  la commande
Nombre d’opĂ©rations interrompues en raison d’un dĂ©passement de temps imparti au disque dur. Fin de vie ConnectĂ© 100 100 0 0x000000000000 N / A 0
189 Écritures hors de portĂ©e
Nombre d’erreurs de hauteur des tĂȘtes dĂ©tectĂ©es. Fin de vie ConnectĂ© 60 60 0 0x000000000028 N / A 40
190 Différence de température à partir de zéro
La valeur est Ă©gale Ă  (100 – temp. °C), ce qui permet au fabricant d’associer un seuil minimal correspondant Ă  une tempĂ©rature maximale. Fin de vie ConnectĂ© 53 58 40 0x00002a1a002a bon 42° C / 108° F
191 Taux d’erreurs dues à des chocs
Nombre d’erreurs rĂ©sultant de chocs et de vibrations externes. Fin de vie ConnectĂ© 97 97 0 0x000000001e65 N / A 7 781
192 Nombre de repositionnements des tĂȘtes suite Ă  une coupure d’alimentation
Nombre cycles de re-positionnements des tĂȘtes, d’urgence ou suite Ă  une coupure d’alimentation Fin de vie ConnectĂ© 96 96 0 0x000000002550 N / A 9 552
193 Nombre de cycles de chargement
Nombre de cycles de chargement / dĂ©chargement dans la position oĂč la tĂȘte est posĂ©e. Fin de vie ConnectĂ© 96 96 0 0x0000000025a7 N / A 9 639
194 Température
Température interne actuelle. Fin de vie Connecté 47 42 0 0x00130000002a N / A 42° C / 108° F
195 Temps entre les erreurs corrigées par ECC
Nombre d’erreurs pouvant ĂȘtre corrigĂ©es par code correcteur d’erreurs (ECC). Fin de vie ConnectĂ© 1 9 0 0x000005c10eb7 N / A 96 538 295
197 Nombre actuel de secteurs en attente de réallocation
Nombre de secteurs “instables” (en attente de rĂ©-allocation suite Ă  des erreurs). Fin de vie ConnectĂ© 100 100 0 0x000000000000 N / A 0 secteur
198 Nombre total d’erreurs incorrigibles
Nombre total d’erreurs incorrigibles lors de la lecture/l’écriture d’un secteur. Fin de vie DĂ©connectĂ© 100 100 0 0x000000000000 N / A 0 secteur
199 Nombre total d’erreurs de CRC UltraDMA
Nombre total d’erreurs au cours du transfert des donnĂ©es via le cĂąble d’interface comme dĂ©terminĂ© par l’ICRC. Fin de vie ConnectĂ© 200 200 0 0x000000000000 N / A 0
200 Taux d’erreurs multi-zones
Taux d’erreurs Ă  l’écriture d’un secteur
Le nombre total d’erreurs lors de l’écriture d’un secteur. PrĂ©dĂ©faillance ConnectĂ© 100 100 1 0x000000000000 bon 0
240 Nombre d’heures de survol des tĂȘtes (
ou Taux d’erreurs de transfert (Fujitsu)
Temps de positionnement de la tĂȘte
ou nombre de ré-initialisations de la liaison pendant un transfert de données. Fin de vie Déconnecté 253 100 0 0x6884000013cd N / A 211 jours et 5 heures
241 Nombre total de LBA écrits
Nombre total de LBA écrits Fin de vie Déconnecté 253 100 0 0x0018225bd460 N / A N / A
242 Nombre total de LBA lus
Nombre total de LBA lus Fin de vie Déconnecté 253 100 0 0x0056b328cfc5 N / A N / A

and the 2nd :slight_smile:

20250224_SmartReport_ZA23JG0Q

Gestionnaire de partitions de KDE : rapport d’état SMART
Date : 24/02/2025 23:43
Version de programme : 22.12.3
Moteur : pmsfdiskbackendplugin (1)
Version de KDE Frameworks : 5.103.0
Machine : Linux voxdeb 6.1.0-31-amd64 #1 SMP PREEMPT_DYNAMIC Debian 6.1.128-1 (2025-02-07) x86_64

État SMART : bon
ModĂšle : ST10000NM0046
Numéro de série : ZA23JG0Q
Révision du micro-logiciel : G00A
Température : 28° C / 82° F
Secteurs défectueux : aucun
En fonctionnement depuis : 216 jours
Cycles d’alimentation : 2 290
Auto tests : Réussi
Évaluation globale : Sain

1 Taux d’erreurs de lecture
Taux d’erreurs matĂ©rielles lors de la lecture de donnĂ©es Ă  partir de la surface du disque. PrĂ©dĂ©faillance ConnectĂ© 64 72 44 0x000000ed543b bon 15 553 595
3 Temps moyen de mise en rotation
Temps moyen de mise en rotation, de zĂ©ro tour par minute jusqu’au fonctionnement complet. PrĂ©dĂ©faillance ConnectĂ© 91 94 0 0x000000000000 N / A N / A
4 Nombre de dĂ©marrages / d’arrĂȘts
Un dĂ©compte des cycles de dĂ©marrage/d’arrĂȘt de rotation. Fin de vie ConnectĂ© 98 98 20 0x0000000008f2 bon 2 290
5 Nombre de secteurs ré-alloués
Nombre de secteurs rĂ©-allouĂ©s. Lorsque le disque dur trouve une erreur de lecture/Ă©criture / vĂ©rification, il marque ce secteur comme “rĂ©-allouĂ©â€ et transfĂšre les donnĂ©es vers une zone rĂ©servĂ©e spĂ©ciale (zone de rĂ©serve). PrĂ©dĂ©faillance ConnectĂ© 100 100 10 0x000000000000 bon 0 secteur
7 Taux d’erreurs de positionnement des tĂȘtes
Taux d’erreurs de positionnement des tĂȘtes magnĂ©tiques. S’il y a une dĂ©faillance partielle dans le systĂšme de positionnement mĂ©canique, alors des erreurs de positionnement apparaĂźtront. PrĂ©dĂ©faillance ConnectĂ© 60 89 45 0x00002eaf70df bon 783 249 631
9 Nombre d’heures de fonctionnement
Nombre d’heures en Ă©tat de fonctionnement. Fin de vie ConnectĂ© 95 95 0 0x000000001440 N / A 216 jours
10 Nombre de relances de rotation
Nombre de relances de tentatives de rotation si la premiĂšre tentative a Ă©chouĂ©. Une augmentation de cette valeur d’attribut est signe de problĂšmes dans le sous-systĂšme mĂ©canique du disque dur. PrĂ©dĂ©faillance ConnectĂ© 100 100 97 0x000000000000 bon 0
12 Nombre de cycles de fonctionnement
Nombre de cycles marche / arrĂȘt complets du disque dur. Fin de vie ConnectĂ© 98 98 20 0x0000000008f2 bon 2 290
184 Erreur de bout en bout
Composant de la technologie SMART IV de HP : aprĂšs le transfert via le tampon de donnĂ©es en mĂ©moire vive du cache, les donnĂ©es de paritĂ© entre l’hĂŽte et le disque dur ne correspondent pas. Fin de vie ConnectĂ© 100 100 99 0x000000000000 bon 0
187 Erreurs incorrigibles signalées
Nombre d’erreurs incorrigibles Ă  l’aide du code correcteur d’erreurs. Fin de vie ConnectĂ© 100 100 0 0x000000000000 N / A 0 secteur
188 Temps imparti Ă  la commande
Nombre d’opĂ©rations interrompues en raison d’un dĂ©passement de temps imparti au disque dur. Fin de vie ConnectĂ© 100 100 0 0x000000000000 N / A 0
189 Écritures hors de portĂ©e
Nombre d’erreurs de hauteur des tĂȘtes dĂ©tectĂ©es. Fin de vie ConnectĂ© 41 41 0 0x00000000003b N / A 59
190 Différence de température à partir de zéro
La valeur est Ă©gale Ă  (100 – temp. °C), ce qui permet au fabricant d’associer un seuil minimal correspondant Ă  une tempĂ©rature maximale. Fin de vie ConnectĂ© 51 72 40 0x00001c1b001c bon 28° C / 82° F
191 Taux d’erreurs dues à des chocs
Nombre d’erreurs rĂ©sultant de chocs et de vibrations externes. Fin de vie ConnectĂ© 97 97 0 0x0000000017a7 N / A 6 055
192 Nombre de repositionnements des tĂȘtes suite Ă  une coupure d’alimentation
Nombre cycles de re-positionnements des tĂȘtes, d’urgence ou suite Ă  une coupure d’alimentation Fin de vie ConnectĂ© 99 99 0 0x00000000096c N / A 2 412
193 Nombre de cycles de chargement
Nombre de cycles de chargement / dĂ©chargement dans la position oĂč la tĂȘte est posĂ©e. Fin de vie ConnectĂ© 99 99 0 0x0000000009be N / A 2 494
194 Température
Température interne actuelle. Fin de vie Connecté 49 28 0 0x00140000001c N / A 28° C / 82° F
195 Temps entre les erreurs corrigées par ECC
Nombre d’erreurs pouvant ĂȘtre corrigĂ©es par code correcteur d’erreurs (ECC). Fin de vie ConnectĂ© 2 9 0 0x000000ed543b N / A 15 553 595
197 Nombre actuel de secteurs en attente de réallocation
Nombre de secteurs “instables” (en attente de rĂ©-allocation suite Ă  des erreurs). Fin de vie ConnectĂ© 100 100 0 0x000000000000 N / A 0 secteur
198 Nombre total d’erreurs incorrigibles
Nombre total d’erreurs incorrigibles lors de la lecture/l’écriture d’un secteur. Fin de vie DĂ©connectĂ© 100 100 0 0x000000000000 N / A 0 secteur
199 Nombre total d’erreurs de CRC UltraDMA
Nombre total d’erreurs au cours du transfert des donnĂ©es via le cĂąble d’interface comme dĂ©terminĂ© par l’ICRC. Fin de vie ConnectĂ© 200 200 0 0x000000000000 N / A 0
200 Taux d’erreurs multi-zones
Taux d’erreurs Ă  l’écriture d’un secteur
Le nombre total d’erreurs lors de l’écriture d’un secteur. PrĂ©dĂ©faillance ConnectĂ© 100 100 1 0x000000000000 bon 0
240 Nombre d’heures de survol des tĂȘtes (
ou Taux d’erreurs de transfert (Fujitsu)
Temps de positionnement de la tĂȘte
ou nombre de ré-initialisations de la liaison pendant un transfert de données. Fin de vie Déconnecté 253 100 0 0x3fe00000141d N / A 214 jours et 13 heures
241 Nombre total de LBA écrits
Nombre total de LBA écrits Fin de vie Déconnecté 253 100 0 0x0016b51f7f58 N / A N / A
242 Nombre total de LBA lus
Nombre total de LBA lus Fin de vie Déconnecté 253 100 0 0x006284da65ce N / A N / A

What do you think ?

Ho, I forgot to say that, of the two ‘bad’ disks here, the Z23C8K8 one become way hotter than the other very fast, don’t know why as it are the same model


Historically, I believe this was a combination of a shortcut and later an SI vs IEC fight.

“kilo” has always meant 10^3, “mega” at 10^6, and so on. These prefixes were used as a shortcut in the early computing days because 2^10 was “close enough” to 1000 to represent it, but as capacities went from “kilo” to “mega” the skew got bigger. What used to be 24 bytes was now 48,576 - and it gets worse and worse as capacities get bigger to where we now see significant “chunks of space missing” from multi-terabyte drives.

The IEC created the “kibi” and “mebi” prefixes to accurately represent the 2^n values, but the 10^n SI ones are still baked in everyone’s mind.

Interestingly enough, communications standards (1gbps/10gbps/etc) use the SI prefixes correctly.

This has been today’s random thoughts, thanks for coming to my TED talk.

1 Like

Historically, I think you are correct in all that.

However, what is more interesting to me is the discrepancy. Why do hardware manufacturers (HDD, SSD, NIC, modems) use the SI units (kilo, mega), while OS’s (Linux, Windows, Unix, etc.) use the IEC units (kibi, mebi)?