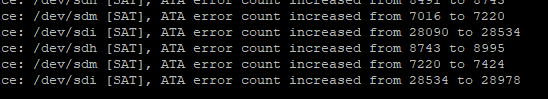
I am getting various alerts detailing a scattering of ATA error counts increasing. This could be from a number of things (drive going bad, bad STAT data cable, bad power to the HDD, motherboard controller issue). Any others?
Here is a dump from one of the drives. I currently have reports from 5 (out of 12) drives about ATA error counts increasing.
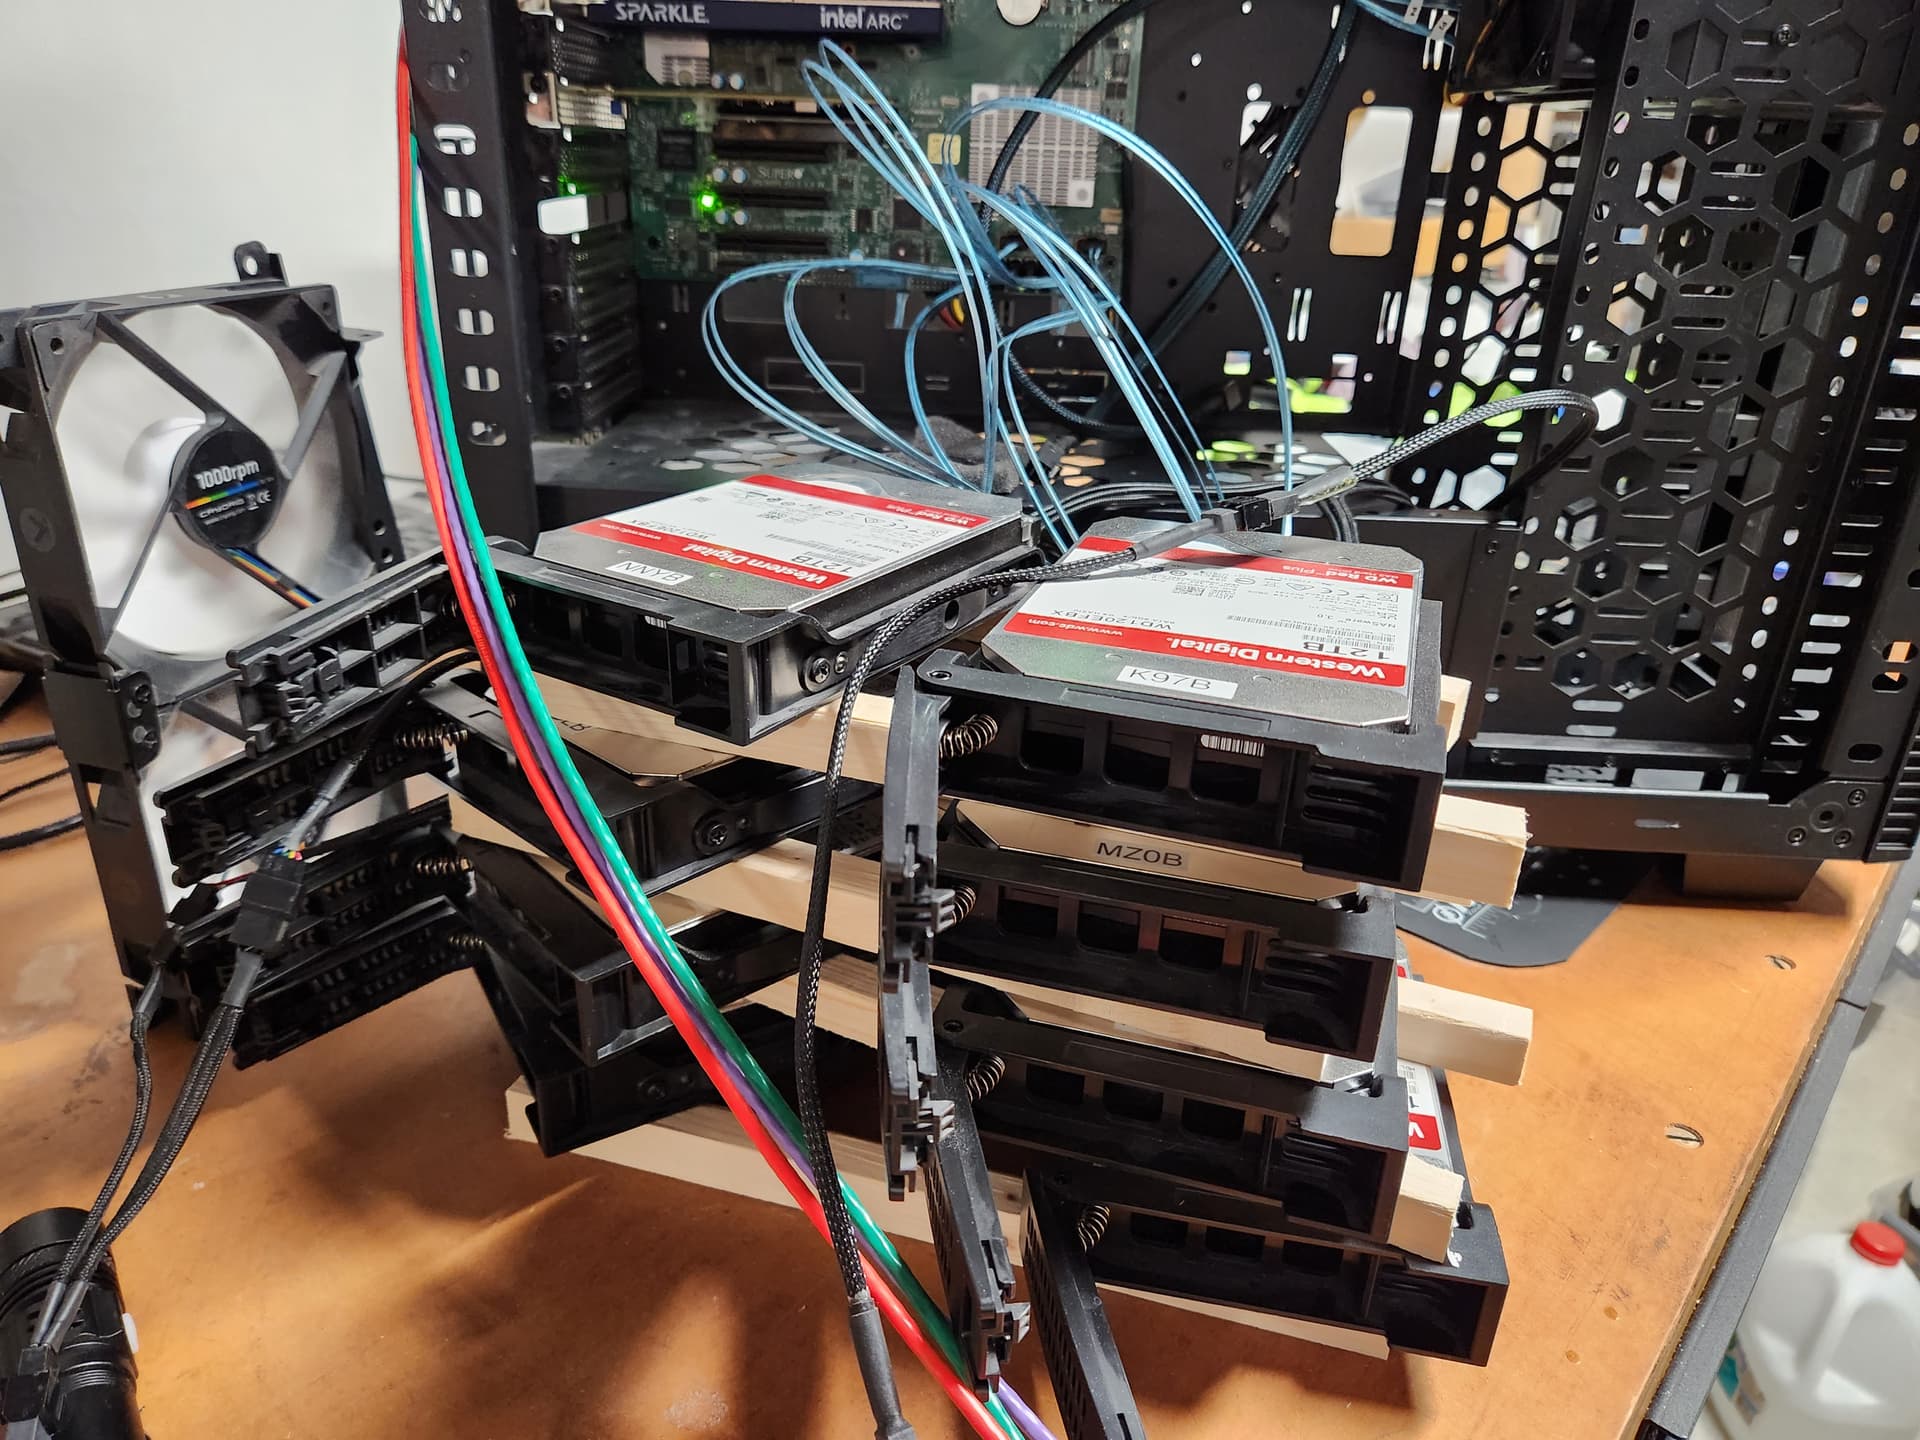
I have the drives are scattered across different HDD cages. Each cage has their own power supply. Two cages to got sata ports on the motherboard, the other two go to the LSI 9300-8i.
The drives throwing ATA errors are scattered across various cages.
%%%%%%%%%%%%%%%%%%%%%%%%
smartctrl for one drive
smartctl 7.4 2023-08-01 r5530 [x86_64-linux-6.6.44-production+truenas] (local build)
Copyright (C) 2002-23, Bruce Allen, Christian Franke, www.smartmontools.org

=== START OF INFORMATION SECTION ===
Model Family:     Western Digital Red Plus
Device Model:     WDC WD120EFBX-68B0EN0
Serial Number:    5QKWT3ZB
LU WWN Device Id: 5 000cca 2b0f6e71b
Firmware Version: 85.00A85
User Capacity:    12,000,138,625,024 bytes [12.0 TB]
Sector Sizes:     512 bytes logical, 4096 bytes physical
Rotation Rate:    7200 rpm
Form Factor:      3.5 inches
Device is:        In smartctl database 7.3/5706
ATA Version is:   ACS-2, ATA8-ACS T13/1699-D revision 4
SATA Version is:  SATA 3.2, 6.0 Gb/s (current: 6.0 Gb/s)
Local Time is:    Mon May 19 07:21:30 2025 EDT
SMART support is: Available - device has SMART capability.
SMART support is: Enabled
AAM feature is:   Unavailable
APM feature is:   Disabled
Rd look-ahead is: Enabled
Write cache is:   Enabled
DSN feature is:   Unavailable
ATA Security is:  Disabled, NOT FROZEN [SEC1]
Wt Cache Reorder: Enabled

=== START OF READ SMART DATA SECTION ===
SMART overall-health self-assessment test result: PASSED

General SMART Values:
Offline data collection status:  (0x82)	Offline data collection activity
					was completed without error.
					Auto Offline Data Collection: Enabled.
Self-test execution status:      (   0)	The previous self-test routine completed
					without error or no self-test has ever
					been run.
Total time to complete Offline
data collection: 		(   87) seconds.
Offline data collection
capabilities: 			 (0x5b) SMART execute Offline immediate.
					Auto Offline data collection on/off support.
					Suspend Offline collection upon new
					command.
					Offline surface scan supported.
					Self-test supported.
					No Conveyance Self-test supported.
					Selective Self-test supported.
SMART capabilities:            (0x0003)	Saves SMART data before entering
					power-saving mode.
					Supports SMART auto save timer.
Error logging capability:        (0x01)	Error logging supported.
					General Purpose Logging supported.
Short self-test routine
recommended polling time: 	 (   2) minutes.
Extended self-test routine
recommended polling time: 	 (1348) minutes.
SCT capabilities: 	       (0x003d)	SCT Status supported.
					SCT Error Recovery Control supported.
					SCT Feature Control supported.
					SCT Data Table supported.

SMART Attributes Data Structure revision number: 16
Vendor Specific SMART Attributes with Thresholds:
ID# ATTRIBUTE_NAME          FLAGS    VALUE WORST THRESH FAIL RAW_VALUE
  1 Raw_Read_Error_Rate     PO-R--   100   100   016    -    0
  2 Throughput_Performance  --S---   126   126   054    -    116
  3 Spin_Up_Time            POS---   218   218   024    -    329 (Average 274)
  4 Start_Stop_Count        -O--C-   100   100   000    -    90
  5 Reallocated_Sector_Ct   PO--CK   100   100   005    -    0
  7 Seek_Error_Rate         -O-R--   100   100   067    -    0
  8 Seek_Time_Performance   --S---   128   128   020    -    18
  9 Power_On_Hours          -O--C-   098   098   000    -    18845
 10 Spin_Retry_Count        -O--C-   100   100   060    -    0
 12 Power_Cycle_Count       -O--CK   100   100   000    -    90
 22 Helium_Level            PO---K   100   100   025    -    100
192 Power-Off_Retract_Count -O--CK   100   100   000    -    927
193 Load_Cycle_Count        -O--C-   100   100   000    -    927
194 Temperature_Celsius     -O----   216   216   000    -    30 (Min/Max 11/39)
196 Reallocated_Event_Count -O--CK   100   100   000    -    0
197 Current_Pending_Sector  -O---K   100   100   000    -    0
198 Offline_Uncorrectable   ---R--   100   100   000    -    0
199 UDMA_CRC_Error_Count    -O-R--   200   200   000    -    0
                            ||||||_ K auto-keep
                            |||||__ C event count
                            ||||___ R error rate
                            |||____ S speed/performance
                            ||_____ O updated online
                            |______ P prefailure warning

General Purpose Log Directory Version 1
SMART           Log Directory Version 1 [multi-sector log support]
Address    Access  R/W   Size  Description
0x00       GPL,SL  R/O      1  Log Directory
0x01           SL  R/O      1  Summary SMART error log
0x02           SL  R/O      1  Comprehensive SMART error log
0x03       GPL     R/O      1  Ext. Comprehensive SMART error log
0x04       GPL     R/O    256  Device Statistics log
0x04       SL      R/O    255  Device Statistics log
0x06           SL  R/O      1  SMART self-test log
0x07       GPL     R/O      1  Extended self-test log
0x08       GPL     R/O      2  Power Conditions log
0x09           SL  R/W      1  Selective self-test log
0x0c       GPL     R/O   5501  Pending Defects log
0x10       GPL     R/O      1  NCQ Command Error log
0x11       GPL     R/O      1  SATA Phy Event Counters log
0x12       GPL     R/O      1  SATA NCQ Non-Data log
0x13       GPL     R/O      1  SATA NCQ Send and Receive log
0x15       GPL     R/W      1  Rebuild Assist log
0x21       GPL     R/O      1  Write stream error log
0x22       GPL     R/O      1  Read stream error log
0x24       GPL     R/O    256  Current Device Internal Status Data log
0x25       GPL     R/O    256  Saved Device Internal Status Data log
0x30       GPL,SL  R/O      9  IDENTIFY DEVICE data log
0x80-0x9f  GPL,SL  R/W     16  Host vendor specific log
0xe0       GPL,SL  R/W      1  SCT Command/Status
0xe1       GPL,SL  R/W      1  SCT Data Transfer

SMART Extended Comprehensive Error Log Version: 1 (1 sectors)
No Errors Logged

SMART Extended Self-test Log Version: 1 (1 sectors)
Num  Test_Description    Status                  Remaining  LifeTime(hours)  LBA_of_first_error
# 1  Short offline       Completed without error       00%     18838         -
# 2  Short offline       Completed without error       00%     18814         -
# 3  Short offline       Completed without error       00%     18790         -
# 4  Short offline       Completed without error       00%     18766         -
# 5  Extended offline    Completed without error       00%     18715         -
# 6  Short offline       Completed without error       00%     18694         -
# 7  Short offline       Completed without error       00%     18670         -
# 8  Short offline       Completed without error       00%     18646         -
# 9  Short offline       Completed without error       00%     18622         -
#10  Short offline       Completed without error       00%     18598         -
#11  Short offline       Completed without error       00%     18574         -
#12  Short offline       Completed without error       00%     18550         -
#13  Short offline       Completed without error       00%     18526         -
#14  Short offline       Completed without error       00%     18502         -
#15  Short offline       Completed without error       00%     18480         -
#16  Short offline       Completed without error       00%     18462         -
#17  Short offline       Completed without error       00%     18438         -
#18  Short offline       Completed without error       00%     18414         -
#19  Short offline       Completed without error       00%     18390         -

SMART Selective self-test log data structure revision number 1
 SPAN  MIN_LBA  MAX_LBA  CURRENT_TEST_STATUS
    1        0        0  Not_testing
    2        0        0  Not_testing
    3        0        0  Not_testing
    4        0        0  Not_testing
    5        0        0  Not_testing
Selective self-test flags (0x0):
  After scanning selected spans, do NOT read-scan remainder of disk.
If Selective self-test is pending on power-up, resume after 0 minute delay.

SCT Status Version:                  3
SCT Version (vendor specific):       256 (0x0100)
Device State:                        Active (0)
Current Temperature:                    30 Celsius
Power Cycle Min/Max Temperature:     30/31 Celsius
Lifetime    Min/Max Temperature:     11/39 Celsius
Under/Over Temperature Limit Count:   0/0

SCT Temperature History Version:     2
Temperature Sampling Period:         1 minute
Temperature Logging Interval:        1 minute
Min/Max recommended Temperature:      0/65 Celsius
Min/Max Temperature Limit:           -40/70 Celsius
Temperature History Size (Index):    128 (116)

Index    Estimated Time   Temperature Celsius
 117    2025-05-19 05:14    30  ***********
 ...    ..(126 skipped).    ..  ***********
 116    2025-05-19 07:21    30  ***********

SCT Error Recovery Control:
           Read:     70 (7.0 seconds)
          Write:     70 (7.0 seconds)

Device Statistics (GP Log 0x04)
Page  Offset Size        Value Flags Description
0x01  =====  =               =  ===  == General Statistics (rev 1) ==
0x01  0x008  4              90  ---  Lifetime Power-On Resets
0x01  0x010  4           18845  ---  Power-on Hours
0x01  0x018  6    209424434260  ---  Logical Sectors Written
0x01  0x020  6      1210275338  ---  Number of Write Commands
0x01  0x028  6    309423797564  ---  Logical Sectors Read
0x01  0x030  6      1688080855  ---  Number of Read Commands
0x01  0x038  6     67842461800  ---  Date and Time TimeStamp
0x03  =====  =               =  ===  == Rotating Media Statistics (rev 1) ==
0x03  0x008  4           18677  ---  Spindle Motor Power-on Hours
0x03  0x010  4           18677  ---  Head Flying Hours
0x03  0x018  4             927  ---  Head Load Events
0x03  0x020  4               0  ---  Number of Reallocated Logical Sectors
0x03  0x028  4               0  ---  Read Recovery Attempts
0x03  0x030  4               0  ---  Number of Mechanical Start Failures
0x04  =====  =               =  ===  == General Errors Statistics (rev 1) ==
0x04  0x008  4               0  ---  Number of Reported Uncorrectable Errors
0x04  0x010  4               0  ---  Resets Between Cmd Acceptance and Completion
0x05  =====  =               =  ===  == Temperature Statistics (rev 1) ==
0x05  0x008  1              30  ---  Current Temperature
0x05  0x010  1              30  N--  Average Short Term Temperature
0x05  0x018  1              31  N--  Average Long Term Temperature
0x05  0x020  1              39  ---  Highest Temperature
0x05  0x028  1              11  ---  Lowest Temperature
0x05  0x030  1              38  N--  Highest Average Short Term Temperature
0x05  0x038  1              17  N--  Lowest Average Short Term Temperature
0x05  0x040  1              35  N--  Highest Average Long Term Temperature
0x05  0x048  1              25  N--  Lowest Average Long Term Temperature
0x05  0x050  4               0  ---  Time in Over-Temperature
0x05  0x058  1              65  ---  Specified Maximum Operating Temperature
0x05  0x060  4               0  ---  Time in Under-Temperature
0x05  0x068  1               0  ---  Specified Minimum Operating Temperature
0x06  =====  =               =  ===  == Transport Statistics (rev 1) ==
0x06  0x008  4             326  ---  Number of Hardware Resets
0x06  0x010  4              79  ---  Number of ASR Events
0x06  0x018  4               0  ---  Number of Interface CRC Errors
0xff  =====  =               =  ===  == Vendor Specific Statistics (rev 1) ==
0xff  0x040  7           20560  ---  Vendor Specific
0xff  0x048  7             115  ---  Vendor Specific
0xff  0x050  7               0  ---  Vendor Specific
0xff  0x058  7               0  ---  Vendor Specific
0xff  0x060  7               0  ---  Vendor Specific
0xff  0x068  7               0  ---  Vendor Specific
0xff  0x070  7             791  ---  Vendor Specific
0xff  0x078  7               0  ---  Vendor Specific
0xff  0x080  7              20  ---  Vendor Specific
                                |||_ C monitored condition met
                                ||__ D supports DSN
                                |___ N normalized value

Pending Defects log (GP Log 0x0c)
No Defects Logged

SATA Phy Event Counters (GP Log 0x11)
ID      Size     Value  Description
0x0001  2            0  Command failed due to ICRC error
0x0002  2            0  R_ERR response for data FIS
0x0003  2            0  R_ERR response for device-to-host data FIS
0x0004  2            0  R_ERR response for host-to-device data FIS
0x0005  2            0  R_ERR response for non-data FIS
0x0006  2            0  R_ERR response for device-to-host non-data FIS
0x0007  2            0  R_ERR response for host-to-device non-data FIS
0x0008  2            0  Device-to-host non-data FIS retries
0x0009  2            8  Transition from drive PhyRdy to drive PhyNRdy
0x000a  2            8  Device-to-host register FISes sent due to a COMRESET
0x000b  2            0  CRC errors within host-to-device FIS
0x000d  2            0  Non-CRC errors within host-to-device FIS
%%%%%%%%%%%%%%%%%%%%%%%%
Where to from here?