Unfortunately IMO most of the stats you posted can’t tell us anything meaningful.
The NICs running at 100-150kb/s probably tells us that the network is not the bottleneck and so we should look at storage.
htop doesn’t tell us much because it doesn’t tell us which NVMes or HDDs are contributing to the disk i/o so we have no idea whether it is L2ARC hits or misses.
The “cache load” (zpool status) tells us only how much data has accumulated in L2ARC over time, and nothing about how frequently it is being used. There are much better graphs in TrueNAS and Netdata to tell us about ARC and L2ARC useage.
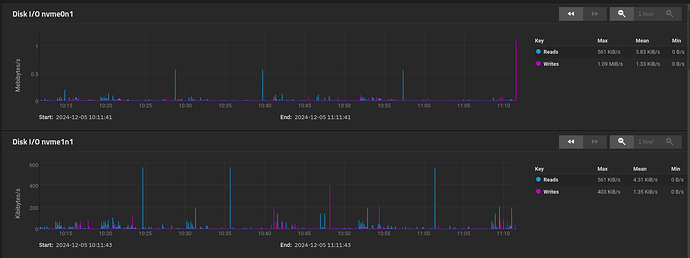
The NVMe usage graphs don’t tell us much because there is nothing that says what PBS actions were running at e.g. the peaks. It does show that ZFS is striping things roughly evenly, but that’s about it. BUT… In particular it does not show how much memory L2ARC is taking away from ARC, and so no way to assess whether L2ARC is being of any benefit. However, with only 9GB of data held in L2ARC, my guess is that it isn’t going to be benefitting you much and the detriment to standard ARC might outweigh the benefits.
My guess is also that L2ARC is not the cause of this Garbage Collection issue.
My advice would be to remove L2ARC from the SCALE servers for the moment so that we can see if that helps, and to simplify the configuration to aid with diagnostic analysis.
It would also help to see copies of all the TrueNAS and Netdata graphs from both SCALE and CORE that relate to ARC usage so that we can see whether we can assess the positive or negative impact of L2ARC.
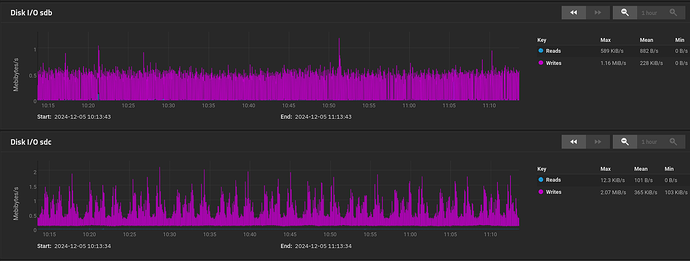
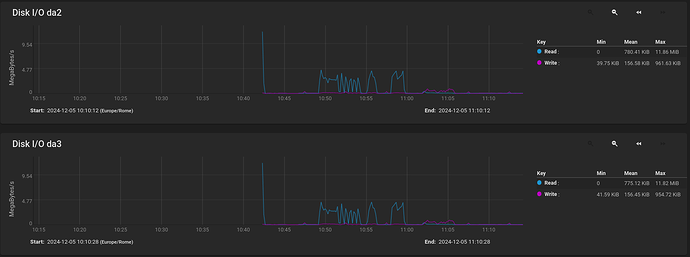
The graphs which do give rise to concern are the CORE vs SCALE HDD utilisation where these are VERY different. The SCALE graphs are showing a background utilisation of 0.5MB/s per disk in the vDev, so c. 3.5MB/s overall - and it seems reasonable to assume that this is attributable to the PBS garbage collection. Unfortunately I have no idea where on the CORE graphs garbage collection is happening to compare the disk utilisations for the same processing. In essence we are unable to determine whether the Disk I/O is slowing down the PBS Garbage Collection to a snails pace, or whether something else is doing this and causing the same level of background I/O to occur for much much longer.
And finally, we come to synchronous vs. asynchronous I/O. Firstly we have an issue of PBS speed here so clearly I/O performance for PBS does matter. It is entirely possible that Garbage Collection is somehow being slowed down by synchronous I/O, especially since you don’t have an SLOG.
It is also unclear whether the potential loss of data during an o/s crash actually has any meaning in the context of PBS backups. This is NOT a transactional system where zero data loss is essential for business integrity, or a zVolume where there is another guest file system that needs ZFS to guarantee its integrity. And it is perfectly feasible that SCALE has worse synchronous I/O than CORE or indeed that SCALE and CORE somehow differ as to whether they are using async i/o or not or possibly there is a difference about how ZFS on SCALE and CORE process file deletes. I suspect that garbage collection is actually a large bunch of very small I/Os (low network utilisation) that do quite a lot of disk I/O under the covers rewriting a bunch of metadata to remove the files and to return the files blocks to available storage, and that this is a wildly different pattern of network and disk I/O to writes of large files during streaming backups. I have no idea why CORE and SCALE would handle this differently in general or differently when using synchronous I/O, but this seems to me definitely something that should be tested.
I therefore recommend 3 actions here:
-
Undertake technical research as to whether using async I/O with PBS represents a genuine data integrity risk. What do the experts say?
-
Regardless of 1., for a trial period set the ZFS datasets so that writes are asynchronous and see if that makes a difference.
-
After you have removed the L2ARC NVMes temporarily to see what happens and measured the results, and before you set async writes for the datasets, try using these same drives as a temporary SLOG mirror on the pool and see what impact this has.
Hopefully, with these additional tests (no L2ARC, SLOG, async writes) we can try to narrow down the cause.
P.S. As a fairly minor aside that has literally nothing to do with this issue and is probably not worth changing now that the pool exists, I would personally say that for future pools which are e.g. 6x 10TB useable, then an 8x RAIDZ2 would be generally recommended as preferable to a 7x RAIDZ1 due to the size and width of the vDev, the time required for resilvering and the risk that a 2nd drive fails during the stress of resilvering the first. Of course, this is a backup server, and so the data is a backup and not primary, so in this instance, you may well have considered this risk to be perfectly acceptable when it wouldn’t be if this were primary data.


