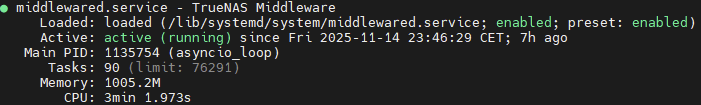
I booted into 25.04.02 again two days ago with my VMs provisioned as usual (I dont use apps) with 6GB, 6GB, and 1GB. After boot with VMs running this was my dashboard. I ran a music scan from Airsonic in the VM and everything was fine. I did the same from a networked PC over SMB and the RAM dropped as low as 0.4, but it eventually completed thet ask.
This morning I woke up to some of my services dead. I couldn’t even login via the web UI, so I had to go to the machine itself. The console was live and appeared to be fine, but I had to reboot to get the UI back online. From there, I started checking logs, and at 1AM the system freaked out with OOM issues.
The system experienced a cascade of severe Out-Of-Memory (OOM) failures, beginning at approximately Nov 9 01:00:28.
The core issue is a critical and sustained lack of available system memory, leading the Linux kernel's OOM killer to forcefully terminate multiple running processes.
🛑 Key Issues Identified
1. Massive Memory Consumption by a Protected Process (The Root Cause)
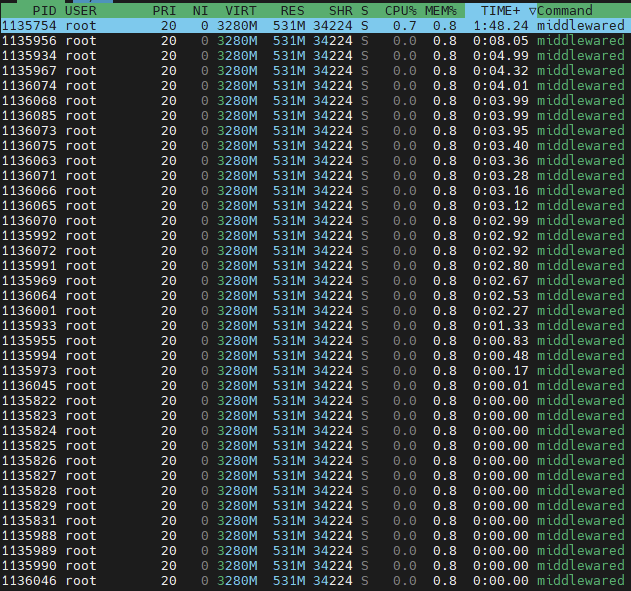
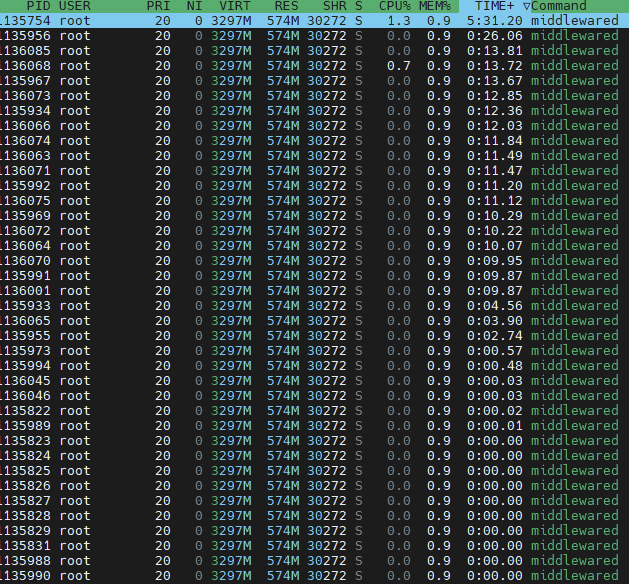
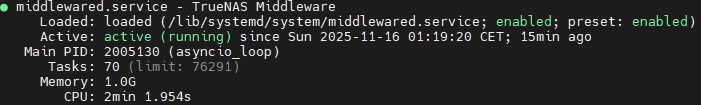
The central problem is the asyncio_loop thread/process (PID 1630), which is part of the critical TrueNAS service, middlewared. This process experienced severe memory growth, monopolizing the system's physical RAM:
At the time of the first OOM invocation (01:00:28), the process was consuming approximately 4.8GB of Resident Set Size (RSS).
By 01:01:54 (the specific log line you provided), its consumption ballooned to 7,476,807 pages, equivalent to approximately 30GB of physical RAM.
The log shows this process has an oom_score_adj of -1000. This value protects the process from being killed by the OOM killer, forcing the kernel to target less critical applications instead.
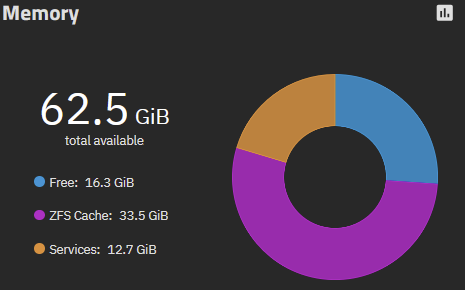
The core problem is that the middlewared/asyncio_loop process has a memory leak or excessive, uncontrolled memory usage, which is consuming nearly all of the system's ~33.5GB of RAM. The configuration protects this process, forcing the kernel to kill other applications (like the VM and syslog-ng) as collateral damage. The issue is compounded by having no configured swap space.
This never happened to me running 24, but there are several threads regarding ‘asyncio’ blowing things up in 25. I don’t have swap on my boot pools, but plenty of space, could this be mitigated by adding swap to the boot pool?
Memory leak middlewared/asyncio_loop process has a memory leak or excessive, uncontrolled memory usage
and The issue is compounded by having no configured swap space.
There is probably some process being handled by the asyncio_loop that is behaving badly as the loop is said to be designed more for efficiency not robustness.
It’s why a restart of the middlewared service temporarily alleviates the issue.
Indeed. The question is, why does this only happen on 25? That’s a confirm as I’ve tested both and 25 consistently has these issues while 24 does not. These issues consistently show up within 48 hours of the system being up with 25, whereas they never occur with 24.
It appears that the issue began 28 seconds after 01:00 am, leading me to wonder whether there might be a scheduled or regular task that starts at 1:00 that is being mis-handled in this version relative to how it was handled in the prior version? Perhaps a backup, SMART scan, snapshot, etc…
At least in my case it’s neither a snapshot nor replication task. I actually have the feeling the GUI is involved. I will let the system run without logging into the GUI for a while to check.
and now let’s restart middlewared, click around in the GUI for 10 minutes, just going through the settings without actually changing stuff, log out again and wait another 5 minutes:
And suddenly you have +10% CPU usage and about the same RAM usage as if the system would have been running for 24h without touching the GUI.
Oh well, opened a ticket - got closed without even any comment and pointing me to the board to seek assistance - you are joking, right ? So obviously that’s not a bug but a feature and not even worth looking into. Ok then - lets fall back to restarting middlewared each time i used the gui or just do a daily restart via cron - impact solved, problem still existing and probably the one and only bug report i ever filed, as it seems to be pretty much a waste of time…
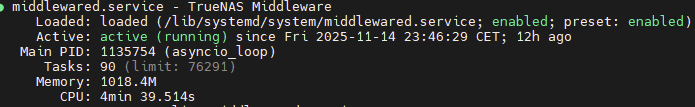
I am back with more research on this topic. My system has now been live on 25.04.02 for 6 days 47 minutes running normally. No clue why this OOM issue occurred or what caused it. It appears to be an anomoly.
I verified my NAS and VMs were not doing anything strange at 1:00am. All normal NAS replication tasks, VM container tasks, and backup via SMB tasks running from LAN systems are running staggered by at least 20min - so they do not overlap - between 3-7am. Nothing runs at 1am as the log indicated when the error occurred.
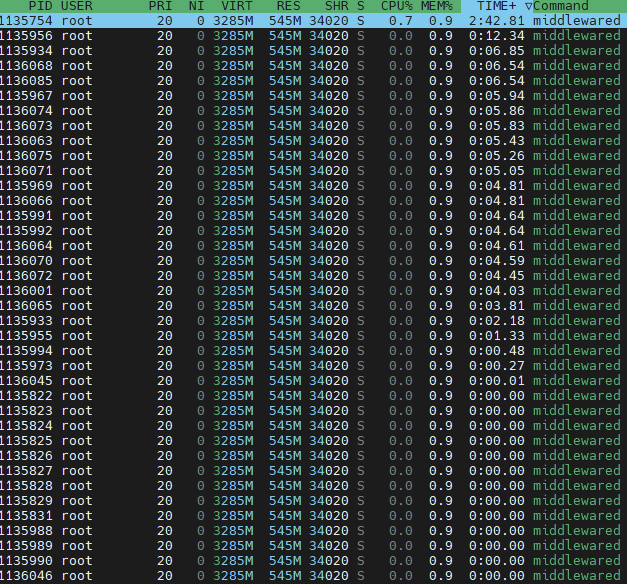
Available RAM has been in an acceptable range of 2-5GB during tasks. Services are normal at about 20-24GB. The one thing I did notice during testing was that SMB activity caused a lot of RAM usage. I never had to delve deeper into it as it didn’t break anything, but that’s something to note. I tested turning off and on the VMs but had no RAM issues and noticed the available RAM adjusted correctly when the VM was turned off and back on.
The only thing I can see that stands out is while the ZFS Cache is stable, the available memory shown in the VM section is only 400MiB. Shouldn’t that be higher? I’m not sure how that is calculated, maybe someone can chime in and explain that.
The available memory for VMs seems to be calculated like this:
In case of overcommit being true, calculations are done in the following manner: 1. If a VM has requested 10G but is only consuming 5G, only 5G will be counted 2. System will consider shrinkable ZFS ARC as free memory ( shrinkable ZFS ARC is current ZFS ARC minus ZFS ARC minimum )
In case of overcommit being false, calculations are done in the following manner: 1. Complete VM requested memory will be taken into account regardless of how much actual physical memory the VM is consuming 2. System will not consider shrinkable ZFS ARC as free memory
Memory is of course a very “volatile” resource, values may change abruptly between a second but I deem it good enough to give the user a clue about how much memory is available at the current moment and if a VM should be allowed to be launched.
I’m running version 25.04.2.6 on my TrueNAS Scale. I’ve noticed even before that it occasionally consumes a lot of RAM.
My TrueNAS is running on a VMware vsphere system. This problem started after a few updates.
I’ve also created a swap file, but that doesn’t seem to solve the issue.
My vCenter constantly reports that the VM has 100% RAM usage.
Therefore, my question is: is there a workaround or a solution for this problem yet?
The server also reboots automatically every day. However, that’s for a different reason: I can only backup the machine offline because I have a passthrough graphics card enabled on the host.
I had this issue before the problem started; it began after an update.
My answer to that question is when you figure it out or it decides to calm down.
The legends are true, you should never need a swap file and it can actually cause problems. As the OP on this thread, I can say my system eventually went back to normal after a few reboots. I still don’t have an answer as to why, but it’s been fine since. Having said that, my TN wasn’t running in any type of virtualization layer.