Does the first arrow point to when the scrub started? It’s hard to tell with the difference in time zones.
Is the drop when it reached 50%?
What is the scale? You cropped out the speeds.
At 5 MiB/s…
Those 5 MiB/s could be the “floor” you’re seeing for 2 hours at a time in between spikes.
Oli
July 28, 2026, 2:08pm
22
Interesting log. I can see the following, however when doing a tail it indeed very slow to appear.
1785247369   ffff8be859683300 dsl_scan.c:4600:dsl_scan_sync(): scan visited 4177 blocks of Rust in 10843ms (1 os's, 4070 holes, 0 < mintxg, 0 in ddt, 0 > maxtxg)
1785247369   ffff8be859683300 dsl_scan.c:4569:dsl_scan_sync(): doing scan sync for Rust txg 13424013; bm=2233/352704/0/0
1785247375   ffff8be859683300 dsl_scan.c:2861:dsl_scan_visitds(): scanned dataset 2233 (Rust/photos/immich) with min=1 max=13419638; suspending=1
1785247380   ffff8be859683300 dsl_scan.c:4600:dsl_scan_sync(): scan visited 2873 blocks of Rust in 10754ms (1 os's, 2800 holes, 0 < mintxg, 0 in ddt, 0 > maxtxg)
1785247380   ffff8be859683300 dsl_scan.c:4569:dsl_scan_sync(): doing scan sync for Rust txg 13424014; bm=2233/352768/0/0
1785247386   ffff8be859683300 dsl_scan.c:2861:dsl_scan_visitds(): scanned dataset 2233 (Rust/photos/immich) with min=1 max=13419638; suspending=1
1785247391   ffff8be859683300 dsl_scan.c:4600:dsl_scan_sync(): scan visited 5204 blocks of Rust in 10815ms (1 os's, 5086 holes, 0 < mintxg, 0 in ddt, 0 > maxtxg)
1785247391   ffff8be859683300 dsl_scan.c:4569:dsl_scan_sync(): doing scan sync for Rust txg 13424015; bm=2233/352864/0/0
1785247398   ffff8be859683300 dsl_scan.c:2861:dsl_scan_visitds(): scanned dataset 2233 (Rust/photos/immich) with min=1 max=13419638; suspending=1
1785247402   ffff8be859683300 dsl_scan.c:4600:dsl_scan_sync(): scan visited 1866 blocks of Rust in 11055ms (1 os's, 1784 holes, 0 < mintxg, 0 in ddt, 0 > maxtxg)
1785247402   ffff8be859683300 dsl_scan.c:4569:dsl_scan_sync(): doing scan sync for Rust txg 13424016; bm=2233/352960/0/0
1785247410   ffff8be859683300 dsl_scan.c:2861:dsl_scan_visitds(): scanned dataset 2233 (Rust/photos/immich) with min=1 max=13419638; suspending=1
1785247414   ffff8be859683300 dsl_scan.c:4600:dsl_scan_sync(): scan visited 1851 blocks of Rust in 11970ms (1 os's, 1784 holes, 0 < mintxg, 0 in ddt, 0 > maxtxg)
1785247414   ffff8be859683300 dsl_scan.c:4569:dsl_scan_sync(): doing scan sync for Rust txg 13424017; bm=2233/353025/0/0
1785247422   ffff8be859683300 dsl_scan.c:2861:dsl_scan_visitds(): scanned dataset 2233 (Rust/photos/immich) with min=1 max=13419638; suspending=1
1785247426   ffff8be859683300 dsl_scan.c:4600:dsl_scan_sync(): scan visited 3423 blocks of Rust in 12166ms (1 os's, 3308 holes, 0 < mintxg, 0 in ddt, 0 > maxtxg)
1785247426   ffff8be859683300 dsl_scan.c:4569:dsl_scan_sync(): doing scan sync for Rust txg 13424018; bm=2233/353153/0/0
1785247432   ffff8be859683300 dsl_scan.c:2861:dsl_scan_visitds(): scanned dataset 2233 (Rust/photos/immich) with min=1 max=13419638; suspending=1
1785247437   ffff8be859683300 dsl_scan.c:4600:dsl_scan_sync(): scan visited 2105 blocks of Rust in 10613ms (1 os's, 2038 holes, 0 < mintxg, 0 in ddt, 0 > maxtxg)
1785247437   ffff8be859683300 dsl_scan.c:4569:dsl_scan_sync(): doing scan sync for Rust txg 13424019; bm=2233/353216/0/0
1785247444   ffff8be859683300 dsl_scan.c:2861:dsl_scan_visitds(): scanned dataset 2233 (Rust/photos/immich) with min=1 max=13419638; suspending=1
1785247449   ffff8be859683300 dsl_scan.c:4600:dsl_scan_sync(): scan visited 2890 blocks of Rust in 12035ms (1 os's, 2783 holes, 0 < mintxg, 0 in ddt, 0 > maxtxg)
1785247449   ffff8be859683300 dsl_scan.c:4569:dsl_scan_sync(): doing scan sync for Rust txg 13424020; bm=2233/353312/0/0
1785247457   ffff8be859683300 dsl_scan.c:2861:dsl_scan_visitds(): scanned dataset 2233 (Rust/photos/immich) with min=1 max=13419638; suspending=1
1785247461   ffff8be859683300 dsl_scan.c:4600:dsl_scan_sync(): scan visited 3686 blocks of Rust in 12051ms (1 os's, 3562 holes, 0 < mintxg, 0 in ddt, 0 > maxtxg)
1785247461   ffff8be859683300 dsl_scan.c:4569:dsl_scan_sync(): doing scan sync for Rust txg 13424021; bm=2233/353440/0/0
I was kind of expecting something related to Immich with all the pictures.
Oli
July 28, 2026, 2:08pm
23
The first green arrow shows when it started doing someting, it stayed at 0% for around 1h.
A lot of suspending in that log. Not sure if this is normal behavior for a scrub during a period of a pool that isn’t being actively used.
@HoneyBadger or others might know more of what is to be expected and what might signify an underlying problem.
Does zpool events -v Rust show anything? You’ll have to limit it to today.
The entire scrub fell off a cliff and is now crawling, just as you observed initially. I don’t believe it has do to with your media files or datasets. I wouldn’t put that on media and photos. A block is a block to ZFS. 128K or 1M, a block is a block.
Oli
July 28, 2026, 2:20pm
26
Here are the events. Not so many overall. Here is an example as I cannot attach files
Jul 28 2026 20:01:44.579571721 sysevent.fs.zfs.history_event
        version = 0x0
        class = "sysevent.fs.zfs.history_event"
        pool = "Rust"
        pool_guid = 0x572cea0d9a6b11d6
        pool_state = 0x0
        pool_context = 0x0
        history_hostname = "truenas"
        history_dsname = "Rust/backups/apps-data"
        history_internal_str = "readonly=1"
        history_internal_name = "set"
        history_dsid = 0x2209
        history_txg = 0xccd30c
        history_time = 0x6a689a28
        time = 0x6a689a28 0x228b9009
        eid = 0x14b

Jul 28 2026 20:02:16.746059282 sysevent.fs.zfs.history_event
        version = 0x0
        class = "sysevent.fs.zfs.history_event"
        pool = "Rust"
        pool_guid = 0x572cea0d9a6b11d6
        pool_state = 0x0
        pool_context = 0x0
        history_hostname = "truenas"
        history_dsname = "Rust/backups/apps-data/syncthing/%recv"
        history_internal_str = " "
        history_internal_name = "receive"
        history_dsid = 0x1b90
        history_txg = 0xccd310
        history_time = 0x6a689a48
        time = 0x6a689a48 0x2c77f612
        eid = 0x14c

Jul 28 2026 20:02:33.027269142 sysevent.fs.zfs.history_event
        version = 0x0
        class = "sysevent.fs.zfs.history_event"
        pool = "Rust"
        pool_guid = 0x572cea0d9a6b11d6
        pool_state = 0x0
        pool_context = 0x0
        history_hostname = "truenas"
        history_dsname = "Rust/backups/apps-data/syncthing"
        history_internal_str = "mountpoint=/"
        history_internal_name = "inherit"
        history_dsid = 0x230c
        history_txg = 0xccd312
        history_time = 0x6a689a59
        time = 0x6a689a59 0x1a01816
        eid = 0x14d

Jul 28 2026 20:02:44.409318576 sysevent.fs.zfs.history_event
        version = 0x0
        class = "sysevent.fs.zfs.history_event"
        pool = "Rust"
        pool_guid = 0x572cea0d9a6b11d6
        pool_state = 0x0
        pool_context = 0x0
        history_hostname = "truenas"
        history_dsname = "Rust/backups/apps-data/syncthing/%recv"
        history_internal_str = "snap=apps-data-2026-07-28_20-00"
        history_internal_name = "finish receiving"
        history_dsid = 0x1b90
        history_txg = 0xccd314
        history_time = 0x6a689a64
        time = 0x6a689a64 0x1865b4b0
        eid = 0x14e

Jul 28 2026 20:02:44.409318576 sysevent.fs.zfs.history_event
        version = 0x0
        class = "sysevent.fs.zfs.history_event"
        pool = "Rust"
        pool_guid = 0x572cea0d9a6b11d6
        pool_state = 0x0
        pool_context = 0x0
        history_hostname = "truenas"
        history_dsname = "Rust/backups/apps-data/syncthing/%recv"
        history_internal_str = "parent=syncthing"
        history_internal_name = "clone swap"
        history_dsid = 0x1b90
        history_txg = 0xccd314
        history_time = 0x6a689a64
        time = 0x6a689a64 0x1865b4b0
        eid = 0x14f

Jul 28 2026 20:02:44.409318576 sysevent.fs.zfs.history_event
        version = 0x0
        class = "sysevent.fs.zfs.history_event"
        pool = "Rust"
        pool_guid = 0x572cea0d9a6b11d6
        pool_state = 0x0
        pool_context = 0x0
        history_hostname = "truenas"
        history_dsname = "Rust/backups/apps-data/syncthing@apps-data-2026-07-28_20-00"
        history_internal_str = " "
        history_internal_name = "snapshot"
        history_dsid = 0x1c37
        history_txg = 0xccd314
        history_time = 0x6a689a64
        time = 0x6a689a64 0x1865b4b0
        eid = 0x150

Jul 28 2026 20:02:44.421316520 sysevent.fs.zfs.history_event
        version = 0x0
        class = "sysevent.fs.zfs.history_event"
        pool = "Rust"
        pool_guid = 0x572cea0d9a6b11d6
        pool_state = 0x0
        pool_context = 0x0
        history_hostname = "truenas"
        history_dsname = "Rust/backups/apps-data/syncthing/%recv"
        history_internal_str = "(bptree, mintxg=13421800)"
        history_internal_name = "destroy"
        history_dsid = 0x1b90
        history_txg = 0xccd314
        history_time = 0x6a689a64
        time = 0x6a689a64 0x191cc7a8
        eid = 0x151
Oli
July 28, 2026, 2:22pm
27
There is definitely a spike every 2h, however I am not sure if it related to the scrub. It lasts around 2min. The disk went suddenly quiet haha.
Are those the latest events? “receive”? Is this pool a backup target? Were any replications/receives started?
What about near the time the drop happened?
It’s getting to the point where you might want to cancel the scrub, let things settle, then start a new scrub that you can immediately assess if it repeats the same pattern.
Make sure no other tasks are running. Replications, receives, smart tests, library scans, nothing.
Oli
July 28, 2026, 2:30pm
30
Here the start. Nothing in the events at the start or end of the spikes.
Jul 28 2026 08:59:38.830437392 sysevent.fs.zfs.scrub_start
        version = 0x0
        class = "sysevent.fs.zfs.scrub_start"
        pool = "Rust"
        pool_guid = 0x572cea0d9a6b11d6
        pool_state = 0x0
        pool_context = 0x0
        time = 0x6a67fefa 0x317f7810
        eid = 0x117

Jul 28 2026 08:59:38.830437392 sysevent.fs.zfs.history_event
        version = 0x0
        class = "sysevent.fs.zfs.history_event"
        pool = "Rust"
        pool_guid = 0x572cea0d9a6b11d6
        pool_state = 0x0
        pool_context = 0x0
        history_hostname = "truenas"
        history_internal_str = "func=1 mintxg=0 maxtxg=13419638"
        history_internal_name = "scan setup"
        history_txg = 0xccc476
        history_time = 0x6a67fefa
        time = 0x6a67fefa 0x317f7810
        eid = 0x118
Oli
July 28, 2026, 2:32pm
31
I already did that on Sunday and went this rabbit hole on checking a lot of things haha.
Oli:
pool = "Rust"
There’s your problem. Probably running your server in a humid environment.
Maybe I missed it, but how are these drives connected? Directly to motherboard? Through an HBA? Something less kosher?
Also, any chance we can get the full output of smartctl -a instead of just the ‘passed’?
Oli
July 28, 2026, 2:46pm
34
Of course. I put sda, they all look the same
root@truenas[/home/admin]# sudo smartctl -a /dev/sda
smartctl 7.4 2023-08-01 r5530 [x86_64-linux-6.12.95-production+truenas] (local build)
Copyright (C) 2002-23, Bruce Allen, Christian Franke, www.smartmontools.org

=== START OF INFORMATION SECTION ===
Model Family:     Western Digital Ultrastar DC HC550
Device Model:     WDC  WUH721816ALE6L4
Serial Number:    2BKBMDJN
LU WWN Device Id: 5 000cca 295ef8f6f
Firmware Version: PCGNW680
User Capacity:    16,000,900,661,248 bytes [16.0 TB]
Sector Sizes:     512 bytes logical, 4096 bytes physical
Rotation Rate:    7200 rpm
Form Factor:      3.5 inches
Device is:        In smartctl database 7.3/5528
ATA Version is:   ACS-4 published, ANSI INCITS 529-2018
SATA Version is:  SATA 3.3, 6.0 Gb/s (current: 6.0 Gb/s)
Local Time is:    Tue Jul 28 22:45:28 2026 HKT
SMART support is: Available - device has SMART capability.
SMART support is: Enabled

=== START OF READ SMART DATA SECTION ===
SMART overall-health self-assessment test result: PASSED

General SMART Values:
Offline data collection status:  (0x84)	Offline data collection activity
					was suspended by an interrupting command from host.
					Auto Offline Data Collection: Enabled.
Self-test execution status:      (   0)	The previous self-test routine completed
					without error or no self-test has ever
					been run.
Total time to complete Offline
data collection: 		(  101) seconds.
Offline data collection
capabilities: 			 (0x5b) SMART execute Offline immediate.
					Auto Offline data collection on/off support.
					Suspend Offline collection upon new
					command.
					Offline surface scan supported.
					Self-test supported.
					No Conveyance Self-test supported.
					Selective Self-test supported.
SMART capabilities:            (0x0003)	Saves SMART data before entering
					power-saving mode.
					Supports SMART auto save timer.
Error logging capability:        (0x01)	Error logging supported.
					General Purpose Logging supported.
Short self-test routine
recommended polling time: 	 (   2) minutes.
Extended self-test routine
recommended polling time: 	 (1867) minutes.
SCT capabilities: 	       (0x003d)	SCT Status supported.
					SCT Error Recovery Control supported.
					SCT Feature Control supported.
					SCT Data Table supported.

SMART Attributes Data Structure revision number: 16
Vendor Specific SMART Attributes with Thresholds:
ID# ATTRIBUTE_NAME          FLAG     VALUE WORST THRESH TYPE      UPDATED  WHEN_FAILED RAW_VALUE
  1 Raw_Read_Error_Rate     0x000b   100   100   001    Pre-fail  Always       -       0
  2 Throughput_Performance  0x0005   149   149   054    Pre-fail  Offline      -       44
  3 Spin_Up_Time            0x0007   083   083   001    Pre-fail  Always       -       355 (Average 357)
  4 Start_Stop_Count        0x0012   100   100   000    Old_age   Always       -       16
  5 Reallocated_Sector_Ct   0x0033   100   100   001    Pre-fail  Always       -       0
  7 Seek_Error_Rate         0x000b   100   100   001    Pre-fail  Always       -       0
  8 Seek_Time_Performance   0x0005   140   140   020    Pre-fail  Offline      -       15
  9 Power_On_Hours          0x0012   098   098   000    Old_age   Always       -       19289
 10 Spin_Retry_Count        0x0013   100   100   001    Pre-fail  Always       -       0
 12 Power_Cycle_Count       0x0032   100   100   000    Old_age   Always       -       16
 22 Helium_Level            0x0023   100   100   025    Pre-fail  Always       -       100
192 Power-Off_Retract_Count 0x0032   100   100   000    Old_age   Always       -       830
193 Load_Cycle_Count        0x0012   100   100   000    Old_age   Always       -       830
194 Temperature_Celsius     0x0002   055   055   000    Old_age   Always       -       39 (Min/Max 25/55)
196 Reallocated_Event_Count 0x0032   100   100   000    Old_age   Always       -       0
197 Current_Pending_Sector  0x0022   100   100   000    Old_age   Always       -       0
198 Offline_Uncorrectable   0x0008   100   100   000    Old_age   Offline      -       0
199 UDMA_CRC_Error_Count    0x000a   100   100   000    Old_age   Always       -       0

SMART Error Log Version: 1
No Errors Logged

SMART Self-test log structure revision number 1
Num  Test_Description    Status                  Remaining  LifeTime(hours)  LBA_of_first_error
# 1  Short offline       Completed without error       00%     19269         -
# 2  Extended offline    Completed without error       00%     19264         -
# 3  Short offline       Completed without error       00%     19228         -
# 4  Short offline       Completed without error       00%     19197         -
# 5  Short offline       Completed without error       00%     19173         -
# 6  Short offline       Completed without error       00%     19149         -
# 7  Short offline       Completed without error       00%     19126         -
# 8  Short offline       Completed without error       00%     19101         -
# 9  Short offline       Completed without error       00%     19077         -
#10  Short offline       Completed without error       00%     19053         -
#11  Short offline       Completed without error       00%     19029         -
#12  Short offline       Completed without error       00%     19005         -
#13  Short offline       Completed without error       00%     18981         -
#14  Short offline       Completed without error       00%     18957         -
#15  Short offline       Completed without error       00%     18933         -
#16  Short offline       Completed without error       00%     18909         -
#17  Short offline       Completed without error       00%     18885         -
#18  Short offline       Completed without error       00%     18861         -
#19  Short offline       Completed without error       00%     18837         -
#20  Short offline       Completed without error       00%     18813         -
#21  Short offline       Completed without error       00%     18789         -

SMART Selective self-test log data structure revision number 1
 SPAN  MIN_LBA  MAX_LBA  CURRENT_TEST_STATUS
    1        0        0  Not_testing
    2        0        0  Not_testing
    3        0        0  Not_testing
    4        0        0  Not_testing
    5        0        0  Not_testing
Selective self-test flags (0x0):
  After scanning selected spans, do NOT read-scan remainder of disk.
If Selective self-test is pending on power-up, resume after 0 minute delay.

The above only provides legacy SMART information - try 'smartctl -x' for more
And yes directly to the motherboard.
As long as those fields are identical for each drive… Yeah those are looking like incredibly healthy drives.
Uhh… what other stupid things can I think of? No chance you got something silly like 3 meter long sata cables?
This last part will be a long shot because it’d normally cause the system to hang instead of a scrub failure, but did you do the c-state changes in bios considering you have a Ryzen 3600 & there has been past recorded wonkyness when the cpu goes into low power state?
Oli
July 28, 2026, 3:02pm
36
That is good to know
Fleshmauler:
Uhh… what other stupid things can I think of? No chance you got something silly like 3 meter long sata cables?
This last part will be a long shot because it’d normally cause the system to hang instead of a scrub failure, but did you do the c-state changes in bios considering you have a Ryzen 3600 & there has been past recorded wonkyness when the cpu goes into low power state?
Haha, no they are normal size.
Something like C6 state disabled and Global… power state something to not whatever the lowest eco mode? Its been a few years
Once again, this is a bit of a long shot, there used to be issues where low power states would cause the system to crash. I have maybe 8% hope that it’d fix the issue at hand.
Sara
July 28, 2026, 3:08pm
38
impatient. The rest does not matter. He/she manually stopped it.
While I agree, we have no idea about the number of files and fragmentation. Also RAIDZ1.
32* 4k blocks are not the same as the same as a single 128k block.
Semi offtopic: bevor further hunt down this issue and waste any time, you @Oli realize that running RAIDZ1 with such huge disk (and resilver times) is very risky?
I didn’t use enough verbiage. A block is a block. Doesn’t matter if it is (a) 128K (block) or (a) 1M (block). Wasn’t referring to files.
Sara:
impatient.
After 18 hours later and only a couple TB scrubbed, after the speeds suddenly dropped from a cliff and never returned. I wouldn’t call that impatient.
OP’s intuition was correct. Something is not right.

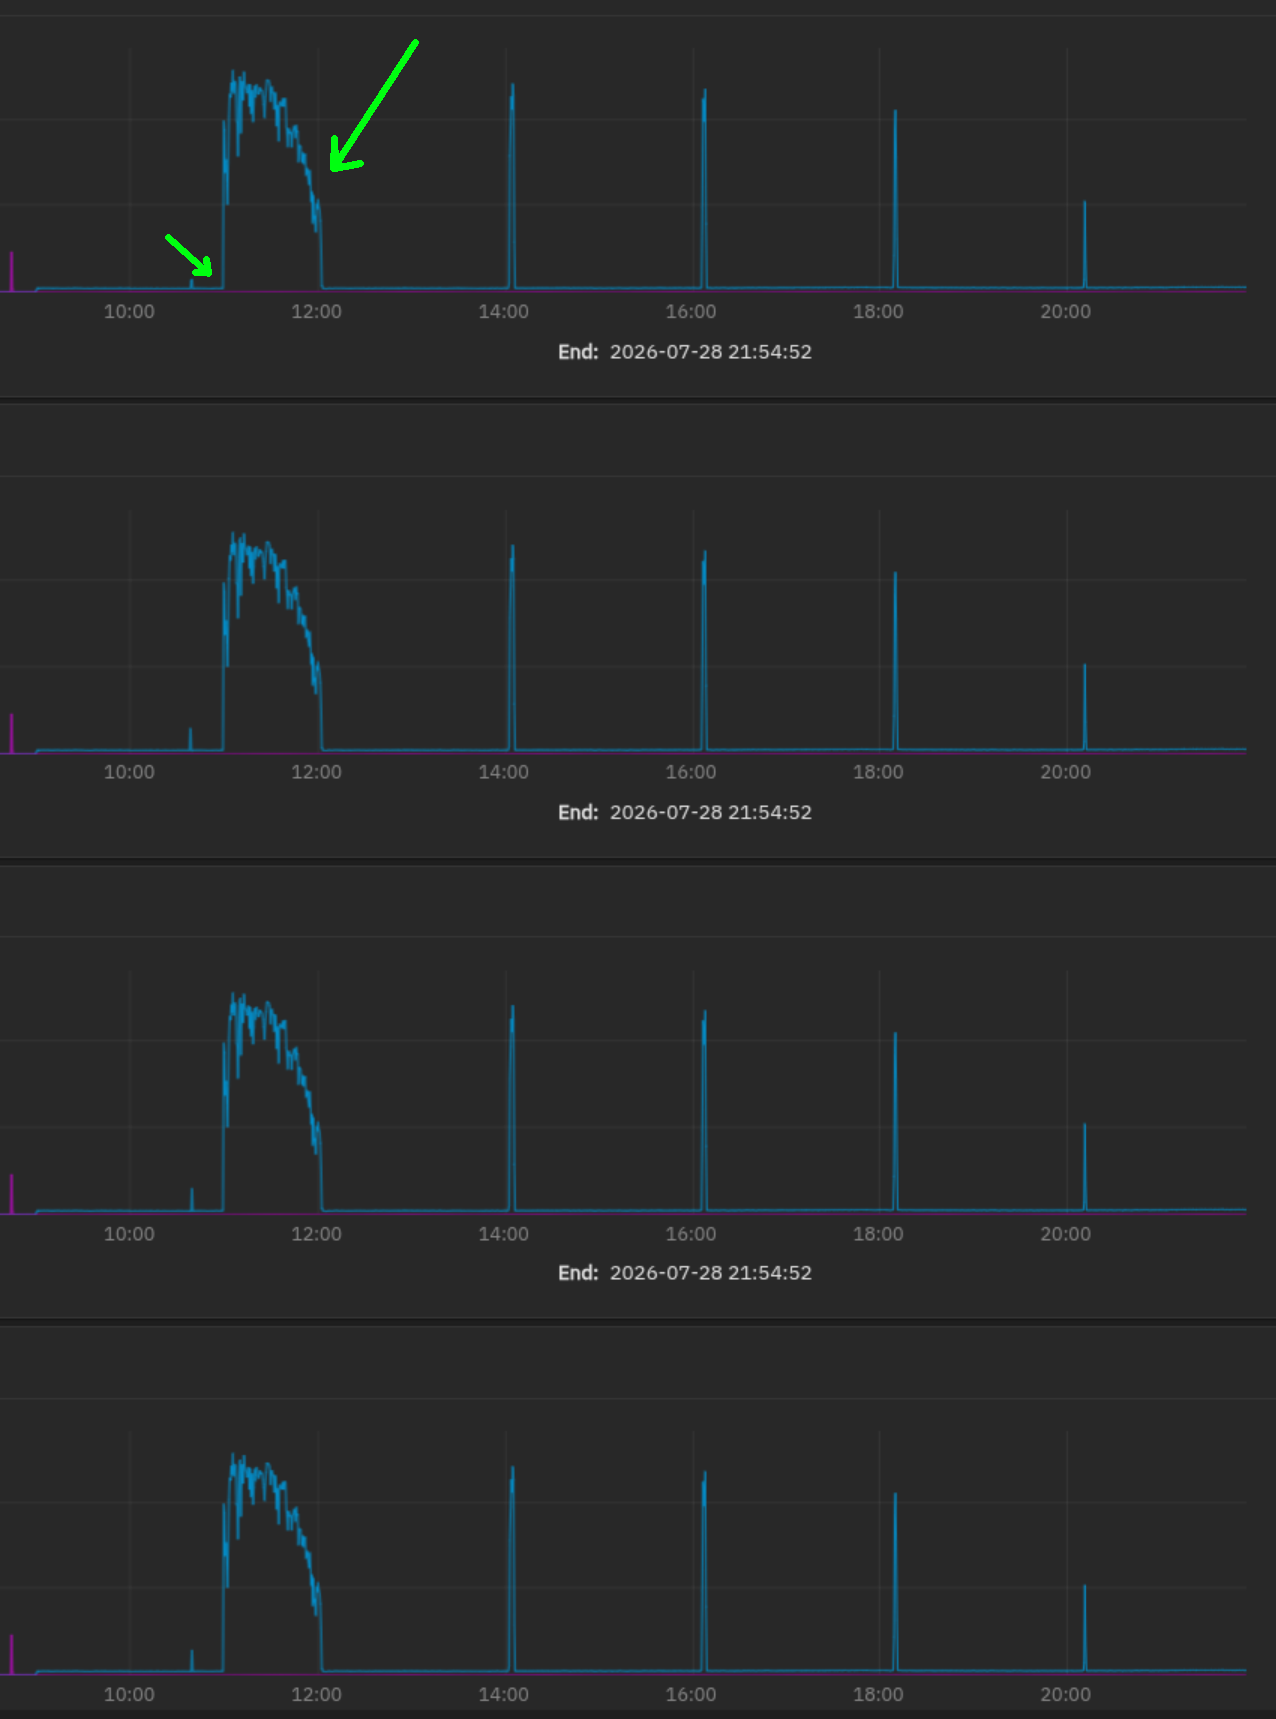
 Usually a scrub could give way to something else accessing the drives, but it doesn’t really look like that. No chance you have a custom spin down script or any kind of esoteric power savings enabled?
 I tried to move all the noise on the SSD to protect the HDD.
