Worth emphasising and why average record size being an important qualifier. (How does one see that in ZFS?)
Yes but… in that specific scenario wouldn’t it be appetising to add 256GB L2ARC and effectively fit the active data set there? Maybe also relatively more useful than going from 16 to 32 or 32 to 64GB RAM.
Obviously >128GB RAM would be even beyter still but maybe not the practical option.
From which you can calculate the breakdown of your data - but its likely better to just estimate that you’re going to use twice as much as you think you will.
The challenge is that your ARC will churn so rapidly that nothing stays in there long enough to be hit significantly more frequently than data that’s just passing through. Ghost lists will do some work and while it will eventually start to pass useful data in there, you’re likely to still have a lot of low-value “one-hit wonder” ARC records pushing potentially good data out of the L2ARC ring-buffer. Not that it won’t work but it’ll be less effective than if you had a larger initial ARC to hold and sort the data.
Again - the recommendations we make and defaults we have are somewhat generalized to apply to the vast majority of cases. The knobs are there for tuning, and we’re working on making more guidance for when and which way to turn them - but it’s very much dependent on each configuration and use-case.
In the discussions that followed, the ZFS dataset “recordsize” has been re-affirmed as being the maximum size. So perhaps mentioning that in the L2ARC calculator will assist people in understanding the output. And yes, you’ve listed “average block size” not “recordsize”… but users may overlook that initially, (I did).
l2arc_mfuonly=2 should work to reduce the churn of “one-hit wonders” once things settle in. Also, still staying with your example, if the active working set is really 128GB, then even with smallish ARC the majority of activity will still be there (by definition) and the majority of L2 “churn” would still be within your active working set. 256GB L2 adds another 100% capacity outside of the active working set for miscellaneous.
Still staying with your example… guess it comes down to average block size again. If you’re at the most extreme end of the scale with 4k then odds will work against you but in vast majority of cases the RAM overhead for 256GB L2 would still be in the order of 1GB or less, which even with 16GB RAM would seem a good trade-off (6% RAM) for what it could bring, maybe particularly in that case, as ARC itself won’t be anywhere near able to contain the active working set. As would be the case with 32GB too.
Anyway, we go around in circles a little bit. At the end of the day each case will of course look different, I understand why you’re erring on the conservative side and ultimately for the advanced users the most important part is probably to understand the concepts and trade-offs, what data to base the decisions on, and where to find it.
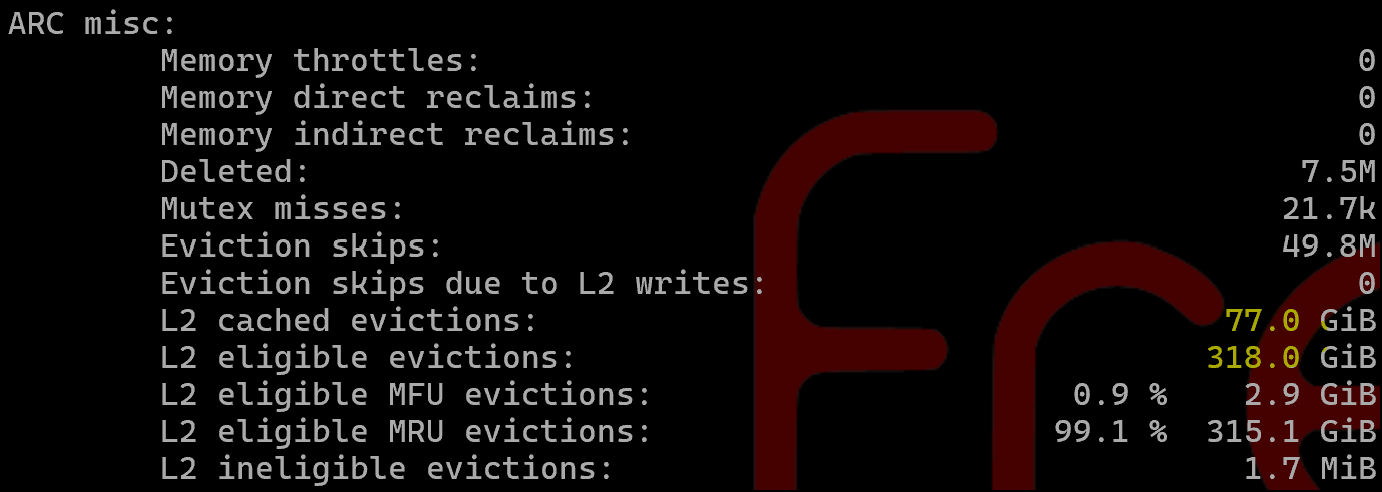
Also FWIW, in ARC my MFU/MRU ratio for ARC hits looks very differant than @HoneyBadger
        Most frequently used (MFU):                    85.7 %       1.6G
        Most recently used (MRU):                      11.1 %     213.3M
        Most frequently used (MFU) ghost:               0.1 %       2.1M
        Most recently used (MRU) ghost:                 0.1 %       1.3M
        Uncached:                                       0.0 %          0
and total I/O from L2ARC, I see 1.6TiB of writes already. I have 2 200GB SAS SSDs for cache. Thats like ~3DWPD assuming 1.5 days. Not neglible. For these drives I’m not at all worried, but l2arc_write_max proceed with caution. @nabsltd
I have the EMC OEM version of this, I think. So a 9PiB endurance each?
smartctl 7.4 2023-08-01 r5530 [x86_64-linux-6.6.44-production+truenas] (local build)
Copyright (C) 2002-23, Bruce Allen, Christian Franke, www.smartmontools.org

=== START OF INFORMATION SECTION ===
Vendor:               HITACHI
Product:              HUSMH842 CLAR200
Revision:             C250
Compliance:           SPC-4
User Capacity:        200,049,647,616 bytes [200 GB]
Logical block size:   512 bytes
Physical block size:  4096 bytes
LU is resource provisioned, LBPRZ=1
Rotation Rate:        Solid State Device
Form Factor:          2.5 inches
Logical Unit id:      0x5000cca04a74162c
Serial number:        0LX1V4NA
Device type:          disk
Transport protocol:   SAS (SPL-4)
Local Time is:        Thu Feb  6 14:26:47 2025 EST
SMART support is:     Available - device has SMART capability.
SMART support is:     Enabled
Temperature Warning:  Enabled

=== START OF READ SMART DATA SECTION ===
SMART Health Status: OK

Percentage used endurance indicator: 1%
Current Drive Temperature:     30 C
Drive Trip Temperature:        70 C

Accumulated power on time, hours:minutes 39573:03
Manufactured in week 47 of year 2015
Specified cycle count over device lifetime:  0
Accumulated start-stop cycles:  0
Specified load-unload count over device lifetime:  0
Accumulated load-unload cycles:  0
Elements in grown defect list: 0

Vendor (Seagate Cache) information
  Blocks sent to initiator = 6939075

Error counter log:
           Errors Corrected by           Total   Correction     Gigabytes    Total
               ECC          rereads/    errors   algorithm      processed    uncorrected
           fast | delayed   rewrites  corrected  invocations   [10^9 bytes]  errors
read:          0        0         0         0          0     175333.389           0
write:         0        0         0         0          0     120971.663           0
verify:        0        0         0         0          0      13998.341           0
I’m seeing this first-hand in my constrained RAM experiment. My l2size has been stuck in the low 30’s GB since last night. Feeds are sporadic and fairly small. You mention an “MFU index” above and I’m not sure if was meant as a hypothetical or it’s an actual constant in arc.c… But this seems like a good candidate to become a tunable if the latter…
I recall these two stats being mostly equal before this experiment began:
Despite your ominous warnings I couldn’t resist to run this command on my own HDD pool (“must touch hot stove…” ) and to my great surprise it only took between 5 and 10 minutes to complete (see sig for the details on my pool):
Not knowing any better I suspect that this might be for two reasons:
My average blocksize is much higher (default recordsize is 1M, 2M for media files, and for my one sparse zvol the volblocksize is 128k)
The pool is less than two weeks old, so I assume that fragmentation is near zero, which might speed up the traversing of the pool.
Still, perhaps this means that running this command to get the stats for one’s own pool is feasible in more situations that you would expect. And that would make it easier to recommend sizing based on that data, rather than on general guidelines.
Worth noting, the time it takes is only half of the equation. Running this command on a production system with other real workloads will have potentially large performance ramifications as well. For a lab system, go ahead! But real work is being done on other systems and making your userbase angry isn’t ideal.
Oh, absolutely! Not a command you’d run casually (even though I think it’s a bit of a shame that the command doesn’t provide a “low priority” option). But wouldn’t most systems have some idle hours per day or during a weekend to at least give this a try?
Congratulations, your average block size is in the order of 1MB, IF the same distribution was reflected in L2ARC you’d be able to fit several terabytes with only 0.5GB RAM overhead…
Perhaps more meaningful would be to L2 cache the more random read/write stuff but even 128k blocks should give you plenty to work with.
Special vdevs laugh in the face of your warning. Time taken to traverse a 10 wide RaidZ2 pool of 16TB HDD, with a three wide mirror of 2TB M.2 NVMe drives as special vdev. The task took less time to complete than Usain Bolt needs to travel 100m (on foot, anyway).
For 41.2T I offer this as an example: is it worth using a tuned L2ARC with a pool with a special vdev? I expect not, but it’s a point worth considering.
Can we even derive such a conclusion from the block size histogram alone?
My understanding (right or wrong) is that so far we’ve been at the “First do no harm” stage, that is to find a way to determine an upper limit for L2ARC size, so that it won’t impact the effectiveness of the ARC cache, by taking too much memory away from it.
Just glancing at your histogram it appears that your average block size is well above 1MiB, so using the calculator for the system in your sig, you can use an 200 TB L2ARC cache and use less than 10% of your RAM. Or for a 40TB L2ARC cache you’d use less than 4GB RAM.
So an L2ARC cache of any conceivable size appears to be no danger to your pool’s performance (but perhaps a danger to your wallet’s performance ).
Projecting the potential benefit (e.g. in percentage of requests served from L2ARC) would appear to be a different beast altogether though…
If I had the money for a 40TB L2ARC I’d just put everything onto consumer NVMe drives!
My understanding of the questions raised in this thread boils down to: how much cheaper, safer and easier than a special vdev can L2ARC be, whilst reaching 80+% of the benefit? Is this wrong (asking as someone that doesn’t work in tech)? It’s just that the figures generated do need the context, and it feels like the thread will travel in the direction of trying to answer the following question: at what point is it that a special vdev might make sense?
Thanks for the tool.
But, on second thought, maybe we’d need an extra parameter box to account for write cache/networking speed. Base recommendations are for 1 GbE; switching to 10 GbE takes up to two txg worth of RAM space for the write cache, reducing available ARC size by a not-unsubstantial amount, and then it seems that “L2ARC footprint at 10/25% RAM” does not fully capture what’s going on…
You need to understand what a Special Allocation device / vDev can do:
Metadata & the indirect blocks for user data, (but not user data)
Small blocks from files, (user adjustable size what defines a small block)
DeDup table
But, I take your point.
One key difference is that you can loose a L2ARC device without loosing your pool. If you loose a Special Allocation device, your pool is gone. That is why the recommended redundancy of a Special Allocation device / vDev be the same as the pool. So, with RAID-Z2 in the main pool, you should have 3 way Mirroring of the Special Allocation vDev.
Note that you can NOT Mirror or RAID-Zx a L2ARC device. You can stripe them, if so desired, which can mitigate loss of a L2ARC device. The remaining L2ARC device(s) will continue to serve up what data they can, and start to load more data that might have been from the failed L2ARC device.
Another key difference between L2ARC and Special Allocation device(s) is that a L2ARC can be removed at any time. A Special Allocation device can only be removing if the data pool consists of Mirrors only. Any RAID-Zx or dRAID and the Special Allocation device(s) is forever stuck attached to your pool.
I am absolutely not an expert on ARC or L2ARC, but I have a couple of comments:
My ARC on my small NAS (media / backup server) behind c. 10TiB of data is only c. 3.5GB in size, but achieves a cache hit rate of > 99% (so >>>>> 90%).
With that level of hit rate, I can only assume that what falls off the bottom of the MFU cache and would be moved to L2ARC if I had it would be very rarely read.
Steady state
NAS systems are supposed to stay up for months on end, so let’s consider the situation of a NAS that has been up and running for long enough for ARC to be dropping stuff off the bottom of the MRU / MFU lists.
My gut reaction based only on my unique sample of one system is that if you have a reasonable amount of ARC but are getting < (say) 95% cache hit rate, then either
Your workload is sufficiently random that ARC doesn’t help - in which case neither adding more memory nor adding L2ARC will help.
Your workload is not random, in which case adding more memory to increase ARC is likely to improve cache hits and that might well be a better investment than L2ARC.
But if memory is maxed out, then L2ARC might help serve metadata / data that would have stayed in ARC had it been bigger.
This is still pretty much what the old guidelines used to say. Yes - reducing the L2ARC overhead from 180ish bytes to 90ish bytes is a help, but L2ARC still take memory away from normal ARC functions.
Persistent L2ARC
Again, naively perhaps, it seems to me that the older non-persistent L2ARC didn’t have that much to offer before reaching steady state (e.g. as an edge case during boot) because it was empty.
But now it is persistent then I can see that it might be beneficial to populating ARC before it reaches stability - kind of in the same way that Windows has boot optimisation using a pre-fetch cache except on Windows it is the same boot drive whereas L2ARC is on faster technology.
L2ARC vDev vs. special allocation (metadata) vDev
I do appreciate that L2ARC is a helper cache which doesn’t lose data if it fails, whilst Metadata vDevs are critical for the pool and needs to be redundant (so significantly more hardware & $$$), but if I am designing a new system / pool which should I choose (assuming that it is one or the other and whichever I choose will be on the same NVMe Optane technology)?
L2ARC / Special vDev allocation block sizes
Can you specify an asize or similar for these specialised vDevs, and if so what relationship should they have to the asize of your pool/data vDevs and how should they relate to your dataset recordsizes (which have no equivalent in either L2ARC or special vDevs)?
I genuinely have no idea what the answers are or whether my guesses or right or wrong. So if anyone can respond to these points that would be great.
Overkill in both uses. Optane is most suited as SLOG—which doesn’t mean it would make for a bad L2ARC or sVDEV. L2ARC should preferably be NVMe, for the sake of speed; but sVDEV to HDD storage could well be SATA SSDs—fast enough, and even faster as it will be a mirror.
Some ideas:
L2ARC only speeds up reads; to speed up writes, sVDEV is required.
L2ARC can always be removed; sVDEV on raidz# storage is an irreversible choice.
If one is willing to go off-road, a single Optane drive can be partitioned to serve as both SLOG and L2ARC.
No. Pool-wide settings.
In his discussion of sVDEV, @Constantin pointed that a zvol whose record size is small enough to be a “small block” is entirely stored in the sVDEV. So one could have a single pool with large HDDs for bulk storage and a sVDEV for VMs. But I’m not fully convinced that the simplicity of having a single hybrid pool for all uses outweight the flexibility of the traditional approach of having separate HDD and SSD pools for different uses.
My own hardware (see sig.) is really pretty underpowered. Nowhere near enough memory for VMs, but it does run a couple of meaty apps (Plex and Unifi) and a handful of smaller ones, and yet as a NAS with a very limited sized ARC the performance is still brilliant!!!
I definitely don’t have the ports to support a special vDev, and not really to support a dedicated L2ARC SSD though I suppose I could go even further off-piste and add an L2ARC vDev to my USB boot SSD which already has an apps pool added - so that’s two support rules broken right there so heck adding an L2ARC on top to make that a hat-trick of broken rules doesn’t seem too bad).
But my underpowered NAS performs brilliantly without either of these, so why shouldn’t everyone else’s decent powered NAS.