Million of Checksum errors per day!

I see no READ or WRITE errors, just CKSUM errors. Actually it is happening to all the drives. Read ID 192.

The HBA could also be the problem, if it can command the drive to sleep, the START/STOP count is also extremely high, this does mean the drive is spinning down. Or @luiscaloto has setup TrueNAS to sleep those drives.

With that said, I still have not seen any system specs which I asked for earlier, and is TrueNAS running on bare metal?

It is difficult to give advice when we do not know what all of the hardware is.

Here is a possible theory: The power cycling is coincidental and has nothing to do with the file corruption. The HBA/TrueNAS would not command the drive to power down if a data operation were in progress. When you connected the drive to the motherboard, was the HBA still in the system?

Out of curiosity, what are the power cycle counts on your other drives and power on hours?

With that said, I’d still fix the drives spinning up/down so frequently (I’m omitting using SSH, since it appears you already know how to do this).

  1. This is something that needs to be monitored.
  2. I’d remove the HBA and plug into the motherboard.
  3. Record the the START/STOP count to each drive.
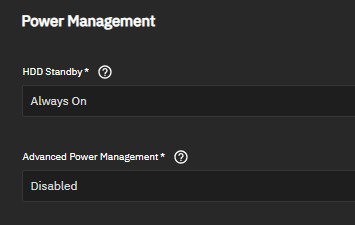
  4. In TrueNAS, ensure HDD Standby is Always On and APM is Disabled.
  5. Power Down (actually remove power, not reboot), wait 10 seconds and power back on.
  6. Record the the START/STOP count to each drive again.
  7. Delete the corrupt files as listed by zpool status -v
  8. Clear the CHSUM errors zpool clear pool-data
  9. Run a SCRUB zpool scrub pool-data
  10. Periodically check the scrub status using zpool status -v pool-data
  11. After the scrub, look at the START/STOP count of each drive, did it increase?
  12. If the START/STOP count did not increase, then step 4 likely fixed it.
  13. If the pool is no longer corrupt, then I suspect deleting the files fixed it.
  14. Are these related, I just don’t know at this time. They could be but I can’t imagine file corruption unless the power to the drives is being randomly dropped.
Question: Think really hard, what happened before these errors started? It could be as simple as you rebooted the system or physically did something like move it.

If none of these steps help, and you haven’t already done so, backup the data you want to keep, then you could try these steps, what I’d do if I have a problem like this:

  1. Export the pool-data vdev.
  2. Power Off
  3. Disconnect all the HDDs drives.
  4. Power On
  5. Does your system appear to be running normally, with the exception of the one pool being in place?
  6. Power Down
  7. Connect a single drive, you can choose, both power and data connector to the motherboard.
  8. Power On
  9. Record the Power On Cycle Count.
  10. Wait several hours and check the Power On Cycle Count again.
  11. If it is the same, you could let it stay like this overnight to be certain and chack again.
  12. If the data is unchanged then you need to go back to step 6 and disconnect the drive power and data cables, plug those into the next drive to test. Repeat until you either have a high power cycle count, anything more than 0 with the proper settings is what you are expecting. A few counts I would not worry about but as I said, there should be no change.
  13. If you find an issue and the counts are high on the first drive tested, swap out the drive for the next drive, go back to step 6 and retest the second drive.
  14. If the problem seem to occur with a single drive, that is likely the problem. If it happens to all the drives, you has a system setup or hardware issue. I suspect system setup first.

That is a lot to do. these problems are not always an easy fix and require some testing time to identify the issue.

This is problem… the affected pool is only for my data backup. Almost no operations a day.

I will send these reports an hour interval

The problem appeared one week ago…and today I replace PSU with new on, cables too, and dont solve the problem…

I think that this steps will be done once checksum errors stop to increase, isn“t it??

All cables will been changed… Power and SATA….

ZFS errors don’t get logged unless there’s a read or write operation or the pool is scrubbing. A pool idling and doing nothing doesn’t report millions of checksum errors, since no attempts are being made to read or write data.

This is why I’m confused.

Thank you very much joesmuck! I will follow your steps..

bare metal!

About the hardware. My first setup was with desktop board to test the TrueNAS. It will grow and grow and I know that my system specs are a desktop one, not a Server

But, the system works well until now, and I“m trying hard to know the origin of the problem for future tasks.

The system work well, without any changes from last year, so now, the only suspicious to me is H81 Chipset

Hardware:

  • ASUS H81M-P PLUS
  • Intel(R) Coreā„¢ i7-4790 CPU @ 3.60GHz
  • 32GB RAM (No ECC)

I will follow the steps and send feedback!!

1 Like

I have changed ā€œHDD Standby: Always ONā€ and APM:Disabledā€

Smart after reboot of one of disk with checksum errors:

smartctl 7.4 2023-08-01 r5530 \[x86_64-linux-6.12.15-production+truenas\] (local build)
Copyright (C) 2002-23, Bruce Allen, Christian Franke, www.smartmontools.org

=== START OF INFORMATION SECTION ===
Model Family:     Western Digital Red Plus
Device Model:     WDC WD40EFPX-68C6CN0
Serial Number:    WD-WX12D63NNVRX
LU WWN Device Id: 5 0014ee 215f9b45d
Firmware Version: 81.00A81
User Capacity:    4,000,787,030,016 bytes \[4.00 TB\]
Sector Sizes:     512 bytes logical, 4096 bytes physical
Rotation Rate:    5400 rpm
Form Factor:      3.5 inches
Device is:        In smartctl database 7.3/6083
ATA Version is:   ACS-3 T13/2161-D revision 5
SATA Version is:  SATA 3.1, 6.0 Gb/s (current: 6.0 Gb/s)
Local Time is:    Thu Feb 19 21:36:35 2026 CET
SMART support is: Available - device has SMART capability.
SMART support is: Enabled

=== START OF READ SMART DATA SECTION ===
SMART overall-health self-assessment test result: PASSED

General SMART Values:
Offline data collection status:  (0x00) Offline data collection activity
was never started.
Auto Offline Data Collection: Disabled.
Self-test execution status:      (   0) The previous self-test routine completed
without error or no self-test has ever
been run.
Total time to complete Offline
data collection:                (42120) seconds.
Offline data collection
capabilities:                    (0x7b) SMART execute Offline immediate.
Auto Offline data collection on/off support.
Suspend Offline collection upon new
command.
Offline surface scan supported.
Self-test supported.
Conveyance Self-test supported.
Selective Self-test supported.
SMART capabilities:            (0x0003) Saves SMART data before entering
power-saving mode.
Supports SMART auto save timer.
Error logging capability:        (0x01) Error logging supported.
General Purpose Logging supported.
Short self-test routine
recommended polling time:        (   2) minutes.
Extended self-test routine
recommended polling time:        ( 438) minutes.
Conveyance self-test routine
recommended polling time:        (   5) minutes.
SCT capabilities:              (0x3039) SCT Status supported.
SCT Error Recovery Control supported.
SCT Feature Control supported.
SCT Data Table supported.

SMART Attributes Data Structure revision number: 16
Vendor Specific SMART Attributes with Thresholds:
ID# ATTRIBUTE_NAME          FLAG     VALUE WORST THRESH TYPE      UPDATED  WHEN_FAILED RAW_VALUE
1 Raw_Read_Error_Rate     0x002f   200   200   051    Pre-fail  Always       -       0
3 Spin_Up_Time            0x0027   205   203   021    Pre-fail  Always       -       2708
4 Start_Stop_Count        0x0032   100   100   000    Old_age   Always       -       150
5 Reallocated_Sector_Ct   0x0033   200   200   140    Pre-fail  Always       -       0
7 Seek_Error_Rate         0x002e   200   200   000    Old_age   Always       -       0
9 Power_On_Hours          0x0032   083   083   000    Old_age   Always       -       12969
10 Spin_Retry_Count        0x0032   100   100   000    Old_age   Always       -       0
11 Calibration_Retry_Count 0x0032   100   100   000    Old_age   Always       -       0
12 Power_Cycle_Count       0x0032   100   100   000    Old_age   Always       -       123
192 Power-Off_Retract_Count 0x0032   200   200   000    Old_age   Always       -       97
193 Load_Cycle_Count        0x0032   200   200   000    Old_age   Always       -       161
194 Temperature_Celsius     0x0022   114   093   000    Old_age   Always       -       33
196 Reallocated_Event_Count 0x0032   200   200   000    Old_age   Always       -       0
197 Current_Pending_Sector  0x0032   200   200   000    Old_age   Always       -       0
198 Offline_Uncorrectable   0x0030   100   253   000    Old_age   Offline      -       0
199 UDMA_CRC_Error_Count    0x0032   200   200   000    Old_age   Always       -       0
200 Multi_Zone_Error_Rate   0x0008   200   200   000    Old_age   Offline      -       0

SMART Error Log Version: 1
No Errors Logged

SMART Self-test log structure revision number 1
Num  Test_Description    Status                  Remaining  LifeTime(hours)  LBA_of_first_error

# 1  Short offline       Completed without error       00%     12948         -
# 2  Short offline       Completed without error       00%     12924         -
# 3  Short offline       Completed without error       00%     12900         -
# 4  Short offline       Completed without error       00%     12878         -
# 5  Short offline       Completed without error       00%     12855         -
# 6  Short offline       Completed without error       00%     12835         -
# 7  Short offline       Completed without error       00%     12807         -
# 8  Short offline       Completed without error       00%     12783         -
# 9  Short offline       Completed without error       00%     12759         -
#10  Short offline       Completed without error       00%     12735         -
#11  Short offline       Completed without error       00%     12711         -
#12  Short offline       Completed without error       00%     12687         -
#13  Short offline       Completed without error       00%     12663         -
#14  Short offline       Completed without error       00%     12639         -
#15  Short offline       Completed without error       00%     12626         -
#16  Short offline       Completed without error       00%     12543         -
#17  Extended offline    Completed without error       00%     12529         -
#18  Short offline       Completed without error       00%     12519         -
#19  Short offline       Completed without error       00%     12495         -
#20  Short offline       Completed without error       00%     12471         -
#21  Short offline       Completed without error       00%     12448         -

SMART Selective self-test log data structure revision number 1
SPAN  MIN_LBA  MAX_LBA  CURRENT_TEST_STATUS
1        0        0  Not_testing
2        0        0  Not_testing
3        0        0  Not_testing
4        0        0  Not_testing
5        0        0  Not_testing
Selective self-test flags (0x0):
After scanning selected spans, do NOT read-scan remainder of disk.
If Selective self-test is pending on power-up, resume after 0 minute delay.

The above only provides legacy SMART information - try ā€˜smartctl -x’ for more

Zpool status after reboot:

pool: data-pool
state: ONLINE
status: One or more devices has experienced an error resulting in data
corruption.  Applications may be affected.
action: Restore the file in question if possible.  Otherwise restore the
entire pool from backup.
see: https://openzfs.github.io/openzfs-docs/msg/ZFS-8000-8A
scan: scrub repaired 1.51G in 04:07:29 with 361 errors on Tue Feb 17 14:22:23 2026
config:

    NAME                                      STATE     READ WRITE CKSUM
    data-pool                                 ONLINE       0     0     0
      raidz1-0                                ONLINE       0     0     0
        4ef5eff0-f52b-4058-bc4c-dbbdc4416f4b  ONLINE       0     0 3.20K
        f94d9511-92d3-433c-a9b1-92c2bbe6f6c8  ONLINE       0     0 3.61K
        2300bd5f-3068-4791-a5a4-3b8421c14229  ONLINE       0     0 3.61K

errors: Permanent errors have been detected in the following files:
    data-pool/Backups/ReplicationBussionessGlobal/Data Bussiness Global/Shop012@auto-2026-02-02_00-00:/Backups Mysql Tienda/rpi_backup.img.gz
    data-pool/Backups/ReplicationBussionessGlobal/Data Bussiness Global/Shop012@auto-2026-02-11_00-00:/Backups Mysql Tienda/rpi_backup.img.gz
    data-pool/Backups/ReplicationBussionessGlobal/Data Bussiness Global/Shop012@auto-2026-02-13_00-00:/Backups Mysql Tienda/rpi_backup.img.gz
    data-pool/Backups/ReplicationBussionessGlobal/Data Bussiness Global/Shop012@auto-2026-02-14_00-00:/Backups Mysql Tienda/rpi_backup.img.gz
    data-pool/Backups/ReplicationBussionessGlobal/Data Bussiness Global/Shop012@auto-2026-02-08_00-00:/Backups Mysql Tienda/rpi_backup.img.gz
    data-pool/Backups/ReplicationBussionessGlobal/Data Bussiness Global/Shop012@auto-2026-02-10_00-00:/Backups Mysql Tienda/rpi_backup.img.gz
    data-pool/Backups/ReplicationBussionessGlobal/Data Bussiness Global/Shop012@auto-2026-02-03_00-00:/Backups Mysql Tienda/rpi_backup.img.gz
    data-pool/Backups/ReplicationBussionessGlobal/Data Bussiness Global/Shop012@auto-2026-02-12_00-00:/Backups Mysql Tienda/rpi_backup.img.gz
    data-pool/Backups/ReplicationBussionessGlobal/Data Bussiness Global/Shop012@auto-2026-02-06_00-00:/Backups Mysql Tienda/rpi_backup.img.gz
    data-pool/Backups/ReplicationBussionessGlobal/Data Bussiness Global/Shop012@auto-2026-02-07_00-00:/Backups Mysql Tienda/rpi_backup.img.gz
    data-pool/Backups/ReplicationBussionessGlobal/Data Bussiness Global/Shop012@auto-2026-01-30_00-00:/Backups Mysql Tienda/rpi_backup.img.gz
    data-pool/Backups/ReplicationBussionessGlobal/Data Bussiness Global/Shop012@auto-2026-02-15_00-00:/Backups Mysql Tienda/rpi_backup.img.gz
    data-pool/Backups/ReplicationBussionessGlobal/Data Bussiness Global/Shop012@auto-2026-01-31_00-00:/Backups Mysql Tienda/rpi_backup.img.gz
    data-pool/Backups/ReplicationBussionessGlobal/Data Bussiness Global/Shop012@auto-2026-02-05_00-00:/Backups Mysql Tienda/rpi_backup.img.gz
    data-pool/Backups/ReplicationBussionessGlobal/Data Bussiness Global/Shop012@auto-2026-02-04_00-00:/Backups Mysql Tienda/rpi_backup.img.gz
    data-pool/Backups/ReplicationBussionessGlobal/Data Bussiness Global/Shop012@auto-2026-02-09_00-00:/Backups Mysql Tienda/rpi_backup.img.gz
    /mnt/data-pool/Backups/ReplicationBussionessGlobal/Data Bussiness Global/Shop012/Backups Mysql Tienda/rpi_backup.img.gz
    data-pool/Backups/ReplicationBussionessGlobal/Data Bussiness Global/Shop012@auto-2026-01-29_00-00:/Backups Mysql Tienda/rpi_backup.img.gz
    data-pool/Backups/ReplicationBussionessGlobal/Data Bussiness Global/Shop012@auto-2026-02-01_00-00:/Backups Mysql Tienda/rpi_backup.img.gz

Hi

Its rare I am able to offer any help with so many clever people on this forum - but just wanted to throw this out there, as it happened to me and has not been mentioned, and was a bugger for me to find.

Have you checked the heat sink and do you have some active cooling on your LSI HBA? They get very hot, very quick and will throw all sorts of errors across drives - mine caused random panics every few weeks as well.

In my case, I took off the heat sink, paste was rock hard - cleaned it, re-pasted, bolted it down tight and put a small fan on there - that was 10 years ago and no issues since

CC

1 Like

Hello!!!

I have all problematic disks connected to SATA motherboard directly to eliminate any LSI problem

Thank you!

smart and pool status after an hour (I start to delete corrupted files):slight_smile:

smartctl 7.4 2023-08-01 r5530 \[x86_64-linux-6.12.15-production+truenas\] (local build)
Copyright (C) 2002-23, Bruce Allen, Christian Franke, www.smartmontools.org

=== START OF INFORMATION SECTION ===
Model Family:     Western Digital Red Plus
Device Model:     WDC WD40EFPX-68C6CN0
Serial Number:    WD-WX12D63NNVRX
LU WWN Device Id: 5 0014ee 215f9b45d
Firmware Version: 81.00A81
User Capacity:    4,000,787,030,016 bytes \[4.00 TB\]
Sector Sizes:     512 bytes logical, 4096 bytes physical
Rotation Rate:    5400 rpm
Form Factor:      3.5 inches
Device is:        In smartctl database 7.3/6083
ATA Version is:   ACS-3 T13/2161-D revision 5
SATA Version is:  SATA 3.1, 6.0 Gb/s (current: 6.0 Gb/s)
Local Time is:    Thu Feb 19 22:54:31 2026 CET
SMART support is: Available - device has SMART capability.
SMART support is: Enabled

=== START OF READ SMART DATA SECTION ===
SMART overall-health self-assessment test result: PASSED

General SMART Values:
Offline data collection status:  (0x00) Offline data collection activity
was never started.
Auto Offline Data Collection: Disabled.
Self-test execution status:      (   0) The previous self-test routine completed
without error or no self-test has ever
been run.
Total time to complete Offline
data collection:                (42120) seconds.
Offline data collection
capabilities:                    (0x7b) SMART execute Offline immediate.
Auto Offline data collection on/off support.
Suspend Offline collection upon new
command.
Offline surface scan supported.
Self-test supported.
Conveyance Self-test supported.
Selective Self-test supported.
SMART capabilities:            (0x0003) Saves SMART data before entering
power-saving mode.
Supports SMART auto save timer.
Error logging capability:        (0x01) Error logging supported.
General Purpose Logging supported.
Short self-test routine
recommended polling time:        (   2) minutes.
Extended self-test routine
recommended polling time:        ( 438) minutes.
Conveyance self-test routine
recommended polling time:        (   5) minutes.
SCT capabilities:              (0x3039) SCT Status supported.
SCT Error Recovery Control supported.
SCT Feature Control supported.
SCT Data Table supported.

SMART Attributes Data Structure revision number: 16
Vendor Specific SMART Attributes with Thresholds:
ID# ATTRIBUTE_NAME          FLAG     VALUE WORST THRESH TYPE      UPDATED  WHEN_FAILED RAW_VALUE
1 Raw_Read_Error_Rate     0x002f   200   200   051    Pre-fail  Always       -       0
3 Spin_Up_Time            0x0027   205   203   021    Pre-fail  Always       -       2708
4 Start_Stop_Count        0x0032   100   100   000    Old_age   Always       -       150
5 Reallocated_Sector_Ct   0x0033   200   200   140    Pre-fail  Always       -       0
7 Seek_Error_Rate         0x002e   200   200   000    Old_age   Always       -       0
9 Power_On_Hours          0x0032   083   083   000    Old_age   Always       -       12970
10 Spin_Retry_Count        0x0032   100   100   000    Old_age   Always       -       0
11 Calibration_Retry_Count 0x0032   100   100   000    Old_age   Always       -       0
12 Power_Cycle_Count       0x0032   100   100   000    Old_age   Always       -       123
192 Power-Off_Retract_Count 0x0032   200   200   000    Old_age   Always       -       97
193 Load_Cycle_Count        0x0032   200   200   000    Old_age   Always       -       161
194 Temperature_Celsius     0x0022   114   093   000    Old_age   Always       -       33
196 Reallocated_Event_Count 0x0032   200   200   000    Old_age   Always       -       0
197 Current_Pending_Sector  0x0032   200   200   000    Old_age   Always       -       0
198 Offline_Uncorrectable   0x0030   100   253   000    Old_age   Offline      -       0
199 UDMA_CRC_Error_Count    0x0032   200   200   000    Old_age   Always       -       0
200 Multi_Zone_Error_Rate   0x0008   200   200   000    Old_age   Offline      -       0

SMART Error Log Version: 1
No Errors Logged

SMART Self-test log structure revision number 1
Num  Test_Description    Status                  Remaining  LifeTime(hours)  LBA_of_first_error

# 1  Short offline       Completed without error       00%     12948         -
# 2  Short offline       Completed without error       00%     12924         -
# 3  Short offline       Completed without error       00%     12900         -
# 4  Short offline       Completed without error       00%     12878         -
# 5  Short offline       Completed without error       00%     12855         -
# 6  Short offline       Completed without error       00%     12835         -
# 7  Short offline       Completed without error       00%     12807         -
# 8  Short offline       Completed without error       00%     12783         -
# 9  Short offline       Completed without error       00%     12759         -
#10  Short offline       Completed without error       00%     12735         -
#11  Short offline       Completed without error       00%     12711         -
#12  Short offline       Completed without error       00%     12687         -
#13  Short offline       Completed without error       00%     12663         -
#14  Short offline       Completed without error       00%     12639         -
#15  Short offline       Completed without error       00%     12626         -
#16  Short offline       Completed without error       00%     12543         -
#17  Extended offline    Completed without error       00%     12529         -
#18  Short offline       Completed without error       00%     12519         -
#19  Short offline       Completed without error       00%     12495         -
#20  Short offline       Completed without error       00%     12471         -
#21  Short offline       Completed without error       00%     12448         -

SMART Selective self-test log data structure revision number 1
SPAN  MIN_LBA  MAX_LBA  CURRENT_TEST_STATUS
1        0        0  Not_testing
2        0        0  Not_testing
3        0        0  Not_testing
4        0        0  Not_testing
5        0        0  Not_testing
Selective self-test flags (0x0):
After scanning selected spans, do NOT read-scan remainder of disk.
If Selective self-test is pending on power-up, resume after 0 minute delay.

The above only provides legacy SMART information - try ā€˜smartctl -x’ for more
pool: data-pool
state: ONLINE
status: One or more devices has experienced an error resulting in data
corruption.  Applications may be affected.
action: Restore the file in question if possible.  Otherwise restore the
entire pool from backup.
see: https://openzfs.github.io/openzfs-docs/msg/ZFS-8000-8A
scan: scrub repaired 1.51G in 04:07:29 with 361 errors on Tue Feb 17 14:22:23 2026
config:

    NAME                                      STATE     READ WRITE CKSUM
    data-pool                                 ONLINE       0     0     0
      raidz1-0                                ONLINE       0     0     0
        4ef5eff0-f52b-4058-bc4c-dbbdc4416f4b  ONLINE       0     0 35.4K
        f94d9511-92d3-433c-a9b1-92c2bbe6f6c8  ONLINE       0     0 37.9K
        2300bd5f-3068-4791-a5a4-3b8421c14229  ONLINE       0     0 37.9K

errors: Permanent errors have been detected in the following files:
/mnt/data-pool/Backups/ReplicationBussionessGlobal/Data Bussiness Global/Shop012/Backups Mysql Tienda/rpi_backup.img.gz

There is something seriously wrong with your pool or system.

Your checksum errors are indeed climbing at a rate of thousands per hour.

I believe this is either a rare or unknown bug with OpenZFS or there’s an underlying issue that is incorrectly calculating the checksums of your blocks.

Can you manually inspect a random sample of files? Do they appear garbled or corrupt, or do they appear fine? Text files and images will be obvious if they are corrupted or not.

Yes it is!!! I have about a million checksum errors per day in all of 3 disk of this pool!

All data except some snapshots are correct! 5TB are ok!!!

I cant find what is causing the problem.

I“m following joeschmuck steps! I“m running scrub at the moment! 8 hours to wait!!! Tomorrow morning I will update the results!

You are not alone here, many of us, including myself, started with a normal desktop computer. Why would I want to buy a server board if I didn’t know I’d really like TrueNAS.

Thanks for the specs.

Was this at least 5 complete passes? I think that if you had a memory problem, due to the corruption level, you would find a memory error fairly quick, but I’m just asking the question. And if this is the only pool affected, I don’t think it is RAM.

Hopefully those files are all deleted.

And I will fix the format of your data you posted. Use the </> in the top line of the editor to encapsulate your text dumps.

And no matter what you do, just ensure you take your time and try to understand what is happening. I am not a ZFS guru, far from it, but I will answer the question ā€œWhat would Joe do?ā€

Good luck, hope to see better results in the morning.

Did you upgrade TrueNAS recently?

What version of TrueNAS?

What version of ZFS?
zfs --version

Did you ever ā€œupgradeā€ your pool? (Upgrading a pool is unrelated to upgrading TrueNAS or ZFS.)

You might have to downgrade to an older boot environment if this issue is due to a new bug in OpenZFS that is triggered by multiple factors coming together.

I dont know!! I only chech no errors and shutdown!!!:slight_smile:

ok!! I“m so sorry!

Really thanks for your help! At the moment scrub is running and checksum errors keep its climbing rate!!!:slight_smile:

Tomorrow will update!!

Can you provide the following information before you leave?

about two months ago!

25.04.2.6

zfs-2.3.0-1
zfs-kmod-2.3.0-1

NO! I donĀ“t know that is possible…??? What does the process entail?

When did this problem begin?

one week ago

Out of curiosity, would you the think possibly the 8th which is a Sunday.

One more thing to put into the back of your mind after this proble is resolved. I recommend you test your drives with a daily Short test and a weekly Long test. If you had 18TB drives then that would change a little bit but 4TB drives complete a long test fairly quickly. 18TB or larger can take almost a week to test. But I’m not telling you to run these test for this troubleshooting.

I dont know but… tomorrow will check my mail. There I could find first email alerting about the pool issue!

Perfect! I will follow your recomendations!

Thanks again!