You’ve been scammed. The drive had been in use for 21k hours more than advertised. 2 years and a half.
1 Like
Thanks folks
I will contact Seagate
Now to answer your specific question… Once you have setup the script, it will not automatically change anything. If drives change, that would be due to you including or removing drives on your system.
Thanks for the info. So now that I have made some adjustments to the SMART Tasks in TrueNAS, Multi-Report won’t change them?
Multi-Report will manage Multi-Report fine. The Drive_Selftest script (part of Multi-Report) scans every drive in the system and will test based off of the settings. For example, if you use the default to perform a Short test each time the script is run (preferably daily) then a Short test will be run on all drives, regardless of if they were recently added or not. And if you used the default of once a week Long testing, it will test each drive once a week, AGAIN provided the script is run daily. Running this script daily is important or some drives will be skipped if they were scheduled on that day.
My comment was for the people who use TrueNAS to schedule SMART testing. If you select All Disks in the TrueNAS setup then it “should” test all drives. However currently if you have NVMe drive, TrueNAS does not actually support SMART testing even though it is listed in the GUI. Maybe 25.04 final will support it but as of now, it does not. Multi-Report/Drive_Selftest does support NVMe drive testing, provided the NVMe drives actually do support SMART testing. Some drives do not if they are built prior to the v1.4 NVMe Spec.
Hope that clear everything up.
I plan to release a new version of both scripts soon. If you have any USB drives (not “Flash” drives) that previously could not be tested, you might be able to test those now. If not then we can work together to see if it is even possible and if it is, then I might be able to update the script to add that one. It was something I kind of accidentally did to help out a person and it became an option now. With that said, if the USB interface does not pass the commands, I cannot magically make it work. Right now I’m figuring out how to make this a user updatable function so I do not need to push out an update each time for every variation. I could tell you to edit line XYZ but with over 10,000 lines, why risk it.
No worries, thanks for the explanation.
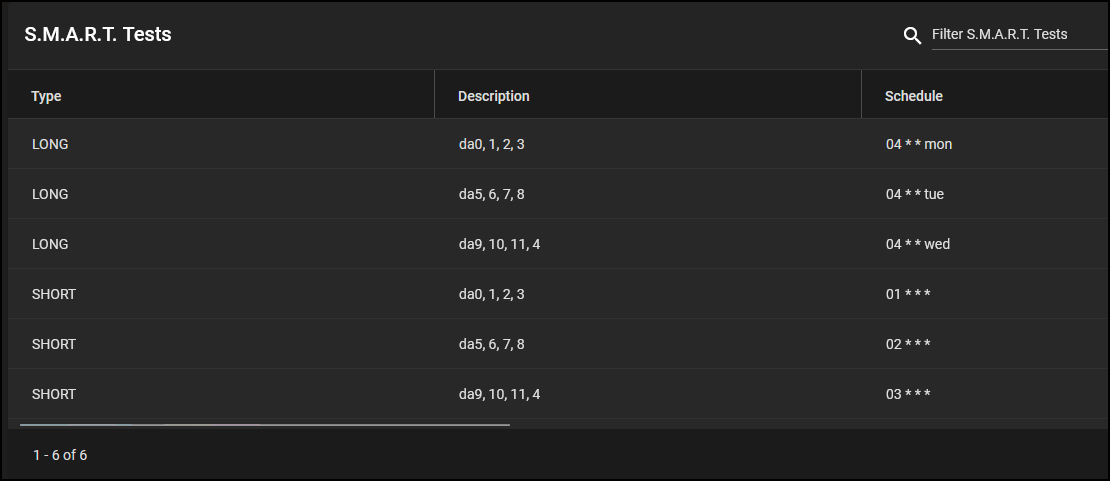
So at the moment I am running the Multi-Report daily, so in that case should I remove these tasks from TrueNAS:
@joeschmuck I’m unsure if you will check GitHub, so I also put the link here.
edit: I can’t add a link. please take a look at “Multi-Report/issues/20”
Yes, I get an email from Github and then I go check. I would have answered sooner but I just woke up.
P.S. Welcome to the TrueNAS forums. I hope your time here is positive.
1 Like
I’m a little puzzled. My SSDs are SMART tested by TrueNAS (core 13.1). Yesterday, the mail I get from Multi-Report, showed this:
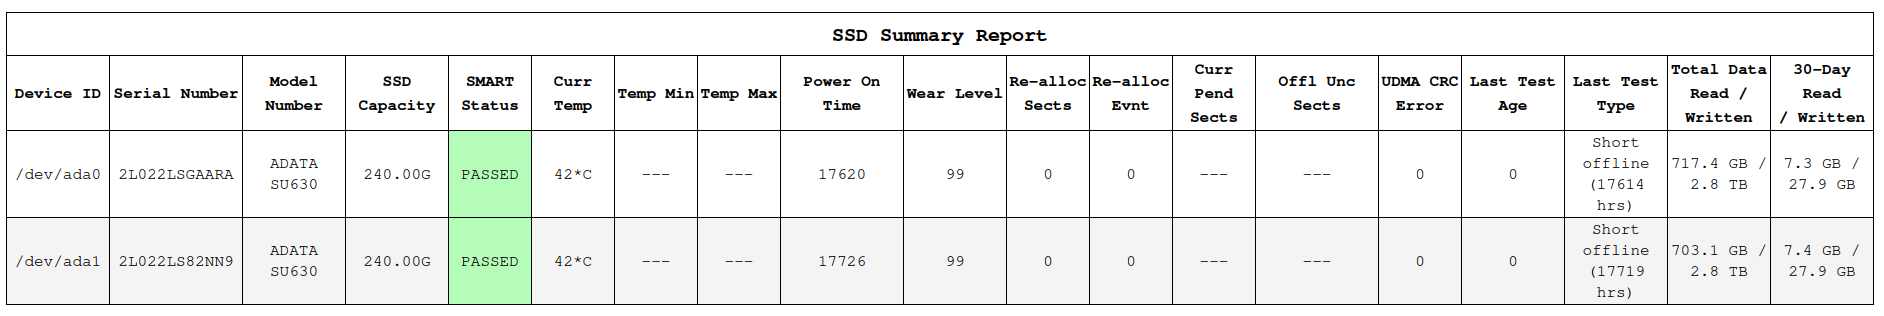
Today’s mail showed this:

Unless the laws of time changed while I was asleep, I can’t really see how “last test age” could go from zero to 49 overnight. The two SSDs in question are my boot pool, organised as a mirrored pair.
No worries, thanks for the explanation.
So at the moment I am running the Multi-Report daily, so in that case should I remove these tasks from TrueNAS:
@joeschmuck is there an straightforward way to disable the SMART tests in Multi-Report if I already have them scheduled in TrueNAS?
Yes there is. Oh, you want me to tell you how.
Run the script using multi_report.sh -config and select option D. Then select Option E and move forward from there.
Or you could manually edit the multi_report_config.txt file and change the line External_SMART_Testing="true" to false.
This will disable all SMART testing by Multi-Report.
@unseen That is very odd. Do you see what I see, very obvious. The reported hours on Power On Hours is not the same as in the Last Test Age. What I don’t understand is why it dropped 1192 hours. There is apparently some calculation error.
Could you run the script again to verify if you still have this problem? If you do, please send me a dump using -dump emailextra and hopefully I will see the cause. If you cannot recreate the error, please forward me the problematic email to joeschmuck2023@hotmail.com so I can figure out what went wrong and fix it before the next version comes out.
Thanks!
Very interesting. Without me changing anything, today’s report was normal.
Let’s just assume this was a random, cosmic ray problem. (Although my ECC DRAM should rule that out…)
If I see it again, I’ll try reproducing the problem.
If you have the text still, would you send it my way? Cut and paste in a message here is good. I need all the text as well. I will try to diplicate it by faking out the drive values and the computer date and time. It usually happens when certain things align. It is crazy had to track these things down. I blame BASH.
@Deeda Thanks for the data, Investigating.
I forwarded the e-mail to you yesterday. Hopefully it arrived?
Today’s weekly report has, for the first time ever, a title of
WARNING SMART Testing Results for TrueNAS WARNING
and it refers to my temporary Crucial CT240BX500 SSD.
This single SSD, mounted in an external SATA/USB caddy, contains non-critical data; last week (Thurs 20th) it accidentally lost power during a short power cut whereas my UPS supported my TrueNAS system. Whilst I expect this caused the problems shown below, the multi-report output for Fri 21st showed no problems and the wear level for this SSD said 16.
However, a week on and today’s multi-report says
**WARNING LOG FILE
Drive: 2402E88E5F48 - Wear Level = 6%**
and the SMART assessment for this drive says
########## SMART status report for sdd drive (CT240BX500SSD1 : 2402E88E5F48) ##########

SMART overall-health self-assessment test result: PASSED

ID# ATTRIBUTE_NAME          FLAG     VALUE WORST THRESH TYPE      UPDATED  WHEN_FAILED RAW_VALUE
  1 Raw_Read_Error_Rate     0x002f   100   100   000    Pre-fail  Always       -       0
  5 Reallocate_NAND_Blk_Cnt 0x0032   100   100   010    Old_age   Always       -       0
  9 Power_On_Hours          0x0032   100   100   000    Old_age   Always       -       5209
 12 Power_Cycle_Count       0x0032   100   100   000    Old_age   Always       -       26
171 Program_Fail_Count      0x0032   100   100   000    Old_age   Always       -       0
172 Erase_Fail_Count        0x0032   100   100   000    Old_age   Always       -       0
173 Ave_Block-Erase_Count   0x0032   006   006   000    Old_age   Always       -       941
174 Unexpect_Power_Loss_Ct  0x0032   100   100   000    Old_age   Always       -       24
180 Unused_Reserve_NAND_Blk 0x0033   100   100   000    Pre-fail  Always       -       12
183 SATA_Interfac_Downshift 0x0032   100   100   000    Old_age   Always       -       0
184 Error_Correction_Count  0x0032   100   100   000    Old_age   Always       -       0
187 Reported_Uncorrect      0x0032   100   100   000    Old_age   Always       -       0
194 Temperature_Celsius     0x0022   058   053   000    Old_age   Always       -       42 (Min/Max 23/47)
196 Reallocated_Event_Count 0x0032   100   100   000    Old_age   Always       -       0
197 Current_Pending_ECC_Cnt 0x0032   100   100   000    Old_age   Always       -       0
198 Offline_Uncorrectable   0x0030   100   100   000    Old_age   Offline      -       0
199 UDMA_CRC_Error_Count    0x0032   100   100   000    Old_age   Always       -       0
202 Percent_Lifetime_Remain 0x0030   006   006   001    Old_age   Offline      -       94
206 Write_Error_Rate        0x000e   100   100   000    Old_age   Always       -       0
210 Success_RAIN_Recov_Cnt  0x0032   100   100   000    Old_age   Always       -       0
246 Total_LBAs_Written      0x0032   100   100   000    Old_age   Always       -       27022695455
247 Host_Program_Page_Count 0x0032   100   100   000    Old_age   Always       -       844459232
248 FTL_Program_Page_Count  0x0032   100   100   000    Old_age   Always       -       15362457072
249 Unkn_CrucialMicron_Attr 0x0032   100   100   000    Old_age   Always       -       0
250 Read_Error_Retry_Rate   0x0032   100   100   000    Old_age   Always       -       0
251 Unkn_CrucialMicron_Attr 0x0032   100   100   000    Old_age   Always       -       3100253548
252 Unkn_CrucialMicron_Attr 0x0032   100   100   000    Old_age   Always       -       84
253 Unkn_CrucialMicron_Attr 0x0032   100   100   000    Old_age   Always       -       0
254 Unkn_CrucialMicron_Attr 0x0032   100   100   000    Old_age   Always       -       0
223 Unkn_CrucialMicron_Attr 0x0032   100   100   000    Old_age   Always       -       2
Last week’s multi-report for the same SSD said
SMART overall-health self-assessment test result: PASSED

ID# ATTRIBUTE_NAME          FLAG     VALUE WORST THRESH TYPE      UPDATED  WHEN_FAILED RAW_VALUE
  1 Raw_Read_Error_Rate     0x002f   100   100   000    Pre-fail  Always       -       0
  5 Reallocate_NAND_Blk_Cnt 0x0032   100   100   010    Old_age   Always       -       0
  9 Power_On_Hours          0x0032   100   100   000    Old_age   Always       -       5045
 12 Power_Cycle_Count       0x0032   100   100   000    Old_age   Always       -       26
171 Program_Fail_Count      0x0032   100   100   000    Old_age   Always       -       0
172 Erase_Fail_Count        0x0032   100   100   000    Old_age   Always       -       0
173 Ave_Block-Erase_Count   0x0032   016   016   000    Old_age   Always       -       848
174 Unexpect_Power_Loss_Ct  0x0032   100   100   000    Old_age   Always       -       24
180 Unused_Reserve_NAND_Blk 0x0033   100   100   000    Pre-fail  Always       -       12
183 SATA_Interfac_Downshift 0x0032   100   100   000    Old_age   Always       -       0
184 Error_Correction_Count  0x0032   100   100   000    Old_age   Always       -       0
187 Reported_Uncorrect      0x0032   100   100   000    Old_age   Always       -       0
194 Temperature_Celsius     0x0022   058   053   000    Old_age   Always       -       42 (Min/Max 23/47)
196 Reallocated_Event_Count 0x0032   100   100   000    Old_age   Always       -       0
197 Current_Pending_ECC_Cnt 0x0032   100   100   000    Old_age   Always       -       0
198 Offline_Uncorrectable   0x0030   100   100   000    Old_age   Offline      -       0
199 UDMA_CRC_Error_Count    0x0032   100   100   000    Old_age   Always       -       0
202 Percent_Lifetime_Remain 0x0030   016   016   001    Old_age   Offline      -       84
206 Write_Error_Rate        0x000e   100   100   000    Old_age   Always       -       0
210 Success_RAIN_Recov_Cnt  0x0032   100   100   000    Old_age   Always       -       0
246 Total_LBAs_Written      0x0032   100   100   000    Old_age   Always       -       24937024703
247 Host_Program_Page_Count 0x0032   100   100   000    Old_age   Always       -       779282021
248 FTL_Program_Page_Count  0x0032   100   100   000    Old_age   Always       -       13844826432
249 Unkn_CrucialMicron_Attr 0x0032   100   100   000    Old_age   Always       -       0
250 Read_Error_Retry_Rate   0x0032   100   100   000    Old_age   Always       -       0
251 Unkn_CrucialMicron_Attr 0x0032   100   100   000    Old_age   Always       -       1484866081
252 Unkn_CrucialMicron_Attr 0x0032   100   100   000    Old_age   Always       -       73
253 Unkn_CrucialMicron_Attr 0x0032   100   100   000    Old_age   Always       -       0
254 Unkn_CrucialMicron_Attr 0x0032   100   100   000    Old_age   Always       -       0
223 Unkn_CrucialMicron_Attr 0x0032   100   100   000    Old_age   Always       -       2
My assessment, then, is that the outage did something to the SSD which has increased the wear level but seems not to have perturbed anything else.
Is there anything I should now be doing to the SSD in terms of running a script on it, or stress testing it, or replacing it (whilst remembering that it is not a critical part of my system and it exists merely for experimental/hobby reasons and with the full knowledge that singe drives, USB connected, are a bad idea) ?
(My main backing store for my actual “valuable” data is in a 4 drive RAIDZ2 configuration with a 3-2-1 backup protocol in place).
@E_B The drive appears to be fine. 94% life remaining.
I am sending you a seperate message to collect a little data to find out what the script hit on to make it think you only have 6% left. I have an idea but I need to prove it and then provide a possible solution.
Great! I will try do anything I can - just ask.
Are you sure?
In the second SMART report, the one from a week earlier, the raw value was 84. If this number is meant to be the % remaining, why is it going up and not down over time?
Got the data and just now had time to look at it.
Here is what is happening:
Examine ID 202 “Percent_Lifetime_Remain”
202 Percent_Lifetime_Remain 0x0030 006 006 001 Old_age Offline - 94
Raw value is 94 and with a title of “Percent Lifetime Remaining” we believe it is how much life remains. Sounds good, right? Based on this and the other values (lack of errors) I have to make the judgement call that the drive is actually 94% good and 6% used.
But then you look at the VALUE=006, WORST=006, and THRESH=1 (what the script looks at and has been fairly reliable over the years).
THRESH is the point at which a failure is expected. the closer we get to 1, the worse we are.
WORST is the worst value recorded.
VALUE is the current value.
If Thresh is a low number then Value being a low number means we are on the wrong side of good. Typically I see Thresh for Wear Level set at 25 or 75, never 100 or 1 for this value so it is a bit surprising to think this is a valid piece of data for this drive.
The end result is the data contradicts itself.
As for the script, there are many different ways a SSD reports wear level, too many, and I had to choose an order on which ones to look for first. If one works, that is the value we use. Sometimes it is wrong, but that is why I have the Custom Drive Configuration in the script. The end user can make an adjustment for an individual drive.
In this situation, you have one option which would work to fix this, use reversing the VALUE (100-VALUE=result)
This is actually very easy to do using the advanced configuration page, but to offer a very fast way I will just provide the part needed to be inserted into the multi_report_config.txt file:
Custom_Drives_List="2402E88E5F48:55:65:0:9:0:0:5:5:100:5:100:2:0:100:r:d"
My advice, use the above value and watch the wear level. If it moves oddly, let me know. I cannot account for every odd decision a manufacturer makes but I try to provide a work around.
Great work - thanks! I have implemented it and I’ll watch to see what happens over the next few weeks.
It’s puzzle to know why the value seems to have changed rapidly during this last week (and I note what you said about the power cut being an unlikely culprit). I have a couple of other Crucial SSDs in a different machine and I can run smartctl on them to see what they say, if that would help in any way. Crucial is made by Micron which is a well known make so I would presume commonality between my various SSDs.
Thanks for this help and, again, let me know if I can do anything to help you.