Dear Community
I have been dealing with a dreading problem for the last days and I am at the end of the rabbit hole and close to giving up. The community here is my last hope.
We are a small film post-production shop and have been working with two TrueNAS servers for the last years. One of them holds the archive and daily backups of the 2nd server. The 2nd one (called Workhorses and center of the question here) is for recent projects.
Specs below:
Workhorse:
Supermicro SC848 CSE-848
4x Intel Xeon E5-4650, 8x 2.70GHz
RAM 512GB ECC DDR3 PC12800 (16x 32GB)
Motherboard Supermicro X9QRI-F
BPN-SAS2-846EL1 Expander Backplane
24x 10TB Seagate Ironwolf (mix of Pro and non Pro)
SAS2008 HBA in IT mode (Broadcom / LSI SAS2008 PCI-Express Fusion-MPT SAS-2 [Falcon] (rev 03)
4x 2TB ADAT M.2 NVME on Qnap PCIe 3.0x8 card (PCIe switch)
Intel X540 dual port 10GbE NIC
Intell XL710 40Gbe NIC
12 x two-way mirror HDD pool
4 x stripe NVME pool
TrueNAS Scale Dragonfish-24.04.2.1

Archive server (just for comparison)
Same case, CPU, RAM, MB, Expander
24X 16TB Seagate Exos
16X 16TB Seagate Exos in extra supermicro JBOD
Intel X540 10GbE NIC
LSI SAS2308 PCI-Express Fusion-MPT SAS-2 (rev 05)
LSI SAS2308 PCI-Express Fusion-MPT SAS-2 (rev 01)
TrueNAS Scale Dragonfish-24.04.2.1
We had somewhat accepted that the TrueNAS servers are not that fast, worked with Thunderbolt NMVEs as local caches and been thinking of upgrading to an all flash NVME server. Recently we decided to give it another go to improve performance and reformatted the 24xHDD pool on Workhorse from 3 x RAIDZ2 to a pool of 12 striped mirrors.
After reformatting the pool I did some extensive speed testing and isolated the core of the problem. I believe that the problem has already existed for a longer time and was the cause for the percieved slowness of the server but was just not so obvious in daily operations:
Write speeds are good and as expected but the server’s read speed directly from disk and NVME is mysteriously capped at around 300MB/s.
On the NVME pool (we used them as L2ARC, which didn’t help, so for now they are just a scratch for testing and some unimportant stuff like VMs)
First FIO run.
root@workhorse[~]# fio --name=write_test --rw=write --bs=1M --ioengine=posixaio --iodepth=32 --size=30G --filename=/mnt/nvme_scratch/nvme_benchmark/fio

write_test: (g=0): rw=write, bs=(R) 1024KiB-1024KiB, (W) 1024KiB-1024KiB, (T) 1024KiB-1024KiB, ioengine=posixaio, iodepth=32
fio-3.33
Starting 1 process
write_test: Laying out IO file (1 file / 30720MiB)
Jobs: 1 (f=1): [W(1)][100.0%][w=2461MiB/s][w=2461 IOPS][eta 00m:00s]
write_test: (groupid=0, jobs=1): err= 0: pid=2502770: Thu Sep 19 08:25:51 2024
  write: IOPS=2265, BW=2265MiB/s (2376MB/s)(30.0GiB/13560msec); 0 zone resets
    slat (usec): min=8, max=7335, avg=120.10, stdev=162.01
    clat (usec): min=1332, max=64716, avg=13607.76, stdev=4930.45
     lat (usec): min=1347, max=64748, avg=13727.86, stdev=4996.25
    clat percentiles (usec):
     |  1.00th=[ 8848],  5.00th=[ 9634], 10.00th=[10159], 20.00th=[10814],
     | 30.00th=[11207], 40.00th=[11731], 50.00th=[12125], 60.00th=[12649],
     | 70.00th=[13304], 80.00th=[14746], 90.00th=[19530], 95.00th=[23462],
     | 99.00th=[33162], 99.50th=[37487], 99.90th=[58459], 99.95th=[61080],
     | 99.99th=[64226]
   bw (  MiB/s): min= 1182, max= 2697, per=100.00%, avg=2267.75, stdev=357.55, samples=27
   iops        : min= 1182, max= 2697, avg=2267.70, stdev=357.56, samples=27
  lat (msec)   : 2=0.01%, 4=0.01%, 10=8.40%, 20=82.20%, 50=9.22%
  lat (msec)   : 100=0.16%
  cpu          : usr=28.25%, sys=0.57%, ctx=6637, majf=0, minf=750
  IO depths    : 1=0.1%, 2=0.1%, 4=0.1%, 8=0.4%, 16=69.0%, 32=30.5%, >=64=0.0%
     submit    : 0=0.0%, 4=100.0%, 8=0.0%, 16=0.0%, 32=0.0%, 64=0.0%, >=64=0.0%
     complete  : 0=0.0%, 4=94.7%, 8=3.4%, 16=1.7%, 32=0.2%, 64=0.0%, >=64=0.0%
     issued rwts: total=0,30720,0,0 short=0,0,0,0 dropped=0,0,0,0
     latency   : target=0, window=0, percentile=100.00%, depth=32

Run status group 0 (all jobs):
  WRITE: bw=2265MiB/s (2376MB/s), 2265MiB/s-2265MiB/s (2376MB/s-2376MB/s), io=30.0GiB (32.2GB), run=13560-13560msec
root@workhorse[~]# fio --name=read_test --rw=read --bs=1M --ioengine=posixaio --iodepth=32 --size=30G --filename=/mnt/nvme_scratch/nvme_benchmark/fio

read_test: (g=0): rw=read, bs=(R) 1024KiB-1024KiB, (W) 1024KiB-1024KiB, (T) 1024KiB-1024KiB, ioengine=posixaio, iodepth=32
fio-3.33
Starting 1 process
Jobs: 1 (f=1): [R(1)][100.0%][r=1696MiB/s][r=1696 IOPS][eta 00m:00s]
read_test: (groupid=0, jobs=1): err= 0: pid=2503134: Thu Sep 19 08:26:33 2024
  read: IOPS=1673, BW=1674MiB/s (1755MB/s)(30.0GiB/18352msec)
    slat (nsec): min=132, max=296239, avg=1091.53, stdev=2362.97
    clat (usec): min=14217, max=37939, avg=19084.89, stdev=2561.71
     lat (usec): min=14220, max=37942, avg=19085.98, stdev=2561.77
    clat percentiles (usec):
     |  1.00th=[15533],  5.00th=[16581], 10.00th=[17171], 20.00th=[17957],
     | 30.00th=[18220], 40.00th=[18482], 50.00th=[18744], 60.00th=[19006],
     | 70.00th=[19268], 80.00th=[19530], 90.00th=[20579], 95.00th=[21890],
     | 99.00th=[33424], 99.50th=[34866], 99.90th=[36963], 99.95th=[37487],
     | 99.99th=[37487]
   bw (  MiB/s): min= 1164, max= 1972, per=100.00%, avg=1674.67, stdev=145.86, samples=36
   iops        : min= 1164, max= 1972, avg=1674.67, stdev=145.86, samples=36
  lat (msec)   : 20=86.85%, 50=13.15%
  cpu          : usr=1.40%, sys=0.66%, ctx=7683, majf=0, minf=54
  IO depths    : 1=0.1%, 2=0.1%, 4=0.1%, 8=25.0%, 16=50.0%, 32=25.0%, >=64=0.0%
     submit    : 0=0.0%, 4=100.0%, 8=0.0%, 16=0.0%, 32=0.0%, 64=0.0%, >=64=0.0%
     complete  : 0=0.0%, 4=97.5%, 8=0.1%, 16=0.0%, 32=2.5%, 64=0.0%, >=64=0.0%
     issued rwts: total=30720,0,0,0 short=0,0,0,0 dropped=0,0,0,0
     latency   : target=0, window=0, percentile=100.00%, depth=32

Run status group 0 (all jobs):
   READ: bw=1674MiB/s (1755MB/s), 1674MiB/s-1674MiB/s (1755MB/s-1755MB/s), io=30.0GiB (32.2GB), run=18352-18352msec
Everything as expected. Obviously reads from ARC. But then when I flush the cache.
root@workhorse[~]# echo 3 > /proc/sys/vm/drop_caches
root@workhorse[~]# fio --name=read_test --rw=read --bs=1M --ioengine=posixaio --iodepth=32 --size=30G --filename=/mnt/nvme_scratch/nvme_benchmark/fio

read_test: (g=0): rw=read, bs=(R) 1024KiB-1024KiB, (W) 1024KiB-1024KiB, (T) 1024KiB-1024KiB, ioengine=posixaio, iodepth=32
fio-3.33
Starting 1 process
Jobs: 1 (f=1): [R(1)][96.4%][r=1471MiB/s][r=1471 IOPS][eta 00m:04s]
read_test: (groupid=0, jobs=1): err= 0: pid=2503490: Thu Sep 19 08:28:41 2024
  read: IOPS=282, BW=283MiB/s (297MB/s)(30.0GiB/108639msec)
    slat (nsec): min=106, max=339332, avg=869.78, stdev=2485.37
    clat (msec): min=16, max=467, avg=113.12, stdev=91.14
     lat (msec): min=16, max=467, avg=113.12, stdev=91.14
    clat percentiles (msec):
     |  1.00th=[   20],  5.00th=[   21], 10.00th=[   21], 20.00th=[   22],
     | 30.00th=[   23], 40.00th=[   50], 50.00th=[  100], 60.00th=[  138],
     | 70.00th=[  180], 80.00th=[  203], 90.00th=[  234], 95.00th=[  271],
     | 99.00th=[  347], 99.50th=[  351], 99.90th=[  456], 99.95th=[  456],
     | 99.99th=[  460]
   bw (  KiB/s): min=65536, max=1578068, per=99.82%, avg=289046.12, stdev=337465.44, samples=217
   iops        : min=   64, max= 1541, avg=282.24, stdev=329.55, samples=217
  lat (msec)   : 20=3.61%, 50=36.63%, 100=9.95%, 250=43.06%, 500=6.74%
  cpu          : usr=0.19%, sys=0.09%, ctx=7698, majf=6, minf=100
  IO depths    : 1=0.1%, 2=0.1%, 4=0.1%, 8=25.0%, 16=50.0%, 32=25.0%, >=64=0.0%
     submit    : 0=0.0%, 4=100.0%, 8=0.0%, 16=0.0%, 32=0.0%, 64=0.0%, >=64=0.0%
     complete  : 0=0.0%, 4=97.5%, 8=0.1%, 16=0.0%, 32=2.5%, 64=0.0%, >=64=0.0%
     issued rwts: total=30720,0,0,0 short=0,0,0,0 dropped=0,0,0,0
     latency   : target=0, window=0, percentile=100.00%, depth=32

Run status group 0 (all jobs):
   READ: bw=283MiB/s (297MB/s), 283MiB/s-283MiB/s (297MB/s-297MB/s), io=30.0GiB (32.2GB), run=108639-108639msec
Ups. under 300MB/s
Same on the HDD pool:
root@workhorse[~]# fio --name=write_test --rw=write --bs=1M --ioengine=posixaio --iodepth=32 --size=30G --filename=/mnt/work/work_mirrored/fio

write_test: (g=0): rw=write, bs=(R) 1024KiB-1024KiB, (W) 1024KiB-1024KiB, (T) 1024KiB-1024KiB, ioengine=posixaio, iodepth=32
fio-3.33
Starting 1 process
write_test: Laying out IO file (1 file / 30720MiB)
Jobs: 1 (f=1): [W(1)][100.0%][w=859MiB/s][w=859 IOPS][eta 00m:00s]
write_test: (groupid=0, jobs=1): err= 0: pid=2512081: Thu Sep 19 08:43:37 2024
  write: IOPS=933, BW=933MiB/s (979MB/s)(30.0GiB/32920msec); 0 zone resets
    slat (usec): min=6, max=3536, avg=123.11, stdev=95.58
    clat (usec): min=1185, max=202407, avg=33266.26, stdev=10646.74
     lat (usec): min=1200, max=202483, avg=33389.37, stdev=10621.79
    clat percentiles (msec):
     |  1.00th=[   12],  5.00th=[   15], 10.00th=[   20], 20.00th=[   31],
     | 30.00th=[   33], 40.00th=[   34], 50.00th=[   35], 60.00th=[   36],
     | 70.00th=[   37], 80.00th=[   38], 90.00th=[   40], 95.00th=[   41],
     | 99.00th=[   58], 99.50th=[   81], 99.90th=[  201], 99.95th=[  201],
     | 99.99th=[  203]
   bw (  KiB/s): min=653312, max=2330624, per=100.00%, avg=956838.42, stdev=270267.97, samples=65
   iops        : min=  638, max= 2276, avg=934.40, stdev=263.94, samples=65
  lat (msec)   : 2=0.02%, 4=0.01%, 10=0.33%, 20=10.62%, 50=87.71%
  lat (msec)   : 100=0.96%, 250=0.37%
  cpu          : usr=11.96%, sys=0.17%, ctx=6302, majf=0, minf=2283
  IO depths    : 1=0.1%, 2=0.1%, 4=0.1%, 8=15.3%, 16=60.0%, 32=24.6%, >=64=0.0%
     submit    : 0=0.0%, 4=100.0%, 8=0.0%, 16=0.0%, 32=0.0%, 64=0.0%, >=64=0.0%
     complete  : 0=0.0%, 4=96.5%, 8=1.0%, 16=0.2%, 32=2.3%, 64=0.0%, >=64=0.0%
     issued rwts: total=0,30720,0,0 short=0,0,0,0 dropped=0,0,0,0
     latency   : target=0, window=0, percentile=100.00%, depth=32

Run status group 0 (all jobs):
  WRITE: bw=933MiB/s (979MB/s), 933MiB/s-933MiB/s (979MB/s-979MB/s), io=30.0GiB (32.2GB), run=32920-32920msec
root@workhorse[~]# fio --name=write_test --rw=read --bs=1M --ioengine=posixaio --iodepth=32 --size=30G --filename=/mnt/work/work_mirrored/fio

write_test: (g=0): rw=read, bs=(R) 1024KiB-1024KiB, (W) 1024KiB-1024KiB, (T) 1024KiB-1024KiB, ioengine=posixaio, iodepth=32
fio-3.33
Starting 1 process
Jobs: 1 (f=1): [R(1)][100.0%][r=1824MiB/s][r=1824 IOPS][eta 00m:00s]
write_test: (groupid=0, jobs=1): err= 0: pid=2512721: Thu Sep 19 08:44:36 2024
  read: IOPS=1719, BW=1719MiB/s (1803MB/s)(30.0GiB/17868msec)
    slat (nsec): min=111, max=377780, avg=1018.23, stdev=2619.13
    clat (usec): min=15395, max=40337, avg=18582.20, stdev=2262.85
     lat (usec): min=15398, max=40340, avg=18583.22, stdev=2262.90
    clat percentiles (usec):
     |  1.00th=[16057],  5.00th=[16450], 10.00th=[16909], 20.00th=[17171],
     | 30.00th=[17433], 40.00th=[17695], 50.00th=[17957], 60.00th=[18220],
     | 70.00th=[18482], 80.00th=[19530], 90.00th=[21627], 95.00th=[23987],
     | 99.00th=[26084], 99.50th=[28967], 99.90th=[36439], 99.95th=[36439],
     | 99.99th=[37487]
   bw (  MiB/s): min= 1228, max= 1856, per=99.87%, avg=1717.03, stdev=173.17, samples=35
   iops        : min= 1228, max= 1856, avg=1717.03, stdev=173.17, samples=35
  lat (msec)   : 20=83.13%, 50=16.87%
  cpu          : usr=1.28%, sys=0.70%, ctx=7689, majf=0, minf=58
  IO depths    : 1=0.1%, 2=0.1%, 4=0.1%, 8=25.0%, 16=50.0%, 32=25.0%, >=64=0.0%
     submit    : 0=0.0%, 4=100.0%, 8=0.0%, 16=0.0%, 32=0.0%, 64=0.0%, >=64=0.0%
     complete  : 0=0.0%, 4=97.5%, 8=0.1%, 16=0.0%, 32=2.5%, 64=0.0%, >=64=0.0%
     issued rwts: total=30720,0,0,0 short=0,0,0,0 dropped=0,0,0,0
     latency   : target=0, window=0, percentile=100.00%, depth=32

Run status group 0 (all jobs):
   READ: bw=1719MiB/s (1803MB/s), 1719MiB/s-1719MiB/s (1803MB/s-1803MB/s), io=30.0GiB (32.2GB), run=17868-17868msec
root@workhorse[~]# echo 3 > /proc/sys/vm/drop_caches
root@workhorse[~]# fio --name=write_test --rw=read --bs=1M --ioengine=posixaio --iodepth=32 --size=30G --filename=/mnt/work/work_mirrored/fio

write_test: (g=0): rw=read, bs=(R) 1024KiB-1024KiB, (W) 1024KiB-1024KiB, (T) 1024KiB-1024KiB, ioengine=posixaio, iodepth=32
fio-3.33
Starting 1 process
Jobs: 1 (f=1): [R(1)][100.0%][r=1664MiB/s][r=1664 IOPS][eta 00m:00s]
write_test: (groupid=0, jobs=1): err= 0: pid=2513142: Thu Sep 19 08:46:41 2024
  read: IOPS=317, BW=317MiB/s (333MB/s)(30.0GiB/96876msec)
    slat (nsec): min=110, max=328230, avg=874.89, stdev=2502.05
    clat (msec): min=15, max=790, avg=100.87, stdev=100.24
     lat (msec): min=15, max=790, avg=100.87, stdev=100.24
    clat percentiles (msec):
     |  1.00th=[   18],  5.00th=[   19], 10.00th=[   19], 20.00th=[   20],
     | 30.00th=[   22], 40.00th=[   28], 50.00th=[   57], 60.00th=[   94],
     | 70.00th=[  138], 80.00th=[  190], 90.00th=[  253], 95.00th=[  300],
     | 99.00th=[  376], 99.50th=[  409], 99.90th=[  785], 99.95th=[  785],
     | 99.99th=[  785]
   bw (  KiB/s): min=71680, max=1703936, per=99.26%, avg=322317.66, stdev=362856.26, samples=192
   iops        : min=   70, max= 1664, avg=314.74, stdev=354.31, samples=192
  lat (msec)   : 20=22.36%, 50=26.05%, 100=13.06%, 250=28.19%, 500=10.23%
  lat (msec)   : 1000=0.10%
  cpu          : usr=0.24%, sys=0.07%, ctx=7686, majf=6, minf=122
  IO depths    : 1=0.1%, 2=0.1%, 4=0.1%, 8=25.0%, 16=50.0%, 32=25.0%, >=64=0.0%
     submit    : 0=0.0%, 4=100.0%, 8=0.0%, 16=0.0%, 32=0.0%, 64=0.0%, >=64=0.0%
     complete  : 0=0.0%, 4=97.5%, 8=0.1%, 16=0.0%, 32=2.5%, 64=0.0%, >=64=0.0%
     issued rwts: total=30720,0,0,0 short=0,0,0,0 dropped=0,0,0,0
     latency   : target=0, window=0, percentile=100.00%, depth=32

Run status group 0 (all jobs):
   READ: bw=317MiB/s (333MB/s), 317MiB/s-317MiB/s (333MB/s-333MB/s), io=30.0GiB (32.2GB), run=96876-96876msec
root@workhorse[~]#
I tested several variations of the FIO command and never got substantially better read performance. Since I’m not an expert with FIO there might be a chance of a testing error. Please let me know if you see something wrong with my FIO options.
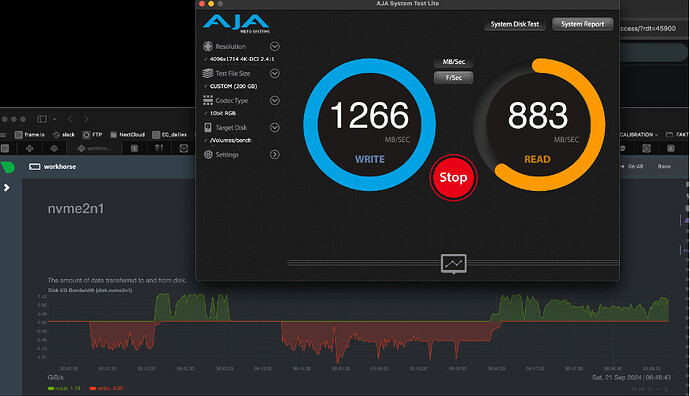
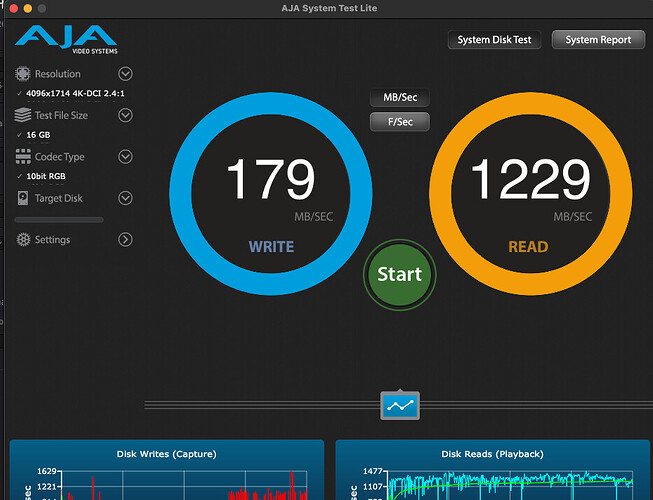
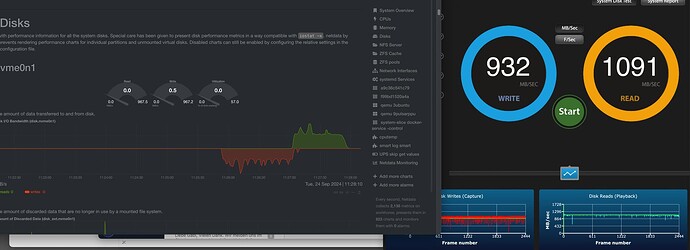
Yet I doubt that this is a testing error as I see the same problem everywhere also in testing over SMB with AJA Disk Test or in real world tests reading and writing video files with Davinci Resolve. Speeds are great writing and reading from ARC but as soon as files are read from disk the speeds drop.
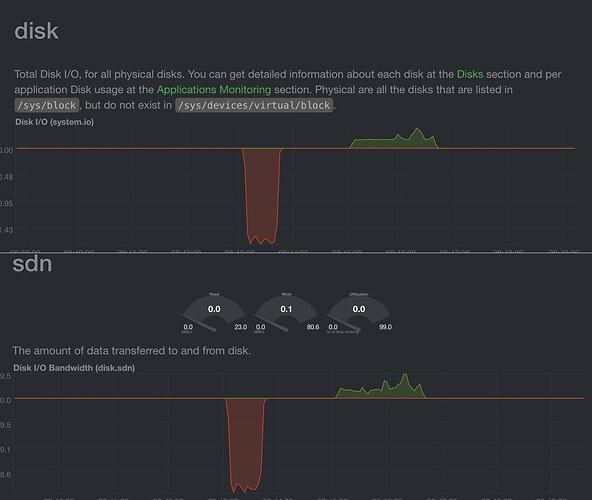
I also see this on iostat or using the Netdata monitor:
I tested the individual NVMEs with FIO and got around 1000MB/s per NVME.
Tested the HDDs also individually with hdparm and got around 250MB/s on each disk.
I did several long debugging sessions with ChatGPT, changed various settings like zfs_vdev_async_read_max_active but never saw any clear increase.
The pool/dataset settings are like this:
root@workhorse[~]# zfs get all nvme_scratch/nvme_benchmark
NAME PROPERTY VALUE SOURCE
nvme_scratch/nvme_benchmark type filesystem -
nvme_scratch/nvme_benchmark creation Wed Sep 18 9:20 2024 -
nvme_scratch/nvme_benchmark used 30.0G -
nvme_scratch/nvme_benchmark available 6.51T -
nvme_scratch/nvme_benchmark referenced 30.0G -
nvme_scratch/nvme_benchmark compressratio 1.00x -
nvme_scratch/nvme_benchmark mounted yes -
nvme_scratch/nvme_benchmark quota none default
nvme_scratch/nvme_benchmark reservation none default
nvme_scratch/nvme_benchmark recordsize 1M local
nvme_scratch/nvme_benchmark mountpoint /mnt/nvme_scratch/nvme_benchmark default
nvme_scratch/nvme_benchmark sharenfs off default
nvme_scratch/nvme_benchmark checksum fletcher4 local
nvme_scratch/nvme_benchmark compression off local
nvme_scratch/nvme_benchmark atime off inherited from nvme_scratch
nvme_scratch/nvme_benchmark devices on default
nvme_scratch/nvme_benchmark exec on default
nvme_scratch/nvme_benchmark setuid on default
nvme_scratch/nvme_benchmark readonly off default
nvme_scratch/nvme_benchmark zoned off default
nvme_scratch/nvme_benchmark snapdir hidden local
nvme_scratch/nvme_benchmark aclmode discard inherited from nvme_scratch
nvme_scratch/nvme_benchmark aclinherit discard inherited from nvme_scratch
nvme_scratch/nvme_benchmark createtxg 973050 -
nvme_scratch/nvme_benchmark canmount on default
nvme_scratch/nvme_benchmark xattr sa local
nvme_scratch/nvme_benchmark copies 1 local
nvme_scratch/nvme_benchmark version 5 -
nvme_scratch/nvme_benchmark utf8only off -
nvme_scratch/nvme_benchmark normalization none -
nvme_scratch/nvme_benchmark casesensitivity sensitive -
nvme_scratch/nvme_benchmark vscan off default
nvme_scratch/nvme_benchmark nbmand off default
nvme_scratch/nvme_benchmark sharesmb off default
nvme_scratch/nvme_benchmark refquota none default
nvme_scratch/nvme_benchmark refreservation none default
nvme_scratch/nvme_benchmark guid 15807764827476826872 -
nvme_scratch/nvme_benchmark primarycache all local
nvme_scratch/nvme_benchmark secondarycache all default
nvme_scratch/nvme_benchmark usedbysnapshots 0B -
nvme_scratch/nvme_benchmark usedbydataset 30.0G -
nvme_scratch/nvme_benchmark usedbychildren 0B -
nvme_scratch/nvme_benchmark usedbyrefreservation 0B -
nvme_scratch/nvme_benchmark logbias latency default
nvme_scratch/nvme_benchmark objsetid 34890 -
nvme_scratch/nvme_benchmark dedup off default
nvme_scratch/nvme_benchmark mlslabel none default
nvme_scratch/nvme_benchmark sync disabled local
nvme_scratch/nvme_benchmark dnodesize legacy default
nvme_scratch/nvme_benchmark refcompressratio 1.00x -
nvme_scratch/nvme_benchmark written 30.0G -
nvme_scratch/nvme_benchmark logicalused 30.0G -
nvme_scratch/nvme_benchmark logicalreferenced 30.0G -
nvme_scratch/nvme_benchmark volmode default default
nvme_scratch/nvme_benchmark filesystem_limit none default
nvme_scratch/nvme_benchmark snapshot_limit none default
nvme_scratch/nvme_benchmark filesystem_count none default
nvme_scratch/nvme_benchmark snapshot_count none default
nvme_scratch/nvme_benchmark snapdev hidden default
nvme_scratch/nvme_benchmark acltype posix inherited from nvme_scratch
nvme_scratch/nvme_benchmark context none default
nvme_scratch/nvme_benchmark fscontext none default
nvme_scratch/nvme_benchmark defcontext none default
nvme_scratch/nvme_benchmark rootcontext none default
nvme_scratch/nvme_benchmark relatime on default
nvme_scratch/nvme_benchmark redundant_metadata all default
nvme_scratch/nvme_benchmark overlay on default
nvme_scratch/nvme_benchmark encryption off default
nvme_scratch/nvme_benchmark keylocation none default
nvme_scratch/nvme_benchmark keyformat none default
nvme_scratch/nvme_benchmark pbkdf2iters 0 default
nvme_scratch/nvme_benchmark special_small_blocks 0 default
nvme_scratch/nvme_benchmark prefetch all default
nvme_scratch/nvme_benchmark org.truenas:managedby 192.168.178.25 local
nvme_scratch/nvme_benchmark org.freenas:description local
root@workhorse[~]# zfs get all work/work_mirrored
NAME PROPERTY VALUE SOURCE
work/work_mirrored type filesystem -
work/work_mirrored creation Sat Sep 7 22:26 2024 -
work/work_mirrored used 78.8T -
work/work_mirrored available 17.3T -
work/work_mirrored referenced 77.2T -
work/work_mirrored compressratio 1.04x -
work/work_mirrored mounted yes -
work/work_mirrored quota none default
work/work_mirrored reservation none default
work/work_mirrored recordsize 1M local
work/work_mirrored mountpoint /mnt/work/work_mirrored default
work/work_mirrored sharenfs off default
work/work_mirrored checksum sha256 local
work/work_mirrored compression off local
work/work_mirrored atime off inherited from work
work/work_mirrored devices on default
work/work_mirrored exec on default
work/work_mirrored setuid on default
work/work_mirrored readonly off default
work/work_mirrored zoned off default
work/work_mirrored snapdir hidden local
work/work_mirrored aclmode discard inherited from work
work/work_mirrored aclinherit discard inherited from work
work/work_mirrored createtxg 16588 -
work/work_mirrored canmount on default
work/work_mirrored xattr sa received
work/work_mirrored copies 1 local
work/work_mirrored version 5 -
work/work_mirrored utf8only off -
work/work_mirrored normalization none -
work/work_mirrored casesensitivity insensitive -
work/work_mirrored vscan off default
work/work_mirrored nbmand off default
work/work_mirrored sharesmb off default
work/work_mirrored refquota none default
work/work_mirrored refreservation none default
work/work_mirrored guid 13761500551284112505 -
work/work_mirrored primarycache all inherited from work
work/work_mirrored secondarycache all default
work/work_mirrored usedbysnapshots 1.52T -
work/work_mirrored usedbydataset 77.2T -
work/work_mirrored usedbychildren 0B -
work/work_mirrored usedbyrefreservation 0B -
work/work_mirrored logbias latency default
work/work_mirrored objsetid 17037 -
work/work_mirrored dedup off default
work/work_mirrored mlslabel none default
work/work_mirrored sync disabled local
work/work_mirrored dnodesize legacy default
work/work_mirrored refcompressratio 1.04x -
work/work_mirrored written 504K -
work/work_mirrored logicalused 82.3T -
work/work_mirrored logicalreferenced 80.6T -
work/work_mirrored volmode default default
work/work_mirrored filesystem_limit none default
work/work_mirrored snapshot_limit none default
work/work_mirrored filesystem_count none default
work/work_mirrored snapshot_count none default
work/work_mirrored snapdev hidden default
work/work_mirrored acltype posix inherited from work
work/work_mirrored context none default
work/work_mirrored fscontext none default
work/work_mirrored defcontext none default
work/work_mirrored rootcontext none default
work/work_mirrored relatime on default
work/work_mirrored redundant_metadata all default
work/work_mirrored overlay on default
work/work_mirrored encryption off default
work/work_mirrored keylocation none default
work/work_mirrored keyformat none default
work/work_mirrored pbkdf2iters 0 default
work/work_mirrored special_small_blocks 0 default
work/work_mirrored snapshots_changed Thu Sep 19 0:00:01 2024 -
work/work_mirrored prefetch all default
work/work_mirrored org.truenas:managedby 192.168.178.25 received
work/work_mirrored org.freenas:description local
root@workhorse[~]#
I experimented with several possible combinations of compression, sync, checksum, sector, etc, … no change.
I also tested on the other Archive server. That one has a pool of 3x8RAIDZ2 and another 2x8RAIDZ2. The SAME:
root@truenas[~]# fio --name=write_test --rw=write --bs=1M --ioengine=posixaio --numjobs=1 --iodepth=32 --size=30G --filename=/mnt/Tank/Archiv2022/test/fio
write_test: (g=0): rw=write, bs=(R) 1024KiB-1024KiB, (W) 1024KiB-1024KiB, (T) 1024KiB-1024KiB, ioengine=posixaio, iodepth=32
fio-3.33
Starting 1 process
Jobs: 1 (f=1): [W(1)][100.0%][w=1057MiB/s][w=1057 IOPS][eta 00m:00s]
write_test: (groupid=0, jobs=1): err= 0: pid=2188062: Thu Sep 19 09:57:11 2024
  write: IOPS=1236, BW=1237MiB/s (1297MB/s)(30.0GiB/24843msec); 0 zone resets
    slat (usec): min=8, max=2807, avg=98.61, stdev=98.45
    clat (usec): min=1367, max=169667, avg=24949.04, stdev=7811.47
     lat (usec): min=1523, max=169752, avg=25047.65, stdev=7803.04
    clat percentiles (msec):
     |  1.00th=[   13],  5.00th=[   16], 10.00th=[   18], 20.00th=[   21],
     | 30.00th=[   22], 40.00th=[   24], 50.00th=[   25], 60.00th=[   26],
     | 70.00th=[   28], 80.00th=[   29], 90.00th=[   32], 95.00th=[   36],
     | 99.00th=[   45], 99.50th=[   55], 99.90th=[  159], 99.95th=[  169],
     | 99.99th=[  169]
   bw (  MiB/s): min=  779, max= 1792, per=100.00%, avg=1238.38, stdev=230.30, samples=49
   iops        : min=  779, max= 1792, avg=1238.29, stdev=230.32, samples=49
  lat (msec)   : 2=0.01%, 10=0.20%, 20=19.51%, 50=79.56%, 100=0.62%
  lat (msec)   : 250=0.10%
  cpu          : usr=12.93%, sys=0.37%, ctx=7002, majf=0, minf=1568
  IO depths    : 1=0.1%, 2=0.1%, 4=0.1%, 8=13.1%, 16=60.7%, 32=26.2%, >=64=0.0%
     submit    : 0=0.0%, 4=100.0%, 8=0.0%, 16=0.0%, 32=0.0%, 64=0.0%, >=64=0.0%
     complete  : 0=0.0%, 4=97.0%, 8=0.5%, 16=0.1%, 32=2.5%, 64=0.0%, >=64=0.0%
     issued rwts: total=0,30720,0,0 short=0,0,0,0 dropped=0,0,0,0
     latency   : target=0, window=0, percentile=100.00%, depth=32

Run status group 0 (all jobs):
  WRITE: bw=1237MiB/s (1297MB/s), 1237MiB/s-1237MiB/s (1297MB/s-1297MB/s), io=30.0GiB (32.2GB), run=24843-24843msec
root@truenas[~]# fio --name=write_test --rw=read --bs=1M --ioengine=posixaio --numjobs=1 --iodepth=32 --size=30G --filename=/mnt/Tank/Archiv2022/test/fio
write_test: (g=0): rw=read, bs=(R) 1024KiB-1024KiB, (W) 1024KiB-1024KiB, (T) 1024KiB-1024KiB, ioengine=posixaio, iodepth=32
fio-3.33
Starting 1 process
Jobs: 1 (f=1): [R(1)][100.0%][r=1888MiB/s][r=1888 IOPS][eta 00m:00s]
write_test: (groupid=0, jobs=1): err= 0: pid=2188756: Thu Sep 19 09:58:11 2024
  read: IOPS=1801, BW=1801MiB/s (1889MB/s)(30.0GiB/17057msec)
    slat (nsec): min=110, max=260503, avg=995.31, stdev=2125.99
    clat (usec): min=14181, max=31227, avg=17735.02, stdev=1838.36
     lat (usec): min=14182, max=31228, avg=17736.01, stdev=1838.38
    clat percentiles (usec):
     |  1.00th=[14877],  5.00th=[15401], 10.00th=[15664], 20.00th=[16319],
     | 30.00th=[16909], 40.00th=[17433], 50.00th=[17695], 60.00th=[17957],
     | 70.00th=[18220], 80.00th=[18482], 90.00th=[19268], 95.00th=[21627],
     | 99.00th=[24249], 99.50th=[24773], 99.90th=[28443], 99.95th=[28443],
     | 99.99th=[29754]
   bw (  MiB/s): min= 1344, max= 2048, per=100.00%, avg=1801.31, stdev=140.34, samples=34
   iops        : min= 1344, max= 2048, avg=1801.29, stdev=140.34, samples=34
  lat (msec)   : 20=92.20%, 50=7.80%
  cpu          : usr=1.17%, sys=0.69%, ctx=7685, majf=0, minf=58
  IO depths    : 1=0.1%, 2=0.1%, 4=0.1%, 8=25.0%, 16=50.0%, 32=25.0%, >=64=0.0%
     submit    : 0=0.0%, 4=100.0%, 8=0.0%, 16=0.0%, 32=0.0%, 64=0.0%, >=64=0.0%
     complete  : 0=0.0%, 4=97.5%, 8=0.1%, 16=0.0%, 32=2.5%, 64=0.0%, >=64=0.0%
     issued rwts: total=30720,0,0,0 short=0,0,0,0 dropped=0,0,0,0
     latency   : target=0, window=0, percentile=100.00%, depth=32

Run status group 0 (all jobs):
   READ: bw=1801MiB/s (1889MB/s), 1801MiB/s-1801MiB/s (1889MB/s-1889MB/s), io=30.0GiB (32.2GB), run=17057-17057msec
root@truenas[~]# echo 3 > /proc/sys/vm/drop_caches
root@truenas[~]# fio --name=write_test --rw=read --bs=1M --ioengine=posixaio --numjobs=1 --iodepth=32 --size=30G --filename=/mnt/Tank/Archiv2022/test/fio
write_test: (g=0): rw=read, bs=(R) 1024KiB-1024KiB, (W) 1024KiB-1024KiB, (T) 1024KiB-1024KiB, ioengine=posixaio, iodepth=32
fio-3.33
Starting 1 process
Jobs: 1 (f=1): [R(1)][100.0%][r=1858MiB/s][r=1857 IOPS][eta 00m:00s]
write_test: (groupid=0, jobs=1): err= 0: pid=2189176: Thu Sep 19 10:00:41 2024
  read: IOPS=232, BW=233MiB/s (244MB/s)(30.0GiB/132120msec)
    slat (nsec): min=110, max=177476, avg=1155.02, stdev=2243.49
    clat (msec): min=14, max=800, avg=137.57, stdev=103.29
     lat (msec): min=14, max=800, avg=137.57, stdev=103.29
    clat percentiles (msec):
     |  1.00th=[   17],  5.00th=[   17], 10.00th=[   18], 20.00th=[   20],
     | 30.00th=[   47], 40.00th=[  101], 50.00th=[  136], 60.00th=[  167],
     | 70.00th=[  192], 80.00th=[  224], 90.00th=[  271], 95.00th=[  321],
     | 99.00th=[  409], 99.50th=[  451], 99.90th=[  793], 99.95th=[  793],
     | 99.99th=[  802]
   bw (  KiB/s): min=65536, max=1953792, per=99.99%, avg=238073.92, stdev=275318.58, samples=263
   iops        : min=   64, max= 1908, avg=232.42, stdev=268.85, samples=263
  lat (msec)   : 20=20.56%, 50=9.70%, 100=9.57%, 250=47.25%, 500=12.80%
  lat (msec)   : 750=0.01%, 1000=0.10%
  cpu          : usr=0.20%, sys=0.09%, ctx=7685, majf=6, minf=62
  IO depths    : 1=0.1%, 2=0.1%, 4=0.1%, 8=25.0%, 16=50.0%, 32=25.0%, >=64=0.0%
     submit    : 0=0.0%, 4=100.0%, 8=0.0%, 16=0.0%, 32=0.0%, 64=0.0%, >=64=0.0%
     complete  : 0=0.0%, 4=97.5%, 8=0.1%, 16=0.0%, 32=2.5%, 64=0.0%, >=64=0.0%
     issued rwts: total=30720,0,0,0 short=0,0,0,0 dropped=0,0,0,0
     latency   : target=0, window=0, percentile=100.00%, depth=32

Run status group 0 (all jobs):
   READ: bw=233MiB/s (244MB/s), 233MiB/s-233MiB/s (244MB/s-244MB/s), io=30.0GiB (32.2GB), run=132120-132120msec
root@truenas[~]#
Conclusions. Where I am at:
Faulty Hardware:
I was thinking that there might be a general problem with the PCI bus limiting read speeds. What speaks against that is that NICs have no problems and I get 1000MB/s reads on the single NVMEs. HBA and NVME card are on different NUMAs. The SAS2008 with its PCIe 2.0 speed might not be great and I have ordered a 2308 to upgrade it. I will definitely try moving the cards to different slots but I mostly doubt that this is a hardware problem since it happens on both pools and seems to only occur when reading from the ZFS filesystem.
An exotic explanation might be different hardware issues on each of the PCI cards. Since it happens on both servers it might be a general issue of those servers, MB, CPU? Any hints welcome
BIOS setting:
I never even entered the BIOS of the server but will do that and check if there is any exotic setting that might limit read speeds.
Software issue, misconfiguration:
This seems to be the most likely cause but I am totally lost and have no idea where to look anymore.
Very much hoping that someone here can point me in the right direction to fix this.
Only further idea in that direction would be to totally wipe and reinstall TrueNAS and reimport the pools.
Or as a last solution ditch TrueNAS and go with stock Linux and reimport the pool or even restore from backup.
Any hints welcome. Not sure if this is allowed here but I’d be happy to offer a 500$ bounty to anyone who solves this.


