SMART Error Log not supported

Hello

So, I just found out that most of the drives I have don’t seem to support SMART Error Log.

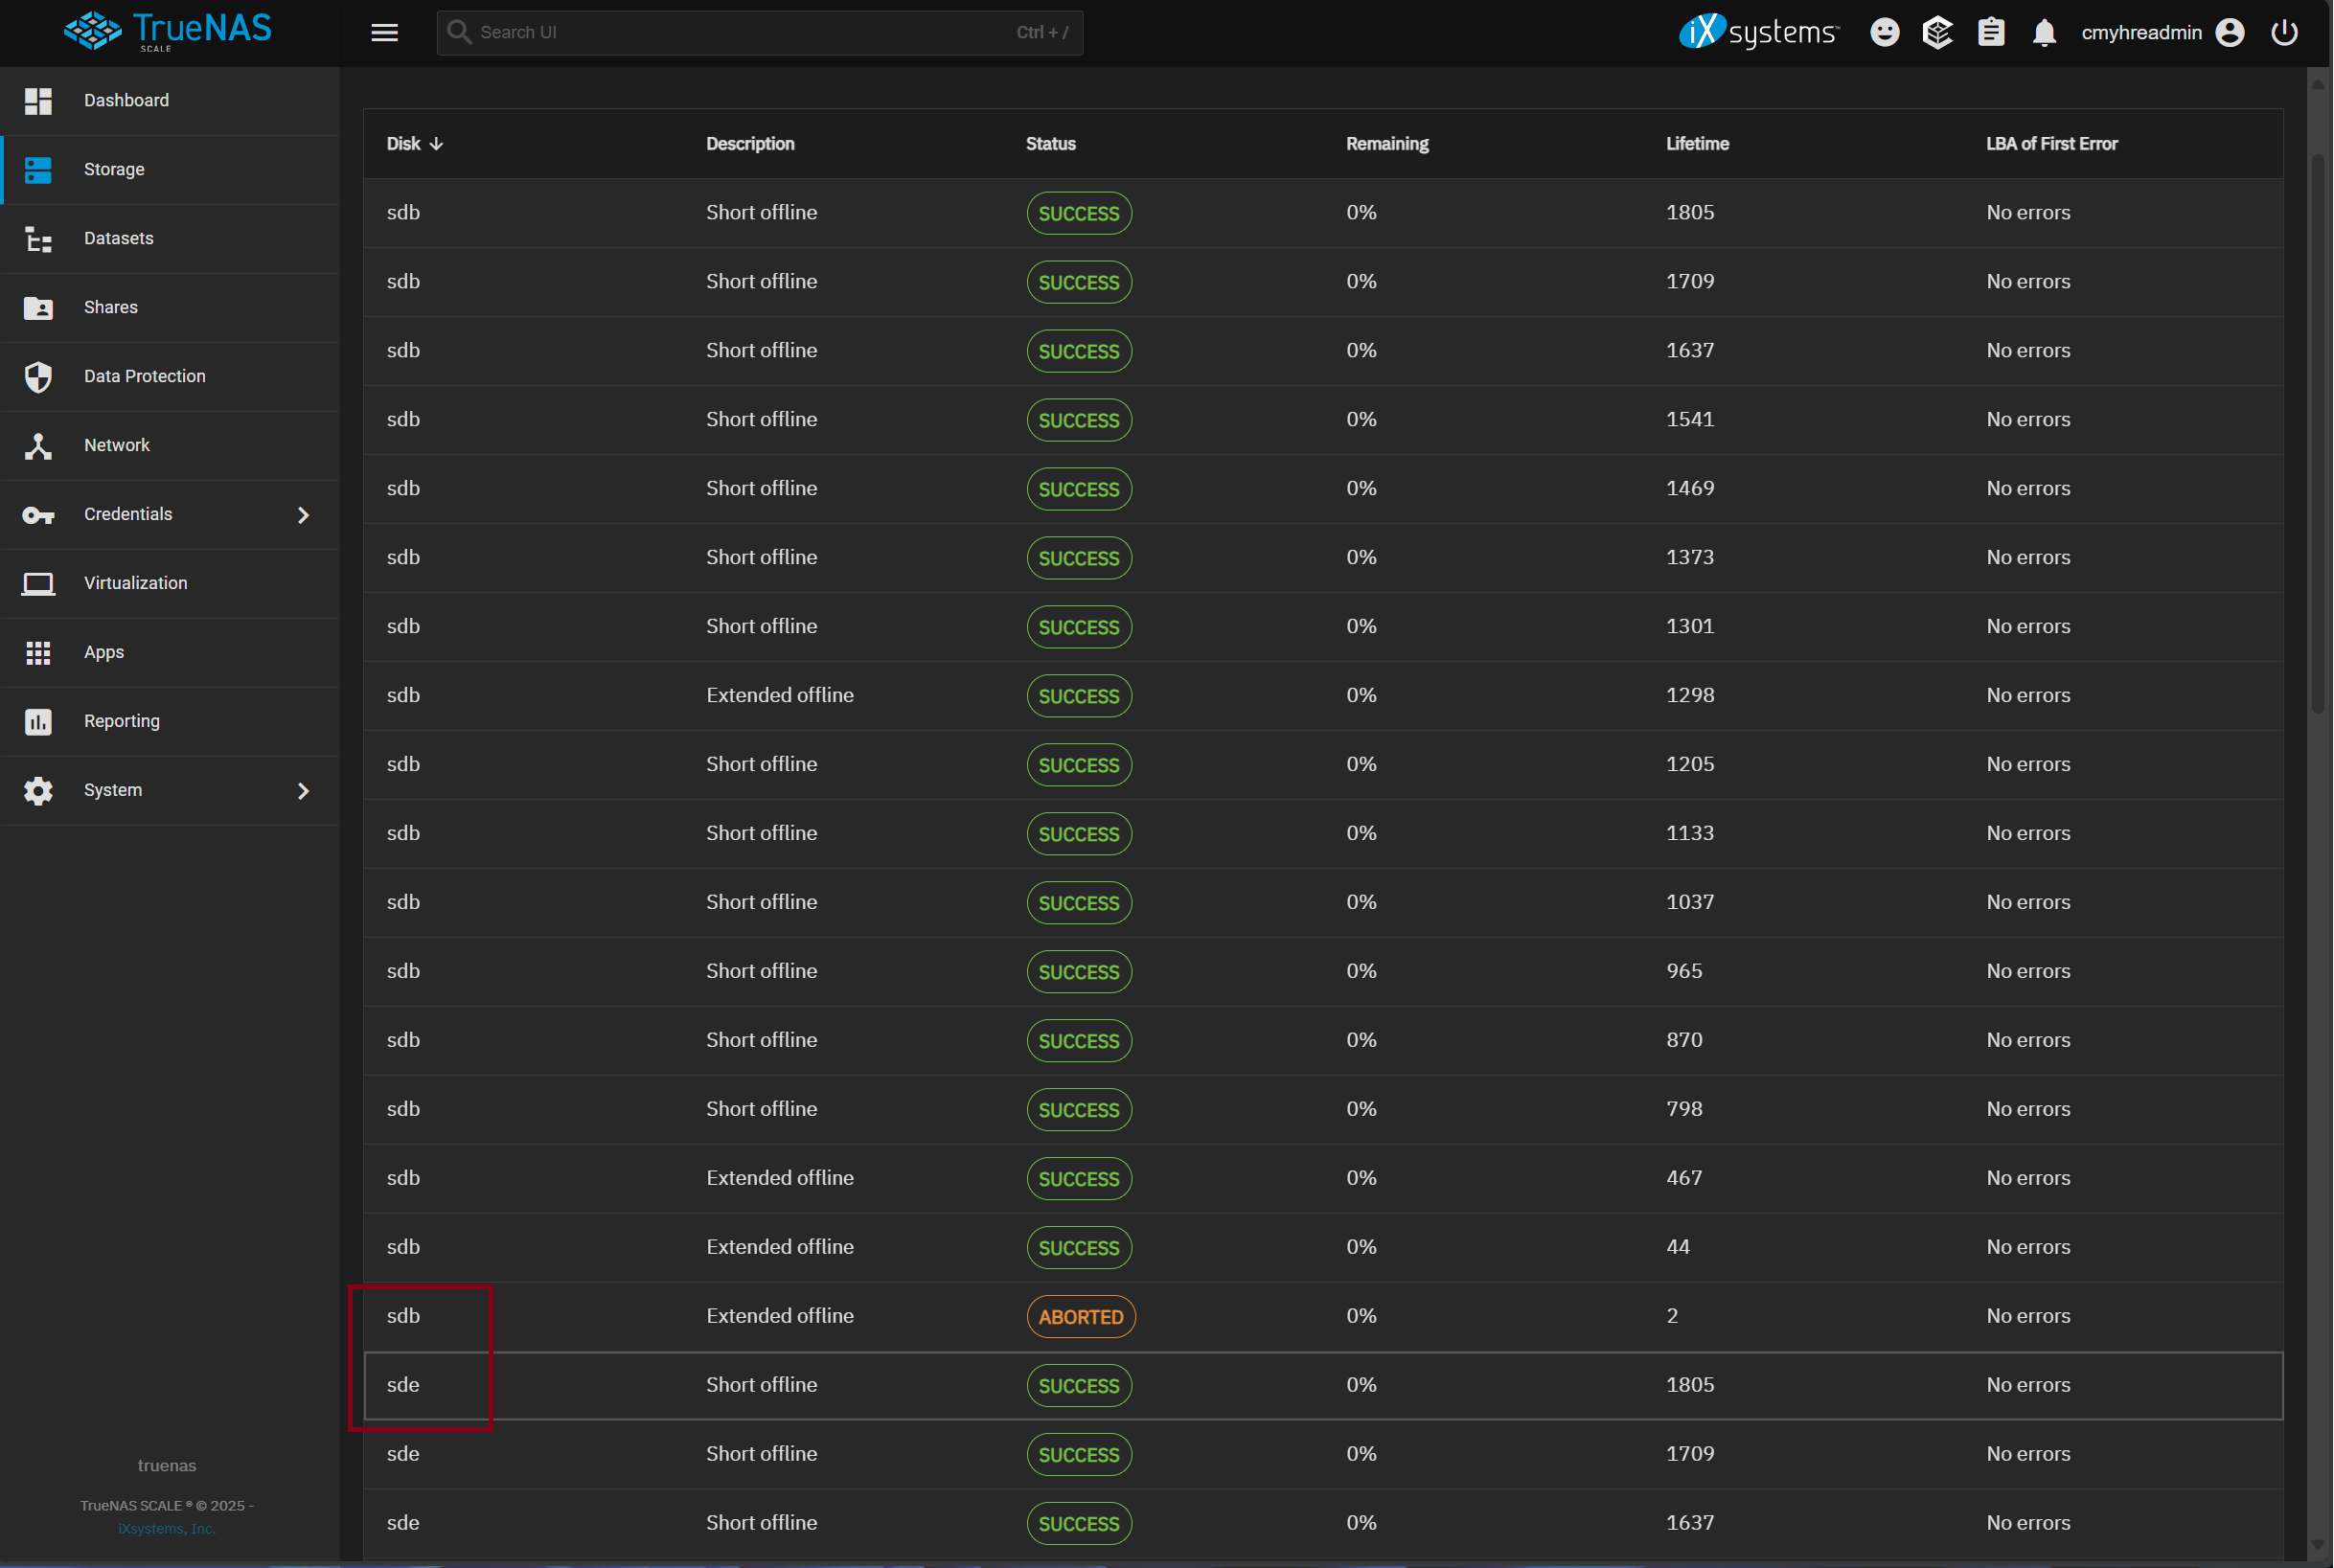
The way I found out, is that after some scheduled SMART testing, and looking at the “S.M.A.R.T. Test Results” for the pool, it looked a bit light, and I then verified that all my drives from the one specific vendor was not showing up in the list.
After checking via CLI and “smartctl”, I found that the drives says:

SMART Error Log not supported
SMART Self-test Log not supported

I assume this is an HDD issue, not TrueNAS?
Will this cause any problems for me in the future, as in, will I be notified by any alerts if the smart test fails on a drive during a test?

Would kind of suck if need to manually keep track of this…

SMART info -a
root@truenas[/var/empty]# smartctl -a /dev/sdh
smartctl 7.4 2023-08-01 r5530 [x86_64-linux-6.6.44-production+truenas] (local build)
Copyright (C) 2002-23, Bruce Allen, Christian Franke, www.smartmontools.org

=== START OF INFORMATION SECTION ===
Device Model:     MB014000GWUDA
Serial Number:    9JG47S0T
LU WWN Device Id: 5 000cca 258c1ee8c
Firmware Version: HPG1
User Capacity:    14,000,519,643,136 bytes [14.0 TB]
Sector Sizes:     512 bytes logical, 4096 bytes physical
Rotation Rate:    7200 rpm
Form Factor:      3.5 inches
Device is:        Not in smartctl database 7.3/5660
ATA Version is:   ACS-4, ACS-3 T13/2161-D revision 5
SATA Version is:  SATA 3.2, 6.0 Gb/s (current: 6.0 Gb/s)
Local Time is:    Tue Mar 25 18:00:25 2025 CET
SMART support is: Available - device has SMART capability.
SMART support is: Enabled

=== START OF READ SMART DATA SECTION ===
SMART overall-health self-assessment test result: PASSED

General SMART Values:
Offline data collection status:  (0x82) Offline data collection activity
                                        was completed without error.
                                        Auto Offline Data Collection: Enabled.
Self-test execution status:      (   0) The previous self-test routine completed
                                        without error or no self-test has ever
                                        been run.
Total time to complete Offline
data collection:                (   93) seconds.
Offline data collection
capabilities:                    (0x5b) SMART execute Offline immediate.
                                        Auto Offline data collection on/off support.
                                        Suspend Offline collection upon new
                                        command.
                                        Offline surface scan supported.
                                        Self-test supported.
                                        No Conveyance Self-test supported.
                                        Selective Self-test supported.
SMART capabilities:            (0x0003) Saves SMART data before entering
                                        power-saving mode.
                                        Supports SMART auto save timer.
Error logging capability:        (0x01) Error logging supported.
                                        General Purpose Logging supported.
Short self-test routine
recommended polling time:        (   2) minutes.
Extended self-test routine
recommended polling time:        (1548) minutes.
SCT capabilities:              (0x0025) SCT Status supported.
                                        SCT Data Table supported.

SMART Attributes Data Structure revision number: 16
Vendor Specific SMART Attributes with Thresholds:
ID# ATTRIBUTE_NAME          FLAG     VALUE WORST THRESH TYPE      UPDATED  WHEN_FAILED RAW_VALUE
  1 Raw_Read_Error_Rate     0x000f   100   100   001    Pre-fail  Always       -       0
  2 Throughput_Performance  0x0007   135   135   054    Pre-fail  Always       -       92
  3 Spin_Up_Time            0x0003   081   081   001    Pre-fail  Always       -       399 (Average 390)
  5 Reallocated_Sector_Ct   0x0033   100   100   001    Pre-fail  Always       -       0
  7 Seek_Error_Rate         0x000f   100   100   001    Pre-fail  Always       -       0
  8 Seek_Time_Performance   0x0005   133   133   020    Pre-fail  Offline      -       18
  9 Power_On_Hours          0x0032   100   100   000    Old_age   Always       -       3287
 10 Spin_Retry_Count        0x0013   100   100   001    Pre-fail  Always       -       0
 22 Helium_Level            0x0023   100   100   025    Pre-fail  Always       -       100
169 Unknown_Attribute       0x0033   100   100   001    Pre-fail  Always       -       0
180 Unknown_HDD_Attribute   0x003b   100   100   098    Pre-fail  Always       -       0
194 Temperature_Celsius     0x0022   058   042   000    Old_age   Always       -       36 (Min/Max 17/50)
196 Reallocated_Event_Count 0x0033   100   100   000    Pre-fail  Always       -       0

SMART Error Log not supported

SMART Self-test Log not supported

SMART Selective self-test log data structure revision number 1
 SPAN  MIN_LBA  MAX_LBA  CURRENT_TEST_STATUS
    1        0        0  Not_testing
    2        0        0  Not_testing
    3        0        0  Not_testing
    4        0        0  Not_testing
    5        0        0  Not_testing
Selective self-test flags (0x0):
  After scanning selected spans, do NOT read-scan remainder of disk.
If Selective self-test is pending on power-up, resume after 0 minute delay.

The above only provides legacy SMART information - try 'smartctl -x' for more

SMART info -x
root@truenas[/var/empty]# smartctl -x /dev/sdh
smartctl 7.4 2023-08-01 r5530 [x86_64-linux-6.6.44-production+truenas] (local build)
Copyright (C) 2002-23, Bruce Allen, Christian Franke, www.smartmontools.org

=== START OF INFORMATION SECTION ===
Device Model:     MB014000GWUDA
Serial Number:    9JG47S0T
LU WWN Device Id: 5 000cca 258c1ee8c
Firmware Version: HPG1
User Capacity:    14,000,519,643,136 bytes [14.0 TB]
Sector Sizes:     512 bytes logical, 4096 bytes physical
Rotation Rate:    7200 rpm
Form Factor:      3.5 inches
Device is:        Not in smartctl database 7.3/5660
ATA Version is:   ACS-4, ACS-3 T13/2161-D revision 5
SATA Version is:  SATA 3.2, 6.0 Gb/s (current: 6.0 Gb/s)
Local Time is:    Tue Mar 25 18:04:19 2025 CET
SMART support is: Available - device has SMART capability.
SMART support is: Enabled
AAM feature is:   Unavailable
APM feature is:   Unavailable
Rd look-ahead is: Enabled
Write cache is:   Enabled
DSN feature is:   Unavailable
ATA Security is:  Unavailable
Wt Cache Reorder: Unavailable

=== START OF READ SMART DATA SECTION ===
SMART overall-health self-assessment test result: PASSED

General SMART Values:
Offline data collection status:  (0x82) Offline data collection activity
                                        was completed without error.
                                        Auto Offline Data Collection: Enabled.
Self-test execution status:      (   0) The previous self-test routine completed
                                        without error or no self-test has ever
                                        been run.
Total time to complete Offline
data collection:                (   93) seconds.
Offline data collection
capabilities:                    (0x5b) SMART execute Offline immediate.
                                        Auto Offline data collection on/off support.
                                        Suspend Offline collection upon new
                                        command.
                                        Offline surface scan supported.
                                        Self-test supported.
                                        No Conveyance Self-test supported.
                                        Selective Self-test supported.
SMART capabilities:            (0x0003) Saves SMART data before entering
                                        power-saving mode.
                                        Supports SMART auto save timer.
Error logging capability:        (0x01) Error logging supported.
                                        General Purpose Logging supported.
Short self-test routine
recommended polling time:        (   2) minutes.
Extended self-test routine
recommended polling time:        (1548) minutes.
SCT capabilities:              (0x0025) SCT Status supported.
                                        SCT Data Table supported.

SMART Attributes Data Structure revision number: 16
Vendor Specific SMART Attributes with Thresholds:
ID# ATTRIBUTE_NAME          FLAGS    VALUE WORST THRESH FAIL RAW_VALUE
  1 Raw_Read_Error_Rate     POSR--   100   100   001    -    0
  2 Throughput_Performance  POS---   135   135   054    -    92
  3 Spin_Up_Time            PO----   081   081   001    -    399 (Average 390)
  5 Reallocated_Sector_Ct   PO--CK   100   100   001    -    0
  7 Seek_Error_Rate         POSR--   100   100   001    -    0
  8 Seek_Time_Performance   P-S---   133   133   020    -    18
  9 Power_On_Hours          -O--CK   100   100   000    -    3287
 10 Spin_Retry_Count        PO--C-   100   100   001    -    0
 22 Helium_Level            PO---K   100   100   025    -    100
169 Unknown_Attribute       PO--CK   100   100   001    -    0
180 Unknown_HDD_Attribute   PO-RCK   100   100   098    -    0
194 Temperature_Celsius     -O---K   058   042   000    -    36 (Min/Max 17/50)
196 Reallocated_Event_Count PO--CK   100   100   000    -    0
                            ||||||_ K auto-keep
                            |||||__ C event count
                            ||||___ R error rate
                            |||____ S speed/performance
                            ||_____ O updated online
                            |______ P prefailure warning

General Purpose Log Directory Version 1
SMART           Log Directory Version 1 [multi-sector log support]
Address    Access  R/W   Size  Description
0x00       GPL,SL  R/O      1  Log Directory
0x03       GPL     R/O      1  Ext. Comprehensive SMART error log
0x04       GPL,SL  R/O      7  Device Statistics log
0x07       GPL     R/O      1  Extended self-test log
0x08       GPL     R/O      2  Power Conditions log
0x09           SL  R/W      1  Selective self-test log
0x0c       GPL     R/O   5501  Pending Defects log
0x0d       GPL     R/O      7  LPS Mis-alignment log
0x10       GPL     R/O      1  NCQ Command Error log
0x11       GPL     R/O      1  SATA Phy Event Counters log
0x30       GPL     R/O      9  IDENTIFY DEVICE data log
0x80       GPL     R/W     16  Host vendor specific log
0x81-0x9f  GPL,SL  R/W     16  Host vendor specific log
0xb5           SL  VS       1  Device vendor specific log
0xb6       GPL     VS     127  Device vendor specific log
0xbb       GPL     VS       1  Device vendor specific log
0xd0       GPL     VS       1  Device vendor specific log
0xd7       GPL     VS       1  Device vendor specific log
0xe0       GPL,SL  R/W      1  SCT Command/Status
0xe1       GPL,SL  R/W      1  SCT Data Transfer

SMART Extended Comprehensive Error Log Version: 1 (1 sectors)
Device Error Count: 189 (device log contains only the most recent 4 errors)
        CR     = Command Register
        FEATR  = Features Register
        COUNT  = Count (was: Sector Count) Register
        LBA_48 = Upper bytes of LBA High/Mid/Low Registers ]  ATA-8
        LH     = LBA High (was: Cylinder High) Register    ]   LBA
        LM     = LBA Mid (was: Cylinder Low) Register      ] Register
        LL     = LBA Low (was: Sector Number) Register     ]
        DV     = Device (was: Device/Head) Register
        DC     = Device Control Register
        ER     = Error register
        ST     = Status register
Powered_Up_Time is measured from power on, and printed as
DDd+hh:mm:SS.sss where DD=days, hh=hours, mm=minutes,
SS=sec, and sss=millisec. It "wraps" after 49.710 days.

Error 189 [0] occurred at disk power-on lifetime: 2346 hours (97 days + 18 hours)
  When the command that caused the error occurred, the device was active or idle.

  After command completion occurred, registers were:
  ER -- ST COUNT  LBA_48  LH LM LL DV DC
  -- -- -- == -- == == == -- -- -- -- --
  04 -- 53 00 00 00 00 00 00 00 00 00 00  Error: ABRT

  Commands leading to the command that caused the error were:
  CR FEATR COUNT  LBA_48  LH LM LL DV DC  Powered_Up_Time  Command/Feature_Name
  -- == -- == -- == == == -- -- -- -- --  ---------------  --------------------
  ef 00 85 00 00 00 00 00 00 00 00 40 00     00:04:03.395  SET FEATURES [Disable APM]
  60 00 08 00 00 00 02 25 22 a2 28 40 00     00:04:03.021  READ FPDMA QUEUED
  60 00 08 00 00 00 02 25 22 b9 18 40 00     00:04:03.013  READ FPDMA QUEUED
  60 00 08 00 00 00 02 1b 07 ce 98 40 00     00:04:02.849  READ FPDMA QUEUED
  60 00 08 00 00 00 02 25 22 f8 80 40 00     00:04:02.719  READ FPDMA QUEUED

Error 188 [3] occurred at disk power-on lifetime: 2343 hours (97 days + 15 hours)
  When the command that caused the error occurred, the device was active or idle.

  After command completion occurred, registers were:
  ER -- ST COUNT  LBA_48  LH LM LL DV DC
  -- -- -- == -- == == == -- -- -- -- --
  04 -- 53 00 00 00 00 00 00 00 00 00 00  Error: ABRT

  Commands leading to the command that caused the error were:
  CR FEATR COUNT  LBA_48  LH LM LL DV DC  Powered_Up_Time  Command/Feature_Name
  -- == -- == -- == == == -- -- -- -- --  ---------------  --------------------
  ef 00 85 00 00 00 00 00 00 00 00 40 00     00:04:48.666  SET FEATURES [Disable APM]
  60 00 08 00 00 00 02 23 26 f9 48 40 00     00:04:47.775  READ FPDMA QUEUED
  60 00 08 00 00 00 02 25 22 b9 18 40 00     00:04:47.662  READ FPDMA QUEUED
  60 00 08 00 00 00 02 1b 07 ce 80 40 00     00:04:47.618  READ FPDMA QUEUED
  b0 00 d0 00 01 00 00 00 c2 4f 00 00 00     00:04:47.561  SMART READ DATA

Error 187 [2] occurred at disk power-on lifetime: 2207 hours (91 days + 23 hours)
  When the command that caused the error occurred, the device was active or idle.

  After command completion occurred, registers were:
  ER -- ST COUNT  LBA_48  LH LM LL DV DC
  -- -- -- == -- == == == -- -- -- -- --
  04 -- 53 00 00 00 00 00 00 00 00 00 00  Error: ABRT

  Commands leading to the command that caused the error were:
  CR FEATR COUNT  LBA_48  LH LM LL DV DC  Powered_Up_Time  Command/Feature_Name
  -- == -- == -- == == == -- -- -- -- --  ---------------  --------------------
  ef 00 85 00 00 00 00 00 00 00 00 40 00     00:07:19.172  SET FEATURES [Disable APM]
  60 00 08 00 00 00 02 1d 00 37 a0 40 00     00:07:18.519  READ FPDMA QUEUED
  b0 00 d0 00 01 00 00 00 c2 4f 00 00 00     00:07:18.486  SMART READ DATA
  b0 00 da 00 00 00 00 00 c2 4f 00 00 00     00:07:18.486  SMART RETURN STATUS
  60 00 08 00 00 00 02 1b 07 ce 80 40 00     00:07:18.312  READ FPDMA QUEUED

Error 186 [1] occurred at disk power-on lifetime: 2159 hours (89 days + 23 hours)
  When the command that caused the error occurred, the device was active or idle.

  After command completion occurred, registers were:
  ER -- ST COUNT  LBA_48  LH LM LL DV DC
  -- -- -- == -- == == == -- -- -- -- --
  04 -- 51 00 00 00 00 00 00 00 00 00 00  Error: ABRT

  Commands leading to the command that caused the error were:
  CR FEATR COUNT  LBA_48  LH LM LL DV DC  Powered_Up_Time  Command/Feature_Name
  -- == -- == -- == == == -- -- -- -- --  ---------------  --------------------
  ef 00 85 00 00 00 00 00 00 00 00 40 00  5d+05:14:26.982  SET FEATURES [Disable APM]
  b0 00 d0 00 01 00 00 00 c2 4f 00 00 00  5d+05:14:26.274  SMART READ DATA
  b0 00 da 00 00 00 00 00 c2 4f 00 00 00  5d+05:14:26.274  SMART RETURN STATUS
  60 00 08 00 00 00 02 1b 07 ce 80 40 00  5d+05:14:25.753  READ FPDMA QUEUED
  60 00 08 00 00 00 02 1b 07 f5 78 40 00  5d+05:14:25.673  READ FPDMA QUEUED

SMART Extended Self-test Log Version: 1 (1 sectors)
Num  Test_Description    Status                  Remaining  LifeTime(hours)  LBA_of_first_error
# 1  Short offline       Completed without error       00%      3270         -
# 2  Short offline       Completed without error       00%      3174         -
# 3  Short offline       Completed without error       00%      3102         -
# 4  Short offline       Completed without error       00%      3006         -
# 5  Short offline       Completed without error       00%      2934         -
# 6  Short offline       Completed without error       00%      2838         -
# 7  Extended offline    Completed without error       00%      2768         -
# 8  Short offline       Completed without error       00%      2670         -
# 9  Short offline       Completed without error       00%      2598         -
#10  Short offline       Completed without error       00%      2502         -
#11  Short offline       Completed without error       00%      2430         -
#12  Short offline       Completed without error       00%      2336         -
#13  Short offline       Completed without error       00%      2264         -
#14  Extended offline    Completed without error       00%      1491         -
#15  Extended offline    Completed without error       00%        56         -
#16  Short offline       Completed without error       00%         2         -

SMART Selective self-test log data structure revision number 1
 SPAN  MIN_LBA  MAX_LBA  CURRENT_TEST_STATUS
    1        0        0  Not_testing
    2        0        0  Not_testing
    3        0        0  Not_testing
    4        0        0  Not_testing
    5        0        0  Not_testing
Selective self-test flags (0x0):
  After scanning selected spans, do NOT read-scan remainder of disk.
If Selective self-test is pending on power-up, resume after 0 minute delay.

SCT Status Version:                  3
SCT Version (vendor specific):       256 (0x0100)
Device State:                        Active (0)
Current Temperature:                    36 Celsius
Power Cycle Min/Max Temperature:     30/42 Celsius
Lifetime    Min/Max Temperature:     17/50 Celsius
Specified Max Operating Temperature:    60 Celsius
Under/Over Temperature Limit Count:   0/0
SMART Status:                        0xc24f (PASSED)
Minimum supported ERC Time Limit:    50 (5.0 seconds)

SCT Temperature History Version:     2
Temperature Sampling Period:         1 minute
Temperature Logging Interval:        1 minute
Min/Max recommended Temperature:      0/60 Celsius
Min/Max Temperature Limit:           -40/70 Celsius
Temperature History Size (Index):    128 (112)

Index    Estimated Time   Temperature Celsius
 113    2025-03-25 15:57    36  *****************
 ...    ..(126 skipped).    ..  *****************
 112    2025-03-25 18:04    36  *****************

SCT Error Recovery Control command not supported

Device Statistics (GP Log 0x04)
Page  Offset Size        Value Flags Description
0x01  =====  =               =  ===  == General Statistics (rev 1) ==
0x01  0x008  4              63  ---  Lifetime Power-On Resets
0x01  0x010  4            3287  ---  Power-on Hours
0x01  0x018  6      6891989080  ---  Logical Sectors Written
0x01  0x020  6        30615005  ---  Number of Write Commands
0x01  0x028  6     55749333782  ---  Logical Sectors Read
0x01  0x030  6       271890062  ---  Number of Read Commands
0x01  0x038  6     11836273850  ---  Date and Time TimeStamp
0x03  =====  =               =  ===  == Rotating Media Statistics (rev 1) ==
0x03  0x008  4            3270  ---  Spindle Motor Power-on Hours
0x03  0x010  4            3270  ---  Head Flying Hours
0x03  0x018  4             194  ---  Head Load Events
0x03  0x020  4               0  ---  Number of Reallocated Logical Sectors
0x03  0x028  4               0  ---  Read Recovery Attempts
0x03  0x030  4               1  ---  Number of Mechanical Start Failures
0x04  =====  =               =  ===  == General Errors Statistics (rev 1) ==
0x04  0x008  4               0  ---  Number of Reported Uncorrectable Errors
0x04  0x010  4               0  ---  Resets Between Cmd Acceptance and Completion
0x05  =====  =               =  ===  == Temperature Statistics (rev 1) ==
0x05  0x008  1              36  ---  Current Temperature
0x05  0x010  1              34  N--  Average Short Term Temperature
0x05  0x018  1              34  N--  Average Long Term Temperature
0x05  0x020  1              50  ---  Highest Temperature
0x05  0x028  1              17  ---  Lowest Temperature
0x05  0x030  1              49  N--  Highest Average Short Term Temperature
0x05  0x038  1              25  N--  Lowest Average Short Term Temperature
0x05  0x040  1              44  N--  Highest Average Long Term Temperature
0x05  0x048  1              25  N--  Lowest Average Long Term Temperature
0x05  0x050  4               0  ---  Time in Over-Temperature
0x05  0x058  1              60  ---  Specified Maximum Operating Temperature
0x05  0x060  4               0  ---  Time in Under-Temperature
0x05  0x068  1               0  ---  Specified Minimum Operating Temperature
0x06  =====  =               =  ===  == Transport Statistics (rev 1) ==
0x06  0x008  4             153  ---  Number of Hardware Resets
0x06  0x010  4              51  ---  Number of ASR Events
0x06  0x018  4               0  ---  Number of Interface CRC Errors
                                |||_ C monitored condition met
                                ||__ D supports DSN
                                |___ N normalized value

Pending Defects log (GP Log 0x0c)
No Defects Logged

SATA Phy Event Counters (GP Log 0x11)
ID      Size     Value  Description
0x0001  2            0  Command failed due to ICRC error
0x0002  2            0  R_ERR response for data FIS
0x0003  2            0  R_ERR response for device-to-host data FIS
0x0004  2            0  R_ERR response for host-to-device data FIS
0x0005  2            0  R_ERR response for non-data FIS
0x0006  2            0  R_ERR response for device-to-host non-data FIS
0x0007  2            0  R_ERR response for host-to-device non-data FIS
0x0008  2            0  Device-to-host non-data FIS retries
0x0009  2            1  Transition from drive PhyRdy to drive PhyNRdy
0x000a  2            2  Device-to-host register FISes sent due to a COMRESET
0x000b  2            0  CRC errors within host-to-device FIS
0x000d  2            0  Non-CRC errors within host-to-device FIS

Thanks for any replies :slight_smile:

I do not see an issue.

TrueNAS will notify you if you have an increase in an error field, such as reallocated sectors or pending sectors, and others.

If you want to track it, use Multi-Report (see link below). Many people do not trust TrueNAS alone, and for good reasons in the past. “Trust but Verify”

The “problem” i have, is that none of the drives from that one spesific vendor shows up in reports… Here is SMART from one of the other drives that do show up:

SMART info Seagate
root@truenas[/var/empty]# smartctl -a /dev/sdb
smartctl 7.4 2023-08-01 r5530 [x86_64-linux-6.6.44-production+truenas] (local build)
Copyright (C) 2002-23, Bruce Allen, Christian Franke, www.smartmontools.org

=== START OF INFORMATION SECTION ===
Model Family:     Seagate Exos X16
Device Model:     ST14000NM001G-2KJ103
Serial Number:    ZL2B769T
LU WWN Device Id: 5 000c50 0c81ccd58
Firmware Version: SN04
User Capacity:    14,000,519,643,136 bytes [14.0 TB]
Sector Sizes:     512 bytes logical, 4096 bytes physical
Rotation Rate:    7200 rpm
Form Factor:      3.5 inches
Device is:        In smartctl database 7.3/5660
ATA Version is:   ACS-4 (minor revision not indicated)
SATA Version is:  SATA 3.3, 6.0 Gb/s (current: 6.0 Gb/s)
Local Time is:    Wed Mar 26 06:58:35 2025 CET
SMART support is: Available - device has SMART capability.
SMART support is: Enabled

=== START OF READ SMART DATA SECTION ===
SMART overall-health self-assessment test result: PASSED

General SMART Values:
Offline data collection status:  (0x82) Offline data collection activity
                                        was completed without error.
                                        Auto Offline Data Collection: Enabled.
Self-test execution status:      (   0) The previous self-test routine completed
                                        without error or no self-test has ever
                                        been run.
Total time to complete Offline
data collection:                (  567) seconds.
Offline data collection
capabilities:                    (0x7b) SMART execute Offline immediate.
                                        Auto Offline data collection on/off support.
                                        Suspend Offline collection upon new
                                        command.
                                        Offline surface scan supported.
                                        Self-test supported.
                                        Conveyance Self-test supported.
                                        Selective Self-test supported.
SMART capabilities:            (0x0003) Saves SMART data before entering
                                        power-saving mode.
                                        Supports SMART auto save timer.
Error logging capability:        (0x01) Error logging supported.
                                        General Purpose Logging supported.
Short self-test routine
recommended polling time:        (   1) minutes.
Extended self-test routine
recommended polling time:        (1242) minutes.
Conveyance self-test routine
recommended polling time:        (   2) minutes.
SCT capabilities:              (0x70bd) SCT Status supported.
                                        SCT Error Recovery Control supported.
                                        SCT Feature Control supported.
                                        SCT Data Table supported.

SMART Attributes Data Structure revision number: 10
Vendor Specific SMART Attributes with Thresholds:
ID# ATTRIBUTE_NAME          FLAG     VALUE WORST THRESH TYPE      UPDATED  WHEN_FAILED RAW_VALUE
  1 Raw_Read_Error_Rate     0x000f   077   064   044    Pre-fail  Always       -       49454600
  3 Spin_Up_Time            0x0003   091   090   000    Pre-fail  Always       -       0
  4 Start_Stop_Count        0x0032   100   100   020    Old_age   Always       -       32
  5 Reallocated_Sector_Ct   0x0033   100   100   010    Pre-fail  Always       -       0
  7 Seek_Error_Rate         0x000f   080   060   045    Pre-fail  Always       -       106874748
  9 Power_On_Hours          0x0032   098   098   000    Old_age   Always       -       1835
 10 Spin_Retry_Count        0x0013   100   100   097    Pre-fail  Always       -       0
 12 Power_Cycle_Count       0x0032   100   100   020    Old_age   Always       -       31
 18 Head_Health             0x000b   100   100   050    Pre-fail  Always       -       0
187 Reported_Uncorrect      0x0032   100   100   000    Old_age   Always       -       0
188 Command_Timeout         0x0032   100   100   000    Old_age   Always       -       0
190 Airflow_Temperature_Cel 0x0022   067   057   040    Old_age   Always       -       33 (Min/Max 28/43)
192 Power-Off_Retract_Count 0x0032   100   100   000    Old_age   Always       -       14
193 Load_Cycle_Count        0x0032   098   098   000    Old_age   Always       -       4396
194 Temperature_Celsius     0x0022   033   043   000    Old_age   Always       -       33 (0 20 0 0 0)
197 Current_Pending_Sector  0x0012   100   100   000    Old_age   Always       -       0
198 Offline_Uncorrectable   0x0010   100   100   000    Old_age   Offline      -       0
199 UDMA_CRC_Error_Count    0x003e   200   200   000    Old_age   Always       -       0
200 Pressure_Limit          0x0023   100   100   001    Pre-fail  Always       -       0
240 Head_Flying_Hours       0x0000   100   253   000    Old_age   Offline      -       518h+17m+43.914s
241 Total_LBAs_Written      0x0000   100   253   000    Old_age   Offline      -       118510186632
242 Total_LBAs_Read         0x0000   100   253   000    Old_age   Offline      -       150148312973

SMART Error Log Version: 1
No Errors Logged

SMART Self-test log structure revision number 1
Num  Test_Description    Status                  Remaining  LifeTime(hours)  LBA_of_first_error
# 1  Short offline       Completed without error       00%      1805         -
# 2  Short offline       Completed without error       00%      1709         -
# 3  Short offline       Completed without error       00%      1637         -
# 4  Short offline       Completed without error       00%      1541         -
# 5  Short offline       Completed without error       00%      1469         -
# 6  Short offline       Completed without error       00%      1373         -
# 7  Short offline       Completed without error       00%      1301         -
# 8  Extended offline    Completed without error       00%      1298         -
# 9  Short offline       Completed without error       00%      1205         -
#10  Short offline       Completed without error       00%      1133         -
#11  Short offline       Completed without error       00%      1037         -
#12  Short offline       Completed without error       00%       965         -
#13  Short offline       Completed without error       00%       870         -
#14  Short offline       Completed without error       00%       798         -
#15  Extended offline    Completed without error       00%       467         -
#16  Extended offline    Completed without error       00%        44         -
#17  Extended offline    Interrupted (host reset)      00%         2         -

SMART Selective self-test log data structure revision number 1
 SPAN  MIN_LBA  MAX_LBA  CURRENT_TEST_STATUS
    1        0        0  Not_testing
    2        0        0  Not_testing
    3        0        0  Not_testing
    4        0        0  Not_testing
    5        0        0  Not_testing
Selective self-test flags (0x0):
  After scanning selected spans, do NOT read-scan remainder of disk.
If Selective self-test is pending on power-up, resume after 0 minute delay.

The above only provides legacy SMART information - try 'smartctl -x' for more

As you see herer, in the bottom, it logs the tests completed.

Here are a photo from my GUI, you can see that im not getting anything from drive /dev/sdc and /dev/sdd for example.

So that is the “issue” im wondering if is an actuall issue or just an inconvenience for me :slight_smile:

Thanks

For completeness before I provide a half-ass answer, I need some data to prove what is or isn’t happening.

Please note that I use drive serial numbers for everything, it matters and the drive IDs can change, even though you typically do see that all the time.

For drive sdc and sdd, I need the following data (you provided sdh in your first posting):

  1. smartctl -x /dev/sdc and smartctl -x /dev/sdd and you can place those in code brackets of course.
  2. What version of SCALE are you using?
  3. How are these drives physically connected to the machine? Through an HBA, Motherboard SATA ports, ??? Since the system is not in front of me I have to ask these things. And please provide any other details you can think of to reduce how much mind probing I have to do later.

Let me examine the data and I will get back to you as soon as I see it pop up.

Its the same result for 12 of my 18 HDD-drives and the entire SSD-pool, as they are same vendor (HP-branded), i just used sdc and sdd to illustrate what i see in the web-gui.

sdc -x
root@truenas[/var/empty]# smartctl -x /dev/sdc
smartctl 7.4 2023-08-01 r5530 [x86_64-linux-6.6.44-production+truenas] (local build)
Copyright (C) 2002-23, Bruce Allen, Christian Franke, www.smartmontools.org

=== START OF INFORMATION SECTION ===
Device Model:     MB014000GWUDA
Serial Number:    9JG4KZNT
LU WWN Device Id: 5 000cca 258c21503
Firmware Version: HPG1
User Capacity:    14,000,519,643,136 bytes [14.0 TB]
Sector Sizes:     512 bytes logical, 4096 bytes physical
Rotation Rate:    7200 rpm
Form Factor:      3.5 inches
Device is:        Not in smartctl database 7.3/5660
ATA Version is:   ACS-4, ACS-3 T13/2161-D revision 5
SATA Version is:  SATA 3.2, 6.0 Gb/s (current: 6.0 Gb/s)
Local Time is:    Wed Mar 26 15:58:48 2025 CET
SMART support is: Available - device has SMART capability.
SMART support is: Enabled
AAM feature is:   Unavailable
APM feature is:   Unavailable
Rd look-ahead is: Enabled
Write cache is:   Enabled
DSN feature is:   Unavailable
ATA Security is:  Unavailable
Wt Cache Reorder: Unavailable

=== START OF READ SMART DATA SECTION ===
SMART overall-health self-assessment test result: PASSED

General SMART Values:
Offline data collection status:  (0x82) Offline data collection activity
                                        was completed without error.
                                        Auto Offline Data Collection: Enabled.
Self-test execution status:      (   0) The previous self-test routine completed
                                        without error or no self-test has ever
                                        been run.
Total time to complete Offline
data collection:                (   93) seconds.
Offline data collection
capabilities:                    (0x5b) SMART execute Offline immediate.
                                        Auto Offline data collection on/off support.
                                        Suspend Offline collection upon new
                                        command.
                                        Offline surface scan supported.
                                        Self-test supported.
                                        No Conveyance Self-test supported.
                                        Selective Self-test supported.
SMART capabilities:            (0x0003) Saves SMART data before entering
                                        power-saving mode.
                                        Supports SMART auto save timer.
Error logging capability:        (0x01) Error logging supported.
                                        General Purpose Logging supported.
Short self-test routine
recommended polling time:        (   2) minutes.
Extended self-test routine
recommended polling time:        (1525) minutes.
SCT capabilities:              (0x0025) SCT Status supported.
                                        SCT Data Table supported.

SMART Attributes Data Structure revision number: 16
Vendor Specific SMART Attributes with Thresholds:
ID# ATTRIBUTE_NAME          FLAGS    VALUE WORST THRESH FAIL RAW_VALUE
  1 Raw_Read_Error_Rate     POSR--   100   100   001    -    0
  2 Throughput_Performance  POS---   135   135   054    -    96
  3 Spin_Up_Time            PO----   081   081   001    -    391 (Average 394)
  5 Reallocated_Sector_Ct   PO--CK   100   100   001    -    0
  7 Seek_Error_Rate         POSR--   100   100   001    -    0
  8 Seek_Time_Performance   P-S---   133   133   020    -    18
  9 Power_On_Hours          -O--CK   097   097   000    -    27732
 10 Spin_Retry_Count        PO--C-   100   100   001    -    0
 22 Helium_Level            PO---K   100   100   025    -    100
169 Unknown_Attribute       PO--CK   100   100   001    -    0
180 Unknown_HDD_Attribute   PO-RCK   100   100   098    -    0
194 Temperature_Celsius     -O---K   056   043   000    -    38 (Min/Max 16/49)
196 Reallocated_Event_Count PO--CK   100   100   000    -    0
                            ||||||_ K auto-keep
                            |||||__ C event count
                            ||||___ R error rate
                            |||____ S speed/performance
                            ||_____ O updated online
                            |______ P prefailure warning

General Purpose Log Directory Version 1
SMART           Log Directory Version 1 [multi-sector log support]
Address    Access  R/W   Size  Description
0x00       GPL,SL  R/O      1  Log Directory
0x03       GPL     R/O      1  Ext. Comprehensive SMART error log
0x04       GPL,SL  R/O      7  Device Statistics log
0x07       GPL     R/O      1  Extended self-test log
0x08       GPL     R/O      2  Power Conditions log
0x09           SL  R/W      1  Selective self-test log
0x0c       GPL     R/O   5501  Pending Defects log
0x0d       GPL     R/O      7  LPS Mis-alignment log
0x10       GPL     R/O      1  NCQ Command Error log
0x11       GPL     R/O      1  SATA Phy Event Counters log
0x30       GPL     R/O      9  IDENTIFY DEVICE data log
0x80       GPL     R/W     16  Host vendor specific log
0x81-0x9f  GPL,SL  R/W     16  Host vendor specific log
0xb5           SL  VS       1  Device vendor specific log
0xb6       GPL     VS     127  Device vendor specific log
0xbb       GPL     VS       1  Device vendor specific log
0xd0       GPL     VS       1  Device vendor specific log
0xd7       GPL     VS       1  Device vendor specific log
0xe0       GPL,SL  R/W      1  SCT Command/Status
0xe1       GPL,SL  R/W      1  SCT Data Transfer

SMART Extended Comprehensive Error Log Version: 1 (1 sectors)
Device Error Count: 315 (device log contains only the most recent 4 errors)
        CR     = Command Register
        FEATR  = Features Register
        COUNT  = Count (was: Sector Count) Register
        LBA_48 = Upper bytes of LBA High/Mid/Low Registers ]  ATA-8
        LH     = LBA High (was: Cylinder High) Register    ]   LBA
        LM     = LBA Mid (was: Cylinder Low) Register      ] Register
        LL     = LBA Low (was: Sector Number) Register     ]
        DV     = Device (was: Device/Head) Register
        DC     = Device Control Register
        ER     = Error register
        ST     = Status register
Powered_Up_Time is measured from power on, and printed as
DDd+hh:mm:SS.sss where DD=days, hh=hours, mm=minutes,
SS=sec, and sss=millisec. It "wraps" after 49.710 days.

Error 315 [2] occurred at disk power-on lifetime: 26769 hours (1115 days + 9 hours)
  When the command that caused the error occurred, the device was active or idle.

  After command completion occurred, registers were:
  ER -- ST COUNT  LBA_48  LH LM LL DV DC
  -- -- -- == -- == == == -- -- -- -- --
  04 -- 53 00 00 00 00 00 00 00 00 00 00  Error: ABRT

  Commands leading to the command that caused the error were:
  CR FEATR COUNT  LBA_48  LH LM LL DV DC  Powered_Up_Time  Command/Feature_Name
  -- == -- == -- == == == -- -- -- -- --  ---------------  --------------------
  ef 00 85 00 00 00 00 00 00 00 00 40 00     00:04:03.235  SET FEATURES [Disable APM]
  60 00 08 00 00 00 02 25 b4 99 20 40 00     00:04:03.058  READ FPDMA QUEUED
  60 00 08 00 00 00 02 25 b4 9b 68 40 00     00:04:02.929  READ FPDMA QUEUED
  60 00 08 00 00 00 02 25 b4 8e f0 40 00     00:04:02.851  READ FPDMA QUEUED
  60 00 08 00 00 00 02 25 b4 90 88 40 00     00:04:02.851  READ FPDMA QUEUED

Error 314 [1] occurred at disk power-on lifetime: 26766 hours (1115 days + 6 hours)
  When the command that caused the error occurred, the device was active or idle.

  After command completion occurred, registers were:
  ER -- ST COUNT  LBA_48  LH LM LL DV DC
  -- -- -- == -- == == == -- -- -- -- --
  04 -- 53 00 00 00 00 00 00 00 00 00 00  Error: ABRT

  Commands leading to the command that caused the error were:
  CR FEATR COUNT  LBA_48  LH LM LL DV DC  Powered_Up_Time  Command/Feature_Name
  -- == -- == -- == == == -- -- -- -- --  ---------------  --------------------
  ef 00 85 00 00 00 00 00 00 00 00 40 00     00:04:48.483  SET FEATURES [Disable APM]
  60 00 08 00 00 00 02 25 b4 99 20 40 00     00:04:47.694  READ FPDMA QUEUED
  60 00 08 00 00 00 02 25 b4 95 10 40 00     00:04:47.664  READ FPDMA QUEUED
  60 00 08 00 00 00 02 25 b4 9f e8 40 00     00:04:47.583  READ FPDMA QUEUED
  60 00 08 00 00 00 02 25 b4 9b 68 40 00     00:04:47.570  READ FPDMA QUEUED

Error 313 [0] occurred at disk power-on lifetime: 26629 hours (1109 days + 13 hours)
  When the command that caused the error occurred, the device was active or idle.

  After command completion occurred, registers were:
  ER -- ST COUNT  LBA_48  LH LM LL DV DC
  -- -- -- == -- == == == -- -- -- -- --
  04 -- 51 00 00 00 00 00 00 00 00 00 00  Error: ABRT

  Commands leading to the command that caused the error were:
  CR FEATR COUNT  LBA_48  LH LM LL DV DC  Powered_Up_Time  Command/Feature_Name
  -- == -- == -- == == == -- -- -- -- --  ---------------  --------------------
  ef 00 85 00 00 00 00 00 00 00 00 40 00     00:07:19.029  SET FEATURES [Disable APM]
  60 00 08 00 00 00 02 19 aa eb 98 40 00     00:07:18.533  READ FPDMA QUEUED
  60 00 08 00 00 00 02 1c aa ee 50 40 00     00:07:18.510  READ FPDMA QUEUED
  60 00 08 00 00 00 02 1c aa f4 b0 40 00     00:07:18.463  READ FPDMA QUEUED
  60 00 08 00 00 00 02 19 ab 2d 20 40 00     00:07:18.458  READ FPDMA QUEUED

Error 312 [3] occurred at disk power-on lifetime: 26582 hours (1107 days + 14 hours)
  When the command that caused the error occurred, the device was active or idle.

  After command completion occurred, registers were:
  ER -- ST COUNT  LBA_48  LH LM LL DV DC
  -- -- -- == -- == == == -- -- -- -- --
  04 -- 51 00 00 00 00 00 00 00 00 00 00  Error: ABRT

  Commands leading to the command that caused the error were:
  CR FEATR COUNT  LBA_48  LH LM LL DV DC  Powered_Up_Time  Command/Feature_Name
  -- == -- == -- == == == -- -- -- -- --  ---------------  --------------------
  ef 00 85 00 00 00 00 00 00 00 00 40 00  5d+05:14:29.479  SET FEATURES [Disable APM]
  60 00 08 00 00 00 02 1a b0 9d e0 40 00  5d+05:14:28.661  READ FPDMA QUEUED
  b0 00 d0 00 01 00 00 00 c2 4f 00 00 00  5d+05:14:28.444  SMART READ DATA
  b0 00 da 00 00 00 00 00 c2 4f 00 00 00  5d+05:14:28.444  SMART RETURN STATUS
  60 00 08 00 00 00 02 1a b0 8e a0 40 00  5d+05:14:28.423  READ FPDMA QUEUED

SMART Extended Self-test Log Version: 1 (1 sectors)
Num  Test_Description    Status                  Remaining  LifeTime(hours)  LBA_of_first_error
# 1  Short offline       Completed without error       00%     27693         -
# 2  Short offline       Completed without error       00%     27597         -
# 3  Short offline       Completed without error       00%     27525         -
# 4  Short offline       Completed without error       00%     27429         -
# 5  Short offline       Completed without error       00%     27357         -
# 6  Short offline       Completed without error       00%     27261         -
# 7  Extended offline    Completed without error       00%     27190         -
# 8  Short offline       Completed without error       00%     27093         -
# 9  Short offline       Completed without error       00%     27021         -
#10  Short offline       Completed without error       00%     26925         -
#11  Short offline       Completed without error       00%     26853         -
#12  Short offline       Completed without error       00%     26758         -
#13  Short offline       Completed without error       00%     26686         -
#14  Extended offline    Completed without error       00%     25913         -
#15  Short offline       Completed without error       00%     25486         -
#16  Short offline       Completed without error       00%     25486         -
#17  Extended offline    Completed without error       00%     24477         -

SMART Selective self-test log data structure revision number 1
 SPAN  MIN_LBA  MAX_LBA  CURRENT_TEST_STATUS
    1        0        0  Not_testing
    2        0        0  Not_testing
    3        0        0  Not_testing
    4        0        0  Not_testing
    5        0        0  Not_testing
Selective self-test flags (0x0):
  After scanning selected spans, do NOT read-scan remainder of disk.
If Selective self-test is pending on power-up, resume after 0 minute delay.

SCT Status Version:                  3
SCT Version (vendor specific):       256 (0x0100)
Device State:                        Active (0)
Current Temperature:                    38 Celsius
Power Cycle Min/Max Temperature:     32/44 Celsius
Lifetime    Min/Max Temperature:     16/49 Celsius
Specified Max Operating Temperature:    60 Celsius
Under/Over Temperature Limit Count:   0/0
SMART Status:                        0xc24f (PASSED)
Minimum supported ERC Time Limit:    50 (5.0 seconds)

SCT Temperature History Version:     2
Temperature Sampling Period:         1 minute
Temperature Logging Interval:        1 minute
Min/Max recommended Temperature:      0/60 Celsius
Min/Max Temperature Limit:           -40/70 Celsius
Temperature History Size (Index):    128 (12)

Index    Estimated Time   Temperature Celsius
  13    2025-03-26 13:51    38  *******************
 ...    ..(126 skipped).    ..  *******************
  12    2025-03-26 15:58    38  *******************

SCT Error Recovery Control command not supported

Device Statistics (GP Log 0x04)
Page  Offset Size        Value Flags Description
0x01  =====  =               =  ===  == General Statistics (rev 1) ==
0x01  0x008  4              81  ---  Lifetime Power-On Resets
0x01  0x010  4           27732  ---  Power-on Hours
0x01  0x018  6     54791499455  ---  Logical Sectors Written
0x01  0x020  6       129477343  ---  Number of Write Commands
0x01  0x028  6    617261135223  ---  Logical Sectors Read
0x01  0x030  6       893258569  ---  Number of Read Commands
0x01  0x038  6     99835230850  ---  Date and Time TimeStamp
0x03  =====  =               =  ===  == Rotating Media Statistics (rev 1) ==
0x03  0x008  4           18264  ---  Spindle Motor Power-on Hours
0x03  0x010  4           18264  ---  Head Flying Hours
0x03  0x018  4          209204  ---  Head Load Events
0x03  0x020  4               0  ---  Number of Reallocated Logical Sectors
0x03  0x028  4               0  ---  Read Recovery Attempts
0x03  0x030  4               1  ---  Number of Mechanical Start Failures
0x04  =====  =               =  ===  == General Errors Statistics (rev 1) ==
0x04  0x008  4               0  ---  Number of Reported Uncorrectable Errors
0x04  0x010  4             388  ---  Resets Between Cmd Acceptance and Completion
0x05  =====  =               =  ===  == Temperature Statistics (rev 1) ==
0x05  0x008  1              38  ---  Current Temperature
0x05  0x010  1              37  N--  Average Short Term Temperature
0x05  0x018  1              36  N--  Average Long Term Temperature
0x05  0x020  1              49  ---  Highest Temperature
0x05  0x028  1              16  ---  Lowest Temperature
0x05  0x030  1              48  N--  Highest Average Short Term Temperature
0x05  0x038  1              20  N--  Lowest Average Short Term Temperature
0x05  0x040  1              36  N--  Highest Average Long Term Temperature
0x05  0x048  1              22  N--  Lowest Average Long Term Temperature
0x05  0x050  4               0  ---  Time in Over-Temperature
0x05  0x058  1              60  ---  Specified Maximum Operating Temperature
0x05  0x060  4               0  ---  Time in Under-Temperature
0x05  0x068  1               0  ---  Specified Minimum Operating Temperature
0x06  =====  =               =  ===  == Transport Statistics (rev 1) ==
0x06  0x008  4             734  ---  Number of Hardware Resets
0x06  0x010  4              52  ---  Number of ASR Events
0x06  0x018  4               6  ---  Number of Interface CRC Errors
                                |||_ C monitored condition met
                                ||__ D supports DSN
                                |___ N normalized value

Pending Defects log (GP Log 0x0c)
No Defects Logged

SATA Phy Event Counters (GP Log 0x11)
ID      Size     Value  Description
0x0001  2            0  Command failed due to ICRC error
0x0002  2            0  R_ERR response for data FIS
0x0003  2            0  R_ERR response for device-to-host data FIS
0x0004  2            0  R_ERR response for host-to-device data FIS
0x0005  2            0  R_ERR response for non-data FIS
0x0006  2            0  R_ERR response for device-to-host non-data FIS
0x0007  2            0  R_ERR response for host-to-device non-data FIS
0x0008  2            0  Device-to-host non-data FIS retries
0x0009  2            1  Transition from drive PhyRdy to drive PhyNRdy
0x000a  2            2  Device-to-host register FISes sent due to a COMRESET
0x000b  2            0  CRC errors within host-to-device FIS
0x000d  2            0  Non-CRC errors within host-to-device FIS

sdd -x
root@truenas[/var/empty]# smartctl -x /dev/sdd
smartctl 7.4 2023-08-01 r5530 [x86_64-linux-6.6.44-production+truenas] (local build)
Copyright (C) 2002-23, Bruce Allen, Christian Franke, www.smartmontools.org

=== START OF INFORMATION SECTION ===
Device Model:     MB014000GWUDA
Serial Number:    9JG4NP7T
LU WWN Device Id: 5 000cca 258c21f22
Firmware Version: HPG1
User Capacity:    14,000,519,643,136 bytes [14.0 TB]
Sector Sizes:     512 bytes logical, 4096 bytes physical
Rotation Rate:    7200 rpm
Form Factor:      3.5 inches
Device is:        Not in smartctl database 7.3/5660
ATA Version is:   ACS-4, ACS-3 T13/2161-D revision 5
SATA Version is:  SATA 3.2, 6.0 Gb/s (current: 6.0 Gb/s)
Local Time is:    Wed Mar 26 16:00:25 2025 CET
SMART support is: Available - device has SMART capability.
SMART support is: Enabled
AAM feature is:   Unavailable
APM feature is:   Unavailable
Rd look-ahead is: Enabled
Write cache is:   Enabled
DSN feature is:   Unavailable
ATA Security is:  Unavailable
Wt Cache Reorder: Unavailable

=== START OF READ SMART DATA SECTION ===
SMART overall-health self-assessment test result: PASSED

General SMART Values:
Offline data collection status:  (0x82) Offline data collection activity
                                        was completed without error.
                                        Auto Offline Data Collection: Enabled.
Self-test execution status:      (   0) The previous self-test routine completed
                                        without error or no self-test has ever
                                        been run.
Total time to complete Offline
data collection:                (   93) seconds.
Offline data collection
capabilities:                    (0x5b) SMART execute Offline immediate.
                                        Auto Offline data collection on/off support.
                                        Suspend Offline collection upon new
                                        command.
                                        Offline surface scan supported.
                                        Self-test supported.
                                        No Conveyance Self-test supported.
                                        Selective Self-test supported.
SMART capabilities:            (0x0003) Saves SMART data before entering
                                        power-saving mode.
                                        Supports SMART auto save timer.
Error logging capability:        (0x01) Error logging supported.
                                        General Purpose Logging supported.
Short self-test routine
recommended polling time:        (   2) minutes.
Extended self-test routine
recommended polling time:        (1520) minutes.
SCT capabilities:              (0x0025) SCT Status supported.
                                        SCT Data Table supported.

SMART Attributes Data Structure revision number: 16
Vendor Specific SMART Attributes with Thresholds:
ID# ATTRIBUTE_NAME          FLAGS    VALUE WORST THRESH FAIL RAW_VALUE
  1 Raw_Read_Error_Rate     POSR--   100   100   001    -    0
  2 Throughput_Performance  POS---   135   135   054    -    92
  3 Spin_Up_Time            PO----   080   080   001    -    404 (Average 394)
  5 Reallocated_Sector_Ct   PO--CK   100   100   001    -    0
  7 Seek_Error_Rate         POSR--   100   100   001    -    0
  8 Seek_Time_Performance   P-S---   133   133   020    -    18
  9 Power_On_Hours          -O--CK   097   097   000    -    27751
 10 Spin_Retry_Count        PO--C-   100   100   001    -    0
 22 Helium_Level            PO---K   100   100   025    -    100
169 Unknown_Attribute       PO--CK   100   100   001    -    0
180 Unknown_HDD_Attribute   PO-RCK   100   100   098    -    0
194 Temperature_Celsius     -O---K   058   046   000    -    36 (Min/Max 16/46)
196 Reallocated_Event_Count PO--CK   100   100   000    -    0
                            ||||||_ K auto-keep
                            |||||__ C event count
                            ||||___ R error rate
                            |||____ S speed/performance
                            ||_____ O updated online
                            |______ P prefailure warning

General Purpose Log Directory Version 1
SMART           Log Directory Version 1 [multi-sector log support]
Address    Access  R/W   Size  Description
0x00       GPL,SL  R/O      1  Log Directory
0x03       GPL     R/O      1  Ext. Comprehensive SMART error log
0x04       GPL,SL  R/O      7  Device Statistics log
0x07       GPL     R/O      1  Extended self-test log
0x08       GPL     R/O      2  Power Conditions log
0x09           SL  R/W      1  Selective self-test log
0x0c       GPL     R/O   5501  Pending Defects log
0x0d       GPL     R/O      7  LPS Mis-alignment log
0x10       GPL     R/O      1  NCQ Command Error log
0x11       GPL     R/O      1  SATA Phy Event Counters log
0x30       GPL     R/O      9  IDENTIFY DEVICE data log
0x80       GPL     R/W     16  Host vendor specific log
0x81-0x9f  GPL,SL  R/W     16  Host vendor specific log
0xb5           SL  VS       1  Device vendor specific log
0xb6       GPL     VS     127  Device vendor specific log
0xbb       GPL     VS       1  Device vendor specific log
0xd0       GPL     VS       1  Device vendor specific log
0xd7       GPL     VS       1  Device vendor specific log
0xe0       GPL,SL  R/W      1  SCT Command/Status
0xe1       GPL,SL  R/W      1  SCT Data Transfer

SMART Extended Comprehensive Error Log Version: 1 (1 sectors)
Device Error Count: 311 (device log contains only the most recent 4 errors)
        CR     = Command Register
        FEATR  = Features Register
        COUNT  = Count (was: Sector Count) Register
        LBA_48 = Upper bytes of LBA High/Mid/Low Registers ]  ATA-8
        LH     = LBA High (was: Cylinder High) Register    ]   LBA
        LM     = LBA Mid (was: Cylinder Low) Register      ] Register
        LL     = LBA Low (was: Sector Number) Register     ]
        DV     = Device (was: Device/Head) Register
        DC     = Device Control Register
        ER     = Error register
        ST     = Status register
Powered_Up_Time is measured from power on, and printed as
DDd+hh:mm:SS.sss where DD=days, hh=hours, mm=minutes,
SS=sec, and sss=millisec. It "wraps" after 49.710 days.

Error 311 [2] occurred at disk power-on lifetime: 26788 hours (1116 days + 4 hours)
  When the command that caused the error occurred, the device was active or idle.

  After command completion occurred, registers were:
  ER -- ST COUNT  LBA_48  LH LM LL DV DC
  -- -- -- == -- == == == -- -- -- -- --
  04 -- 53 00 00 00 00 00 00 00 00 00 00  Error: ABRT

  Commands leading to the command that caused the error were:
  CR FEATR COUNT  LBA_48  LH LM LL DV DC  Powered_Up_Time  Command/Feature_Name
  -- == -- == -- == == == -- -- -- -- --  ---------------  --------------------
  ef 00 85 00 00 00 00 00 00 00 00 40 00     00:04:03.414  SET FEATURES [Disable APM]
  60 00 08 00 00 00 02 25 78 15 20 40 00     00:04:03.148  READ FPDMA QUEUED
  60 00 08 00 00 00 02 25 78 28 80 40 00     00:04:02.955  READ FPDMA QUEUED
  b0 00 d0 00 01 00 00 00 c2 4f 00 00 00     00:04:02.666  SMART READ DATA
  b0 00 da 00 00 00 00 00 c2 4f 00 00 00     00:04:02.665  SMART RETURN STATUS

Error 310 [1] occurred at disk power-on lifetime: 26785 hours (1116 days + 1 hours)
  When the command that caused the error occurred, the device was active or idle.

  After command completion occurred, registers were:
  ER -- ST COUNT  LBA_48  LH LM LL DV DC
  -- -- -- == -- == == == -- -- -- -- --
  04 -- 53 00 00 00 00 00 00 00 00 00 00  Error: ABRT

  Commands leading to the command that caused the error were:
  CR FEATR COUNT  LBA_48  LH LM LL DV DC  Powered_Up_Time  Command/Feature_Name
  -- == -- == -- == == == -- -- -- -- --  ---------------  --------------------
  ef 00 85 00 00 00 00 00 00 00 00 40 00     00:04:48.686  SET FEATURES [Disable APM]
  60 00 08 00 00 00 02 25 77 e8 20 40 00     00:04:47.763  READ FPDMA QUEUED
  b0 00 d0 00 01 00 00 00 c2 4f 00 00 00     00:04:47.571  SMART READ DATA
  b0 00 da 00 00 00 00 00 c2 4f 00 00 00     00:04:47.571  SMART RETURN STATUS
  b0 00 d0 00 01 00 00 00 c2 4f 00 00 00     00:04:47.566  SMART READ DATA

Error 309 [0] occurred at disk power-on lifetime: 26649 hours (1110 days + 9 hours)
  When the command that caused the error occurred, the device was active or idle.

  After command completion occurred, registers were:
  ER -- ST COUNT  LBA_48  LH LM LL DV DC
  -- -- -- == -- == == == -- -- -- -- --
  04 -- 53 00 00 00 00 00 00 00 00 00 00  Error: ABRT

  Commands leading to the command that caused the error were:
  CR FEATR COUNT  LBA_48  LH LM LL DV DC  Powered_Up_Time  Command/Feature_Name
  -- == -- == -- == == == -- -- -- -- --  ---------------  --------------------
  ef 00 85 00 00 00 00 00 00 00 00 40 00     00:07:19.200  SET FEATURES [Disable APM]
  60 00 08 00 00 00 02 1b 55 89 00 40 00     00:07:18.508  READ FPDMA QUEUED
  b0 00 d0 00 01 00 00 00 c2 4f 00 00 00     00:07:18.492  SMART READ DATA
  b0 00 da 00 00 00 00 00 c2 4f 00 00 00     00:07:18.492  SMART RETURN STATUS
  60 00 08 00 00 00 02 1b 55 9e 50 40 00     00:07:18.462  READ FPDMA QUEUED

Error 308 [3] occurred at disk power-on lifetime: 26601 hours (1108 days + 9 hours)
  When the command that caused the error occurred, the device was active or idle.

  After command completion occurred, registers were:
  ER -- ST COUNT  LBA_48  LH LM LL DV DC
  -- -- -- == -- == == == -- -- -- -- --
  04 -- 51 00 00 00 00 00 00 00 00 00 00  Error: ABRT

  Commands leading to the command that caused the error were:
  CR FEATR COUNT  LBA_48  LH LM LL DV DC  Powered_Up_Time  Command/Feature_Name
  -- == -- == -- == == == -- -- -- -- --  ---------------  --------------------
  ef 00 85 00 00 00 00 00 00 00 00 40 00  5d+05:14:29.633  SET FEATURES [Disable APM]
  b0 00 d0 00 01 00 00 00 c2 4f 00 00 00  5d+05:14:28.912  SMART READ DATA
  b0 00 da 00 00 00 00 00 c2 4f 00 00 00  5d+05:14:28.912  SMART RETURN STATUS
  60 00 08 00 00 00 02 1a 66 93 78 40 00  5d+05:14:28.415  READ FPDMA QUEUED
  60 00 08 00 00 00 02 1a 66 70 48 40 00  5d+05:14:28.285  READ FPDMA QUEUED

SMART Extended Self-test Log Version: 1 (1 sectors)
Num  Test_Description    Status                  Remaining  LifeTime(hours)  LBA_of_first_error
# 1  Short offline       Completed without error       00%     27712         -
# 2  Short offline       Completed without error       00%     27616         -
# 3  Short offline       Completed without error       00%     27544         -
# 4  Short offline       Completed without error       00%     27448         -
# 5  Short offline       Completed without error       00%     27376         -
# 6  Short offline       Completed without error       00%     27280         -
# 7  Extended offline    Completed without error       00%     27209         -
# 8  Short offline       Completed without error       00%     27112         -
# 9  Short offline       Completed without error       00%     27040         -
#10  Short offline       Completed without error       00%     26944         -
#11  Short offline       Completed without error       00%     26872         -
#12  Short offline       Completed without error       00%     26778         -
#13  Short offline       Completed without error       00%     26706         -
#14  Extended offline    Completed without error       00%     25933         -
#15  Extended offline    Completed without error       00%     24497         -

SMART Selective self-test log data structure revision number 1
 SPAN  MIN_LBA  MAX_LBA  CURRENT_TEST_STATUS
    1        0        0  Not_testing
    2        0        0  Not_testing
    3        0        0  Not_testing
    4        0        0  Not_testing
    5        0        0  Not_testing
Selective self-test flags (0x0):
  After scanning selected spans, do NOT read-scan remainder of disk.
If Selective self-test is pending on power-up, resume after 0 minute delay.

SCT Status Version:                  3
SCT Version (vendor specific):       256 (0x0100)
Device State:                        Active (0)
Current Temperature:                    36 Celsius
Power Cycle Min/Max Temperature:     31/42 Celsius
Lifetime    Min/Max Temperature:     16/46 Celsius
Specified Max Operating Temperature:    60 Celsius
Under/Over Temperature Limit Count:   0/0
SMART Status:                        0xc24f (PASSED)
Minimum supported ERC Time Limit:    50 (5.0 seconds)

SCT Temperature History Version:     2
Temperature Sampling Period:         1 minute
Temperature Logging Interval:        1 minute
Min/Max recommended Temperature:      0/60 Celsius
Min/Max Temperature Limit:           -40/70 Celsius
Temperature History Size (Index):    128 (16)

Index    Estimated Time   Temperature Celsius
  17    2025-03-26 13:53    36  *****************
 ...    ..(126 skipped).    ..  *****************
  16    2025-03-26 16:00    36  *****************

SCT Error Recovery Control command not supported

Device Statistics (GP Log 0x04)
Page  Offset Size        Value Flags Description
0x01  =====  =               =  ===  == General Statistics (rev 1) ==
0x01  0x008  4              80  ---  Lifetime Power-On Resets
0x01  0x010  4           27751  ---  Power-on Hours
0x01  0x018  6     54856714641  ---  Logical Sectors Written
0x01  0x020  6       130734187  ---  Number of Write Commands
0x01  0x028  6    625420613521  ---  Logical Sectors Read
0x01  0x030  6       961563478  ---  Number of Read Commands
0x01  0x038  6     99905759100  ---  Date and Time TimeStamp
0x03  =====  =               =  ===  == Rotating Media Statistics (rev 1) ==
0x03  0x008  4           18356  ---  Spindle Motor Power-on Hours
0x03  0x010  4           18356  ---  Head Flying Hours
0x03  0x018  4          208921  ---  Head Load Events
0x03  0x020  4               0  ---  Number of Reallocated Logical Sectors
0x03  0x028  4               1  ---  Read Recovery Attempts
0x03  0x030  4               1  ---  Number of Mechanical Start Failures
0x04  =====  =               =  ===  == General Errors Statistics (rev 1) ==
0x04  0x008  4               0  ---  Number of Reported Uncorrectable Errors
0x04  0x010  4               0  ---  Resets Between Cmd Acceptance and Completion
0x05  =====  =               =  ===  == Temperature Statistics (rev 1) ==
0x05  0x008  1              36  ---  Current Temperature
0x05  0x010  1              35  N--  Average Short Term Temperature
0x05  0x018  1              34  N--  Average Long Term Temperature
0x05  0x020  1              46  ---  Highest Temperature
0x05  0x028  1              16  ---  Lowest Temperature
0x05  0x030  1              45  N--  Highest Average Short Term Temperature
0x05  0x038  1              21  N--  Lowest Average Short Term Temperature
0x05  0x040  1              39  N--  Highest Average Long Term Temperature
0x05  0x048  1              22  N--  Lowest Average Long Term Temperature
0x05  0x050  4               0  ---  Time in Over-Temperature
0x05  0x058  1              60  ---  Specified Maximum Operating Temperature
0x05  0x060  4               0  ---  Time in Under-Temperature
0x05  0x068  1               0  ---  Specified Minimum Operating Temperature
0x06  =====  =               =  ===  == Transport Statistics (rev 1) ==
0x06  0x008  4             340  ---  Number of Hardware Resets
0x06  0x010  4              53  ---  Number of ASR Events
0x06  0x018  4               0  ---  Number of Interface CRC Errors
                                |||_ C monitored condition met
                                ||__ D supports DSN
                                |___ N normalized value

Pending Defects log (GP Log 0x0c)
No Defects Logged

SATA Phy Event Counters (GP Log 0x11)
ID      Size     Value  Description
0x0001  2            0  Command failed due to ICRC error
0x0002  2            0  R_ERR response for data FIS
0x0003  2            0  R_ERR response for device-to-host data FIS
0x0004  2            0  R_ERR response for host-to-device data FIS
0x0005  2            0  R_ERR response for non-data FIS
0x0006  2            0  R_ERR response for device-to-host non-data FIS
0x0007  2            0  R_ERR response for host-to-device non-data FIS
0x0008  2            0  Device-to-host non-data FIS retries
0x0009  2            1  Transition from drive PhyRdy to drive PhyNRdy
0x000a  2            2  Device-to-host register FISes sent due to a COMRESET
0x000b  2            0  CRC errors within host-to-device FIS
0x000d  2            0  Non-CRC errors within host-to-device FIS

I am on Scale EE 24.10.2

System

System
SuperMicro X10DRI-T4+
2x Intel(R) Xeon(R) CPU E5-2650 v3 @ 2.30GHz
256GB ECC RAM

HBA IT-mode
9305-24i 24-Port SAS 12Gb
LSI Logic 05-25699-00 9305-24i 24-Port SAS 12Gb pci-e 3.0 IT Mode HBA Controller | eBay

Cabinet:
InterTech 4U-4424
6 rows of 4-wide drive-slots
Each row has its own SAS/SATA backplane, one SAS-cable to each row from the HBA.

Pool

Pools:

Boot
2x 480GB HPE MK000480GWUGF SSD-drives in MIRROR

Storage:
“SSD_Pool”
6x 960GB HPE-branded MK000960GWSSD

“BygdePool”
18x 14TBdrives, 3 VDEV’s of RAIDZ2

12 drives HPE-branded MB014000GWUDA
6 drives Seagate ST14000NM001G

zpool status
root@truenas[/var/empty]# zpool status
  pool: BygdePool
 state: ONLINE
  scan: scrub repaired 0B in 02:50:04 with 0 errors on Sun Mar 16 02:50:07 2025
config:

        NAME                                      STATE     READ WRITE CKSUM
        BygdePool                                 ONLINE       0     0     0
          raidz2-0                                ONLINE       0     0     0
            370e84b1-72e1-49d8-9f9d-8d283615cb59  ONLINE       0     0     0
            94caf9b7-b6c6-4c46-a4d3-594d46341f34  ONLINE       0     0     0
            822de63f-b1a0-4a6f-aec7-e2df9f07285d  ONLINE       0     0     0
            8fa24a2c-d4a7-4a94-bfe5-6a662b6b0dec  ONLINE       0     0     0
            e72da7d8-6f1d-4a82-abdb-8a07dcef7bac  ONLINE       0     0     0
            abadb5f8-6d07-43a2-87d3-bdb7adb123c2  ONLINE       0     0     0
          raidz2-1                                ONLINE       0     0     0
            5d82ba69-81cb-450b-acef-4375a8d622b1  ONLINE       0     0     0
            56588b36-f44b-4a2b-ad99-a5cdeb5aa48a  ONLINE       0     0     0
            eab6ef49-7acd-4777-88fe-f42035a3047c  ONLINE       0     0     0
            c4094a2b-382e-424d-8913-cebdd1150a8a  ONLINE       0     0     0
            80996b44-b68b-49b7-86a7-3060ea3fcba3  ONLINE       0     0     0
            c2b2ce86-2d5e-4aff-bc72-bc510facd046  ONLINE       0     0     0
          raidz2-2                                ONLINE       0     0     0
            f75bcb7a-fecb-48b4-bac6-1d82379a2cf2  ONLINE       0     0     0
            86d4edb0-fa3b-4f54-9746-d5b3a3dc7aae  ONLINE       0     0     0
            4f15c61c-b8b7-4f2e-ae98-bc95d39113f1  ONLINE       0     0     0
            ce347844-d1bb-4cc9-a228-3a91e579391e  ONLINE       0     0     0
            cdb21c6c-92d9-4305-9c00-7de03270b182  ONLINE       0     0     0
            a12e4bab-e001-4efe-85a5-9a1bdf7e69c8  ONLINE       0     0     0

errors: No known data errors

  pool: SSD_Pool
 state: ONLINE
  scan: scrub repaired 0B in 00:00:41 with 0 errors on Sun Mar 16 00:00:43 2025
config:

        NAME                                      STATE     READ WRITE CKSUM
        SSD_Pool                                  ONLINE       0     0     0
          raidz2-0                                ONLINE       0     0     0
            fb3c1dca-a1ca-4d43-9519-00a3d1c116cf  ONLINE       0     0     0
            0da1bf22-996a-4129-b48e-f153e0e01b3a  ONLINE       0     0     0
            60ec4d0d-a4d1-4da7-9dcf-fc176886ad75  ONLINE       0     0     0
            30032470-7e6d-4be4-b400-87a94049e3c8  ONLINE       0     0     0
            b28c6178-c9e1-42e3-9bd2-4a3a15116496  ONLINE       0     0     0
            387eb251-091a-4491-9226-a1d9450972ac  ONLINE       0     0     0

errors: No known data errors

  pool: boot-pool
 state: ONLINE
  scan: scrub repaired 0B in 00:00:22 with 0 errors on Mon Mar 24 03:45:25 2025
config:

        NAME        STATE     READ WRITE CKSUM
        boot-pool   ONLINE       0     0     0
          mirror-0  ONLINE       0     0     0
            sdj3    ONLINE       0     0     0
            sdf3    ONLINE       0     0     0

errors: No known data errors

sas3ircu list
root@truenas[/var/empty]# sas3ircu list
Avago Technologies SAS3 IR Configuration Utility.
Version 16.00.00.00 (2017.04.26)
Copyright (c) 2009-2017 Avago Technologies. All rights reserved.


         Adapter      Vendor  Device                       SubSys  SubSys
 Index    Type          ID      ID    Pci Address          Ven ID  Dev ID
 -----  ------------  ------  ------  -----------------    ------  ------
   0     SAS3224       1000h   c4h    00h:81h:00h:00h      1000h   31a0h
SAS3IRCU: Utility Completed Successfully.

The common pattern i see is that all the HPE (Hewlett Packard Enterprise) branded drives are the “trouble” here, both SSD and HDD.

Thanks again for taking the time. Hope the info is enough :slight_smile:

The drives look good, of course and that is a very good thing.

Thanks for posting the data as it reveled I believe you are running old HBA firmware. I am not the HBA expert but take a look at this thread, see if this solves the problem.

-Joe