tn-bench v1.11
Open Source TrueNAS Benchmarking Tool
tn-bench is an open source software script that benchmarks your TrueNAS system and collects comprehensive statistical information via the TrueNAS API. During testing, it creates temporary datasets in your pools, consuming 20 GiB of space per system thread.
Key Features
What’s Changed
Full Changelog: Comparing 1.07...1.11 · nickf1227/tn-bench · GitHub
Running the Script
git clone -b monolithic-version-1.07 https://github.com/nickf1227/TN-Bench.git && cd TN-Bench && python3 truenas-bench.py
NOTE: /dev/urandom generates inherently uncompressible data, the the value of the compression options above is minimal in the current form.
The script will display system and pool information, then prompt you to continue with the benchmarks. Follow the prompts to complete the benchmarking process.
Benchmarking Process
- Dataset Creation: The script creates a temporary dataset in each pool. The dataset is created with a 1M Record Size with no Compression and sync=Disabled using
midclt call pool.dataset.create
- Pool Write Benchmark: The script performs four runs of the write benchmark using
dd with varying thread counts. We are using /dev/urandom as our input file, so CPU performance may be relevant. This is by design as /dev/zero is flawed for this purpoose, and CPU stress is expected in real-world use anyway. The data is written in 1M chunks to a dataset with a 1M record size. For each thread, 20G of data is written. This scales with the number of threads, so a system with 16 Threads would write 320G of data.
- Pool Read Benchmark: The script performs four runs of the read benchmark using
dd with varying thread counts. We are using /dev/null as out output file, so RAM speed may be relevant. The data is read in 1M chunks from a dataset with a 1M record size. For each thread, the previously written 20G of data is read. This scales with the number of threads, so a system with 16 Threads would have read 320G of data.
NOTE: ZFS ARC will also be used and will impact your results. This may be undesirable in some circumstances, and the zfs_arc_max can be set to 1 (which means 1 byte) to prevent ARC from caching. Setting it back to 0 will restore the default behavior, but the system will need to be restarted!
I have tested several permutations of file sizes on a dozen systems with varying amount of storage types, space, and RAM. Eventually settled on the current behavior for several reasons. Primarily, I wanted to reduce the impact of, but not REMOVE the ZFS ARC, since in a real world scenario, you would be leveraging the benefits of ARC caching. However, in order to avoid insanely unrealistic results, I needed to use file sizes that saturate the ARC completely. I believe this gives us the best data possible.
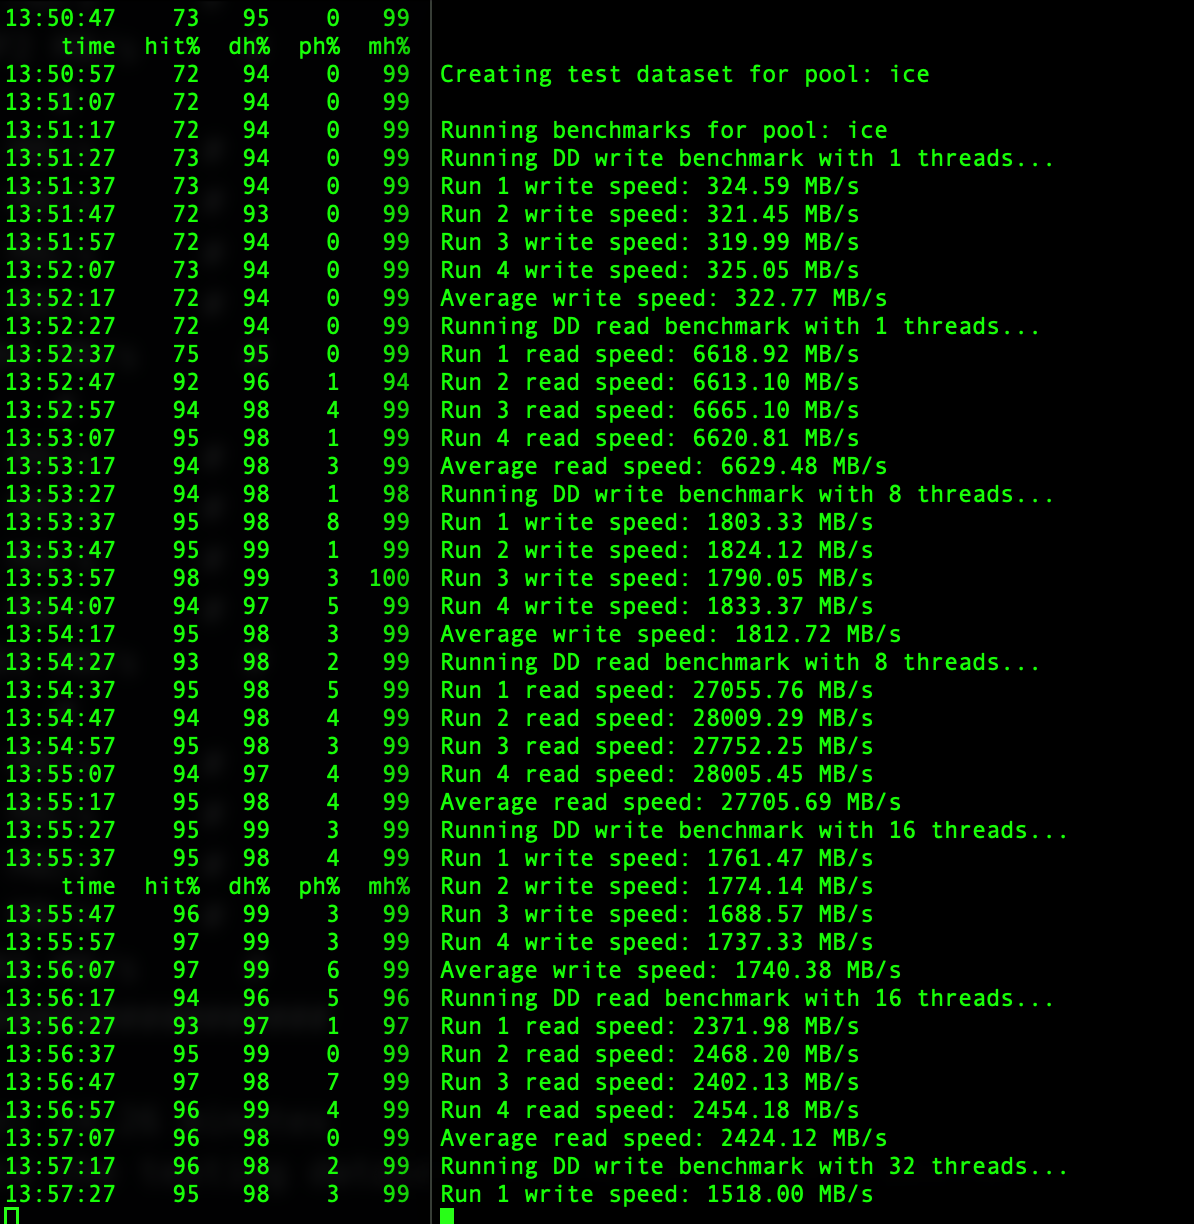
Example of arcstat -f time,hit%,dh%,ph%,mh% 10 running while the benchmark is running.
-
Disk Benchmark: The script performs four runs of the read benchmark using dd with varying thread counts. Calculated based on the size of your RAM and the disks, data already on each disk is read in 4K chunks to /dev/null , making this a 4K sequential read test. 4K was chosen because ashift=12 for all recent ZFS pools created in TrueNAS. The amount of data read is so large to try and avoid ARC caching. Run-to-run variance is still expected, particularly on SSDs, as the data ends up inside of internal caches. For this reason, it is run 4 times and averaged.
-
Results: The script displays the results for each run and the average speed. This should give you an idea of the impacts of various thread-counts (as a synthetic representation of client-counts) and the ZFS ARC caching mechanism.
NOTE: The script’s run duration is dependant on the number of threads in your system as well as the number of disks in your system. Small all-flash systems may complete this benchmark in 25 minutes, while larger systems with spinning hardrives may take several hours. The script will not stop other I/O activity on a production system, but will severely limit performance. This benchmark is best run on a system with no other workload. This will give you the best outcome in terms of the accuracy of the data, in addition to not creating angry users.
Performance Considerations
ARC Behavior
- ARC hit rate decreases as working set exceeds cache size, which TN-Bench intentionally causes.
- Results reflect mixed cache hit/miss scenarios, not neccesarily indicative of a real world workload.
Resource Requirements
| Resource Type |
Requirement |
| Pool Test Space |
20 GiB per thread |
Execution Time
- Small all-flash systems: ~10-30 minutes
- Large HDD arrays: Several hours or more
- Progress indicators: Provided at each stage
- Status updates: For each benchmark operation
Cleanup Options
The script provides interactive prompts to delete test datasets after benchmarking. All temporary files are automatically removed.
Delete testing dataset fire/tn-bench? (yes/no): yes
✓ Dataset fire/tn-bench deleted.
UI Enhancement
The script is now colorized and more human readable.
Output file
python3 truenas-bench.py [--output /root/my_results.json]
A shareable JSON file can be generated, we have an initial version 1.0 schema, with the intention of eventually adding new fields without breaking the existing structure.
{
  "schema_version": "1.0",
  "metadata": {
    "start_timestamp": "2025-03-15T14:30:00",
    "end_timestamp": "2025-03-15T15:15:00",
    "duration_minutes": 45.0,
    "benchmark_config": {
      "selected_pools": ["tank", "backups"],
      "disk_benchmark_run": true,
      "zfs_iterations": 2,
      "disk_iterations": 1
    }
  },
  "system": {
    "os_version": "25.04.1",
    "load_average_1m": 0.85,
    "load_average_5m": 1.2,
    "load_average_15m": 1.1,
    "cpu_model": "Intel Xeon Silver 4210",
    "logical_cores": 40,
    "physical_cores": 20,
    "system_product": "TRUENAS-M50",
    "memory_gib": 251.56
  },
  "pools": [
    {
      "name": "tank",
      "path": "/mnt/tank",
      "status": "ONLINE",
      "vdevs": [
        {"name": "raidz2-0", "type": "RAIDZ2", "disk_count": 8}
      ],
      "benchmark": [
        {
          "threads": 1,
          "write_speeds": [205.57, 209.95],
          "average_write_speed": 207.76,
          "read_speeds": [4775.63, 5029.35],
          "average_read_speed": 4902.49,
          "iterations": 2
        }
      ]
    }
  ],
  "disks": [
    {
      "name": "ada0",
      "model": "ST12000VN0008",
      "serial": "ABC123",
      "zfs_guid": "1234567890",
      "pool": "tank",
      "size_gib": 10999.99,
      "benchmark": {
        "speeds": [210.45],
        "average_speed": 210.45,
        "iterations": 1
      }
    }
  ]
}
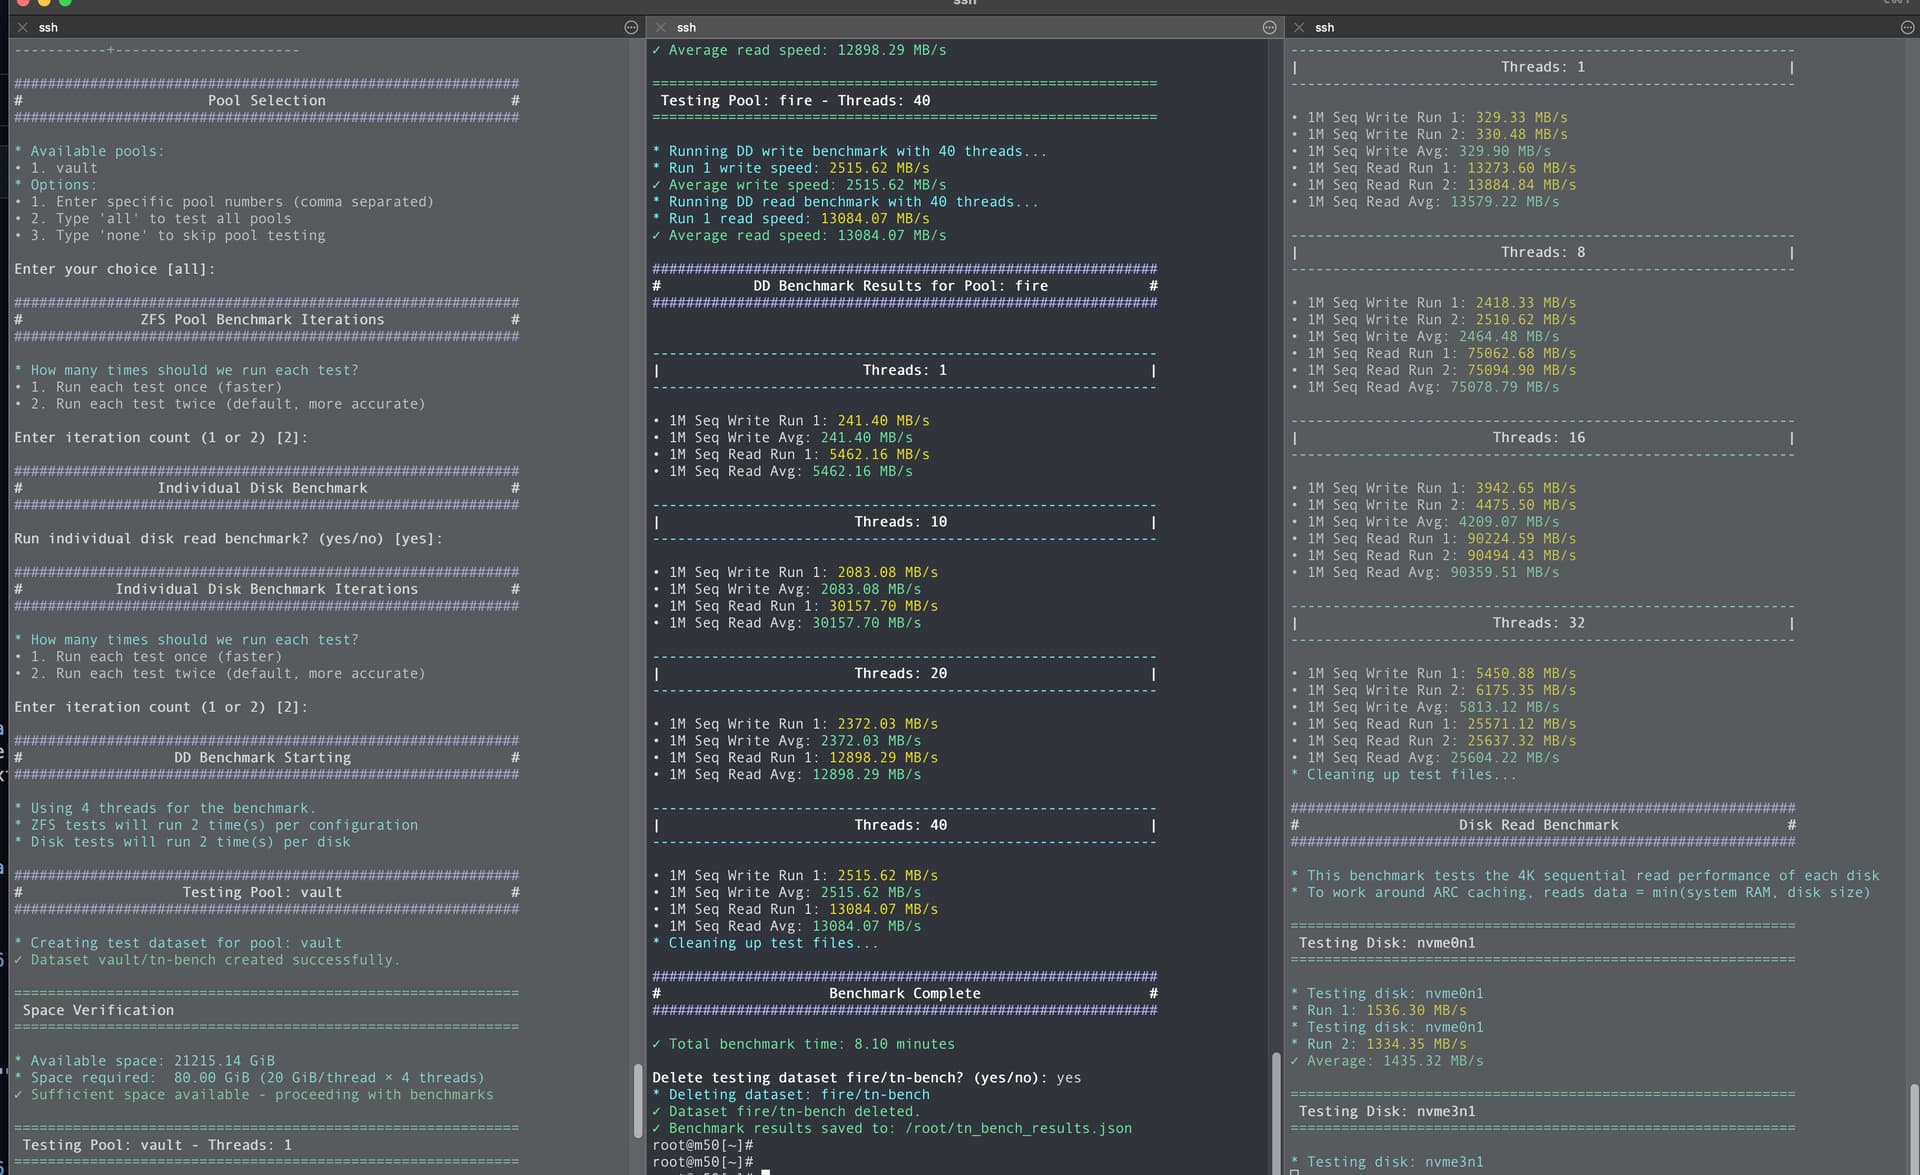
Example Output (example test was performed on a busy system, don’t do that)
############################################################
#                      TN-Bench v1.11                      #
############################################################

TN-Bench is an OpenSource Software Script that uses standard tools to
Benchmark your System and collect various statistical information via
the TrueNAS API.

* TN-Bench will create a Dataset in each of your pools for testing purposes
* that will consume 20 GiB of space for every thread in your system.

! WARNING: This test will make your system EXTREMELY slow during its run.
! WARNING: It is recommended to run this test when no other workloads are running.

* ZFS ARC will impact your results. You can set zfs_arc_max to 1 to prevent ARC caching.
* Setting it back to 0 restores default behavior but requires a system restart.

============================================================
 Confirmation
============================================================

Would you like to continue? (yes/no): yes

------------------------------------------------------------
|                    System Information                    |
------------------------------------------------------------

Field                 | Value
----------------------+-------------------------------------------
Version               | 25.04.1
Load Average (1m)     | 25.52880859375
Load Average (5m)     | 27.32177734375
Load Average (15m)    | 30.61474609375
Model                 | Intel(R) Xeon(R) Silver 4114 CPU @ 2.20GHz
Cores                 | 40
Physical Cores        | 20
System Product        | TRUENAS-M50-S
Physical Memory (GiB) | 251.56

------------------------------------------------------------
|                     Pool Information                     |
------------------------------------------------------------

Field      | Value
-----------+----------
Name       | fire
Path       | /mnt/fire
Status     | ONLINE
VDEV Count | 1
Disk Count | 4

VDEV Name  | Type           | Disk Count
-----------+----------------+---------------
raidz1-0    | RAIDZ1         | 4

------------------------------------------------------------
|                     Pool Information                     |
------------------------------------------------------------

Field      | Value
-----------+---------
Name       | ice
Path       | /mnt/ice
Status     | ONLINE
VDEV Count | 5
Disk Count | 35

VDEV Name  | Type           | Disk Count
-----------+----------------+---------------
raidz2-0    | RAIDZ2         | 7
raidz2-1    | RAIDZ2         | 7
raidz2-2    | RAIDZ2         | 7
raidz2-3    | RAIDZ2         | 7
raidz2-4    | RAIDZ2         | 7

------------------------------------------------------------
|                     Disk Information                     |
------------------------------------------------------------

* The TrueNAS API returns N/A for the Pool for boot devices and disks not in a pool.
Field      | Value
-----------+---------------------------
Name       | sdam
Model      | KINGSTON_SA400S37120G
Serial     | 50026B7784064E49
ZFS GUID   | None
Pool       | N/A
Size (GiB) | 111.79
-----------+---------------------------
Name       | nvme0n1
Model      | INTEL SSDPE2KE016T8
Serial     | PHLN013100MD1P6AGN
ZFS GUID   | 17475493647287877073
Pool       | fire
Size (GiB) | 1400.00
-----------+---------------------------
Name       | nvme1n1
Model      | INTEL SSDPE2KE016T8
Serial     | PHLN931600FE1P6AGN
ZFS GUID   | 11275382002255862348
Pool       | fire
Size (GiB) | 1400.00
-----------+---------------------------
Name       | nvme2n1
Model      | SAMSUNG MZWLL1T6HEHP-00003
Serial     | S3HDNX0KB01220
ZFS GUID   | 4368323531340162613
Pool       | fire
Size (GiB) | 1399.22
-----------+---------------------------
Name       | nvme3n1
Model      | SAMSUNG MZWLL1T6HEHP-00003
Serial     | S3HDNX0KB01248
ZFS GUID   | 3818548647571812337
Pool       | fire
Size (GiB) | 1399.22
-----------+---------------------------
Name       | sdh
Model      | HUSMH842_CLAR200
Serial     | 0LX1V8ZA
ZFS GUID   | 1629581284555035932
Pool       | N/A
Size (GiB) | 186.31
-----------+---------------------------
Name       | sda
Model      | HUSMH842_CLAR200
Serial     | 0LX1V4NA
ZFS GUID   | 8800999671142185461
Pool       | N/A
Size (GiB) | 186.31
-----------+---------------------------
Name       | sdv
Model      | HUS728T8TAL4204
Serial     | VAHD4XTL
ZFS GUID   | 6447577595542961760
Pool       | ice
Size (GiB) | 7452.04
-----------+---------------------------
Name       | sdab
Model      | HUS728T8TAL4204
Serial     | VAHE4AJL
ZFS GUID   | 11464489017973229028
Pool       | ice
Size (GiB) | 7452.04
-----------+---------------------------
Name       | sdx
Model      | HUS728T8TAL4204
Serial     | VAHD4ZUL
ZFS GUID   | 2629839678881986450
Pool       | ice
Size (GiB) | 7452.04
-----------+---------------------------
Name       | sdaf
Model      | HUS728T8TAL4204
Serial     | VAHAHSEL
ZFS GUID   | 6248787858642409255
Pool       | ice
Size (GiB) | 7452.04
-----------+---------------------------
Name       | sdt
Model      | HUS728T8TAL4204
Serial     | VAH751XL
ZFS GUID   | 12194731234089258709
Pool       | ice
Size (GiB) | 7452.04
-----------+---------------------------
Name       | sdn
Model      | HUS728T8TAL4204
Serial     | VAHDEEEL
ZFS GUID   | 4070674839367337299
Pool       | ice
Size (GiB) | 7452.04
-----------+---------------------------
Name       | sdl
Model      | HUS728T8TAL4204
Serial     | VAHD4V0L
ZFS GUID   | 1890505091264157917
Pool       | ice
Size (GiB) | 7452.04
-----------+---------------------------
Name       | sdp
Model      | HUS728T8TAL4204
Serial     | VAHDHLVL
ZFS GUID   | 2813416134184314367
Pool       | ice
Size (GiB) | 7452.04
-----------+---------------------------
Name       | sdr
Model      | HUS728T8TAL4204
Serial     | VAHD99LL
ZFS GUID   | 663480060468884393
Pool       | ice
Size (GiB) | 7452.04
-----------+---------------------------
Name       | sds
Model      | HUS728T8TAL4204
Serial     | VAHDXDVL
ZFS GUID   | 12468174715504800729
Pool       | ice
Size (GiB) | 7452.04
-----------+---------------------------
Name       | sdw
Model      | HUS728T8TAL4204
Serial     | VAH7T9BL
ZFS GUID   | 241834966907461809
Pool       | ice
Size (GiB) | 7452.04
-----------+---------------------------
Name       | sdu
Model      | HUS728T8TAL4204
Serial     | VAGU6KLL
ZFS GUID   | 8435778198864465328
Pool       | ice
Size (GiB) | 7452.04
-----------+---------------------------
Name       | sdy
Model      | HUH721010AL42C0
Serial     | 2TGU89UD
ZFS GUID   | 10368835707209052527
Pool       | ice
Size (GiB) | 9314.00
-----------+---------------------------
Name       | sdz
Model      | HUS728T8TAL4204
Serial     | VAHE4BDL
ZFS GUID   | 12575810268036164475
Pool       | ice
Size (GiB) | 7452.04
-----------+---------------------------
Name       | sdak
Model      | HUS728T8TAL4204
Serial     | VAH4T4TL
ZFS GUID   | 15395414914633738779
Pool       | ice
Size (GiB) | 7452.04
-----------+---------------------------
Name       | sdal
Model      | HUS728T8TAL4204
Serial     | VAHDBDXL
ZFS GUID   | 480631239828802416
Pool       | ice
Size (GiB) | 7452.04
-----------+---------------------------
Name       | sdaa
Model      | HUS728T8TAL4204
Serial     | VAH7B0EL
ZFS GUID   | 3357271669658868424
Pool       | ice
Size (GiB) | 7452.04
-----------+---------------------------
Name       | sdae
Model      | HUS728T8TAL4204
Serial     | VAHD4UXL
ZFS GUID   | 12084474217870916236
Pool       | ice
Size (GiB) | 7452.04
-----------+---------------------------
Name       | sdag
Model      | HUS728T8TAL4204
Serial     | VAHE4AEL
ZFS GUID   | 12420098536708636925
Pool       | ice
Size (GiB) | 7452.04
-----------+---------------------------
Name       | sdac
Model      | HUS728T8TAL4204
Serial     | VAHE35SL
ZFS GUID   | 15641419920947187991
Pool       | ice
Size (GiB) | 7452.04
-----------+---------------------------
Name       | sdad
Model      | HUS728T8TAL4204
Serial     | VAH73TVL
ZFS GUID   | 2321010819975352589
Pool       | ice
Size (GiB) | 7452.04
-----------+---------------------------
Name       | sdah
Model      | HUS728T8TAL4204
Serial     | VAH0LL4L
ZFS GUID   | 7064277241025105086
Pool       | ice
Size (GiB) | 7452.04
-----------+---------------------------
Name       | sdai
Model      | HUS728T8TAL4204
Serial     | VAHBHYGL
ZFS GUID   | 9631990446359566766
Pool       | ice
Size (GiB) | 7452.04
-----------+---------------------------
Name       | sdaj
Model      | HUS728T8TAL4204
Serial     | VAHE7BGL
ZFS GUID   | 10666041267281724571
Pool       | ice
Size (GiB) | 7452.04
-----------+---------------------------
Name       | sdb
Model      | HUS728T8TAL4204
Serial     | VAHD406L
ZFS GUID   | 17233219398105449109
Pool       | N/A
Size (GiB) | 7452.04
-----------+---------------------------
Name       | sdc
Model      | HUS728T8TAL4204
Serial     | VAHEE12L
ZFS GUID   | 14718135334986108667
Pool       | ice
Size (GiB) | 7452.04
-----------+---------------------------
Name       | sdj
Model      | HUS728T8TAL4204
Serial     | VAHE1J1L
ZFS GUID   | 16530722200458359384
Pool       | ice
Size (GiB) | 7452.04
-----------+---------------------------
Name       | sdo
Model      | HUS728T8TAL4204
Serial     | VAHDRYYL
ZFS GUID   | 9383799614074970413
Pool       | ice
Size (GiB) | 7452.04
-----------+---------------------------
Name       | sde
Model      | HUS728T8TAL4204
Serial     | VAHDPGUL
ZFS GUID   | 6453720879157404243
Pool       | ice
Size (GiB) | 7452.04
-----------+---------------------------
Name       | sdd
Model      | HUS728T8TAL4204
Serial     | VAH7XX5L
ZFS GUID   | 2415210037473635969
Pool       | ice
Size (GiB) | 7452.04
-----------+---------------------------
Name       | sdf
Model      | HUS728T8TAL4204
Serial     | VAHD06XL
ZFS GUID   | 7980293907302437342
Pool       | ice
Size (GiB) | 7452.04
-----------+---------------------------
Name       | sdg
Model      | HUS728T8TAL4204
Serial     | VAH5W6PL
ZFS GUID   | 2650944322410844617
Pool       | ice
Size (GiB) | 7452.04
-----------+---------------------------
Name       | sdi
Model      | HUS728T8TAL4204
Serial     | VAHDRZEL
ZFS GUID   | 8709587202117841210
Pool       | ice
Size (GiB) | 7452.04
-----------+---------------------------
Name       | sdm
Model      | HUS728T8TAL4204
Serial     | VAHDPS6L
ZFS GUID   | 5227492984876952151
Pool       | ice
Size (GiB) | 7452.04
-----------+---------------------------
Name       | sdk
Model      | HUS728T8TAL4204
Serial     | VAHDX95L
ZFS GUID   | 13388807557241155624
Pool       | ice
Size (GiB) | 7452.04
-----------+---------------------------
Name       | sdq
Model      | HUS728T8TAL4204
Serial     | VAGEAVDL
ZFS GUID   | 4320819603845537000
Pool       | ice
Size (GiB) | 7452.04
-----------+---------------------------

############################################################
#                      Pool Selection                      #
############################################################

* Available pools:
• 1. fire
• 2. ice
* Options:
• 1. Enter specific pool numbers (comma separated)
• 2. Type 'all' to test all pools
• 3. Type 'none' to skip pool testing

Enter your choice [all]: 1

############################################################
#              ZFS Pool Benchmark Iterations               #
############################################################

* How many times should we run each test?
• 1. Run each test once (faster)
• 2. Run each test twice (default, more accurate)

Enter iteration count (1 or 2) [2]: 2

############################################################
#                Individual Disk Benchmark                 #
############################################################

Run individual disk read benchmark? (yes/no) [yes]: no
* Skipping individual disk benchmark.

############################################################
#                  DD Benchmark Starting                   #
############################################################

* Using 40 threads for the benchmark.
* ZFS tests will run 2 time(s) per configuration

############################################################
#                    Testing Pool: fire                    #
############################################################

* Creating test dataset for pool: fire
✓ Dataset fire/tn-bench created successfully.

============================================================
 Space Verification
============================================================

* Available space: 2837.35 GiB
* Space required:  800.00 GiB (20 GiB/thread × 40 threads)
✓ Sufficient space available - proceeding with benchmarks

============================================================
 Testing Pool: fire - Threads: 1
============================================================

* Running DD write benchmark with 1 threads...
* Run 1 write speed: 204.96 MB/s
* Run 2 write speed: 202.36 MB/s
✓ Average write speed: 203.66 MB/s
* Running DD read benchmark with 1 threads...
* Run 1 read speed: 4863.65 MB/s
* Run 2 read speed: 5009.58 MB/s
✓ Average read speed: 4936.62 MB/s

============================================================
 Testing Pool: fire - Threads: 10
============================================================

* Running DD write benchmark with 10 threads...
* Run 1 write speed: 1678.29 MB/s
* Run 2 write speed: 1644.88 MB/s
✓ Average write speed: 1661.58 MB/s
* Running DD read benchmark with 10 threads...
* Run 1 read speed: 15826.33 MB/s
* Run 2 read speed: 15528.85 MB/s
✓ Average read speed: 15677.59 MB/s

============================================================
 Testing Pool: fire - Threads: 20
============================================================

* Running DD write benchmark with 20 threads...
* Run 1 write speed: 2185.88 MB/s
* Run 2 write speed: 2278.53 MB/s
✓ Average write speed: 2232.20 MB/s
* Running DD read benchmark with 20 threads...
* Run 1 read speed: 12733.72 MB/s
* Run 2 read speed: 12943.13 MB/s
✓ Average read speed: 12838.42 MB/s

============================================================
 Testing Pool: fire - Threads: 40
============================================================

* Running DD write benchmark with 40 threads...
* Run 1 write speed: 2669.99 MB/s
* Run 2 write speed: 2813.70 MB/s
✓ Average write speed: 2741.84 MB/s
* Running DD read benchmark with 40 threads...
* Run 1 read speed: 12787.97 MB/s
* Run 2 read speed: 12562.84 MB/s
✓ Average read speed: 12675.40 MB/s

############################################################
#           DD Benchmark Results for Pool: fire            #
############################################################


------------------------------------------------------------
|                        Threads: 1                        |
------------------------------------------------------------

• 1M Seq Write Run 1: 204.96 MB/s
• 1M Seq Write Run 2: 202.36 MB/s
• 1M Seq Write Avg: 203.66 MB/s
• 1M Seq Read Run 1: 4863.65 MB/s
• 1M Seq Read Run 2: 5009.58 MB/s
• 1M Seq Read Avg: 4936.62 MB/s

------------------------------------------------------------
|                       Threads: 10                        |
------------------------------------------------------------

• 1M Seq Write Run 1: 1678.29 MB/s
• 1M Seq Write Run 2: 1644.88 MB/s
• 1M Seq Write Avg: 1661.58 MB/s
• 1M Seq Read Run 1: 15826.33 MB/s
• 1M Seq Read Run 2: 15528.85 MB/s
• 1M Seq Read Avg: 15677.59 MB/s

------------------------------------------------------------
|                       Threads: 20                        |
------------------------------------------------------------

• 1M Seq Write Run 1: 2185.88 MB/s
• 1M Seq Write Run 2: 2278.53 MB/s
• 1M Seq Write Avg: 2232.20 MB/s
• 1M Seq Read Run 1: 12733.72 MB/s
• 1M Seq Read Run 2: 12943.13 MB/s
• 1M Seq Read Avg: 12838.42 MB/s

------------------------------------------------------------
|                       Threads: 40                        |
------------------------------------------------------------

• 1M Seq Write Run 1: 2669.99 MB/s
• 1M Seq Write Run 2: 2813.70 MB/s
• 1M Seq Write Avg: 2741.84 MB/s
• 1M Seq Read Run 1: 12787.97 MB/s
• 1M Seq Read Run 2: 12562.84 MB/s
• 1M Seq Read Avg: 12675.40 MB/s
* Cleaning up test files...

############################################################
#                    Benchmark Complete                    #
############################################################

✓ Total benchmark time: 16.01 minutes
Contributing
Contributions are welcome! Please open an issue or submit a pull request for any improvements or fixes.
License
This project is licensed under the GPLv3 License - see the LICENSE file for details.