That’s awesome though- grats ![]()
This is a community resource that is not officially endorsed by, or supported by iXsystems. Instead it is a personal passion project, and all of my opinions are my own.
Backstory (You can skip ahead)
About 18 months ago my furnace smogged up my whole basement, which is incidentally where all of my computers are. All of the computers (2 EPYC servers, and now my gaming desktop) from that time slowly died off, because carbon build up, despite my best efforts.
Essentially the TLDR; is; I built a new Gaming PC shortly after that happened…and I repurposed my old one as a TrueNAS. I needed to improvise things for a while after that, I wanted to connect a LUN to my new gaming desktop via the magic of TrueNAS. Was working great…Well, now that motherboard crapped out.
Because I “DD” (not dd) a Mac Mini 2018, so I’m stuck with 512GB of local disk…
I have an obnoxiously large “Home Directory” synced between it and my Windows PC… and keeping all of that in sync meant I needed to store stuff “somewhere else” in Windows, and I wanted it fast.
Today I finally resurected one of the EPYC servers I lost. I got a new case, and a replacement motherboard. Old RAM and CPU all check out after a a day of memtest86. Basically I just did a forklift of the motherboard and case…reused all of the other parts I already had.
Some I cleaned with IPA…others I soaked in IPA… and all dried inside a Corsi Rosenthal Box
System Migration, Same Pool
How this all relates to TN-Bench (now tn-bench) is…benchmarking. I have a 3-week old result from that previous system,
Specs
Ryzen 5600G 6C-12T 3.2GHz Base
Gigabyte AORUTS X570 Elite Pro?
32GB 3200MHz G.sKill
RAIDZ1 - Single VDEV - 5x Intel Optane 905P 960GB
So now I have, what I had before,
AMD EPYC 7F52 16C-32T
REPLACEMENT Supermicro H12-SSL-I
256 GB (8X32G) DDR4 3200MHz RDIMM
RAIDZ1 - Single VDEV - 5x Intel Optane 905P 960GB
In the old forum I had done some testing with differant PHY/BUS layers or Generational Improcements…Like doing bifurcation or using a PLX switch or upgrading from one hardware generation to the next.
I hope to pick this back up in a more meaningful way now, measured with tn-bench. Lots more PCI-E lanes to play with ![]()
Old Threads for Reference:
But for now…I just want to see how these two wildly differant systems compare in tn-bench See other benchmarks here https://cpu-benchmark.org/compare/amd-epyc-7f52/amd-ryzen-5-5600g/
Starting that off these are the results I got from the Ryzen 5 5600G rig about 3 weeks ago (when I updated this program last). It died about 2 weeks after this happened.
Ryzen 5 5600G Full Result
###################################
#                                 #
#          TN-Bench v1.07         #
#          MONOLITHIC.            #
#                                 #
###################################
TN-Bench is an OpenSource Software Script that uses standard tools to Benchmark your System and collect various statistical information via the TrueNAS API.

TN-Bench will make a Dataset in each of your pools for the purposes of this testing that will consume 20 GiB of space for every thread in your system during its run.

After which time we will prompt you to delete the dataset which was created.
###################################

WARNING: This test will make your system EXTREMELY slow during its run. It is recommended to run this test when no other workloads are running.

NOTE: ZFS ARC will also be used and will impact your results. This may be undesirable in some circumstances, and the zfs_arc_max can be set to 1 (which means 1 byte) to prevent ARC from caching.

NOTE: Setting it back to 0 will restore the default behavior, but the system will need to be restarted!
###################################

Would you like to continue? (yes/no): yes

### System Information ###
Field                 | Value
----------------------+---------------------------------------
Version               | 25.04.0
Load Average (1m)     | 0.1220703125
Load Average (5m)     | 0.2275390625
Load Average (15m)    | 0.25244140625
Model                 | AMD Ryzen 5 5600G with Radeon Graphics
Cores                 | 12
Physical Cores        | 6
System Product        | X570 AORUS ELITE
Physical Memory (GiB) | 30.75

### Pool Information ###
Field      | Value
-----------+-------------
Name       | inferno
Path       | /mnt/inferno
Status     | ONLINE
VDEV Count | 1
Disk Count | 5

VDEV Name  | Type           | Disk Count
-----------+----------------+---------------
raidz1-0    | RAIDZ1         | 5

### Disk Information ###
###################################

NOTE: The TrueNAS API will return N/A for the Pool for the boot device(s) as well as any disk is not a member of a pool.
###################################
Field      | Value
-----------+---------------------------
Name       | nvme0n1
Model      | INTEL SSDPE21D960GA
Serial     | PHM29081000X960CGN
ZFS GUID   | 212601209224793468
Pool       | inferno
Size (GiB) | 894.25
-----------+---------------------------
-----------+---------------------------
Name       | nvme2n1
Model      | INTEL SSDPE21D960GA
Serial     | PHM2913000QM960CGN
ZFS GUID   | 16221756077833732578
Pool       | inferno
Size (GiB) | 894.25
-----------+---------------------------
-----------+---------------------------
Name       | nvme4n1
Model      | INTEL SSDPE21D960GA
Serial     | PHM2913000YF960CGN
ZFS GUID   | 8625327235819249102
Pool       | inferno
Size (GiB) | 894.25
-----------+---------------------------
-----------+---------------------------
Name       | nvme5n1
Model      | INTEL SSDPE21D960GA
Serial     | PHM2913000DC960CGN
ZFS GUID   | 11750420763846093416
Pool       | inferno
Size (GiB) | 894.25
-----------+---------------------------
-----------+---------------------------
Name       | nvme3n1
Model      | SAMSUNG MZVL2512HCJQ-00BL7
Serial     | S64KNX2T216015
ZFS GUID   | None
Pool       | N/A
Size (GiB) | 476.94
-----------+---------------------------
-----------+---------------------------
Name       | nvme1n1
Model      | INTEL SSDPE21D960GA
Serial     | PHM2908101QG960CGN
ZFS GUID   | 10743034860780890768
Pool       | inferno
Size (GiB) | 894.25
-----------+---------------------------
-----------+---------------------------

###################################
#       DD Benchmark Starting     #
###################################
Using 12 threads for the benchmark.


Creating test dataset for pool: inferno
Created temporary dataset: inferno/tn-bench
Dataset inferno/tn-bench created successfully.

=== Space Verification ===
Available space: 765.37 GiB
Space required:  240.00 GiB (20 GiB/thread × 12 threads)

 Sufficient space available - proceeding with benchmarks...

###################################
#                                 #
#       DD Benchmark Starting     #
#                                 #
###################################
Using 12 threads for the benchmark.


Creating test dataset for pool: inferno
Dataset inferno/tn-bench created successfully.

Running benchmarks for pool: inferno
Running DD write benchmark with 1 threads...
Run 1 write speed: 408.21 MB/s
Run 2 write speed: 404.35 MB/s
Average write speed: 406.28 MB/s
Running DD read benchmark with 1 threads...
Run 1 read speed: 10529.35 MB/s
Run 2 read speed: 14742.91 MB/s
Average read speed: 12636.13 MB/s
Running DD write benchmark with 3 threads...
Run 1 write speed: 1145.73 MB/s
Run 2 write speed: 1141.83 MB/s
Average write speed: 1143.78 MB/s
Running DD read benchmark with 3 threads...
Run 1 read speed: 8261.30 MB/s
Run 2 read speed: 8395.17 MB/s
Average read speed: 8328.24 MB/s
Running DD write benchmark with 6 threads...
Run 1 write speed: 1838.74 MB/s
Run 2 write speed: 1846.15 MB/s
Average write speed: 1842.44 MB/s
Running DD read benchmark with 6 threads...
Run 1 read speed: 8424.02 MB/s
Run 2 read speed: 8464.73 MB/s
Average read speed: 8444.38 MB/s
Running DD write benchmark with 12 threads...
Run 1 write speed: 2217.72 MB/s
Run 2 write speed: 2247.58 MB/s
Average write speed: 2232.65 MB/s
Running DD read benchmark with 12 threads...
Run 1 read speed: 8469.45 MB/s
Run 2 read speed: 8508.80 MB/s
Average read speed: 8489.13 MB/s

###################################
#         DD Benchmark Results for Pool: inferno    #
###################################
#    Threads: 1    #
#    1M Seq Write Run 1: 408.21 MB/s     #
#    1M Seq Write Run 2: 404.35 MB/s     #
#    1M Seq Write Avg: 406.28 MB/s #
#    1M Seq Read Run 1: 10529.35 MB/s      #
#    1M Seq Read Run 2: 14742.91 MB/s      #
#    1M Seq Read Avg: 12636.13 MB/s  #
###################################
#    Threads: 3    #
#    1M Seq Write Run 1: 1145.73 MB/s     #
#    1M Seq Write Run 2: 1141.83 MB/s     #
#    1M Seq Write Avg: 1143.78 MB/s #
#    1M Seq Read Run 1: 8261.30 MB/s      #
#    1M Seq Read Run 2: 8395.17 MB/s      #
#    1M Seq Read Avg: 8328.24 MB/s  #
###################################
#    Threads: 6    #
#    1M Seq Write Run 1: 1838.74 MB/s     #
#    1M Seq Write Run 2: 1846.15 MB/s     #
#    1M Seq Write Avg: 1842.44 MB/s #
#    1M Seq Read Run 1: 8424.02 MB/s      #
#    1M Seq Read Run 2: 8464.73 MB/s      #
#    1M Seq Read Avg: 8444.38 MB/s  #
###################################
#    Threads: 12    #
#    1M Seq Write Run 1: 2217.72 MB/s     #
#    1M Seq Write Run 2: 2247.58 MB/s     #
#    1M Seq Write Avg: 2232.65 MB/s #
#    1M Seq Read Run 1: 8469.45 MB/s      #
#    1M Seq Read Run 2: 8508.80 MB/s      #
#    1M Seq Read Avg: 8489.13 MB/s  #
###################################
Cleaning up test files...
Running disk read benchmark...
###################################
This benchmark tests the 4K sequential read performance of each disk in the system using dd. It is run 2 times for each disk and averaged.
In order to work around ARC caching in systems with it still enabled, This benchmark reads data in the amount of total system RAM or the total size of the disk, whichever is smaller.
###################################
Testing disk: nvme0n1
Testing disk: nvme0n1
Testing disk: nvme2n1
Testing disk: nvme2n1
Testing disk: nvme4n1
Testing disk: nvme4n1
Testing disk: nvme5n1
Testing disk: nvme5n1
Testing disk: nvme3n1
Testing disk: nvme3n1
Testing disk: nvme1n1
Testing disk: nvme1n1

###################################
#         Disk Read Benchmark Results   #
###################################
#    Disk: nvme0n1    #
#    Run 1: 1735.62 MB/s     #
#    Run 2: 1543.09 MB/s     #
#    Average: 1639.36 MB/s     #
#    Disk: nvme2n1    #
#    Run 1: 1526.69 MB/s     #
#    Run 2: 1432.16 MB/s     #
#    Average: 1479.42 MB/s     #
#    Disk: nvme4n1    #
#    Run 1: 1523.02 MB/s     #
#    Run 2: 1412.82 MB/s     #
#    Average: 1467.92 MB/s     #
#    Disk: nvme5n1    #
#    Run 1: 1523.86 MB/s     #
#    Run 2: 1463.96 MB/s     #
#    Average: 1493.91 MB/s     #
#    Disk: nvme3n1    #
#    Run 1: 1533.71 MB/s     #
#    Run 2: 1482.33 MB/s     #
#    Average: 1508.02 MB/s     #
#    Disk: nvme1n1    #
#    Run 1: 1624.40 MB/s     #
#    Run 2: 1547.07 MB/s     #
#    Average: 1585.73 MB/s     #
###################################

Total benchmark time: 10.62 minutes
EPYC 75F2 Full Result
oot@prod:/mnt/inferno/tn_scripts/TN-Bench# ls
 LICENSE   README.md  'et.query '   truenas-bench.py
root@prod:/mnt/inferno/tn_scripts/TN-Bench# python3 truenas-bench.py

###################################
#                                 #
#          TN-Bench v1.07         #
#          MONOLITHIC.            #
#                                 #
###################################
TN-Bench is an OpenSource Software Script that uses standard tools to Benchmark your System and collect various statistical information via the TrueNAS API.

TN-Bench will make a Dataset in each of your pools for the purposes of this testing that will consume 20 GiB of space for every thread in your system during its run.

After which time we will prompt you to delete the dataset which was created.
###################################

WARNING: This test will make your system EXTREMELY slow during its run. It is recommended to run this test when no other workloads are running.

NOTE: ZFS ARC will also be used and will impact your results. This may be undesirable in some circumstances, and the zfs_arc_max can be set to 1 (which means 1 byte) to prevent ARC from caching.

NOTE: Setting it back to 0 will restore the default behavior, but the system will need to be restarted!
###################################

Would you like to continue? (yes/no): yes

### System Information ###
Field                 | Value
----------------------+--------------------------------
Version               | 25.10.0-MASTER-20250520-015451
Load Average (1m)     | 0.025390625
Load Average (5m)     | 0.07666015625
Load Average (15m)    | 0.0556640625
Model                 | AMD EPYC 7F52 16-Core Processor
Cores                 | 32
Physical Cores        | 16
System Product        | Super Server
Physical Memory (GiB) | 251.55

### Pool Information ###
Field      | Value
-----------+-------------
Name       | inferno
Path       | /mnt/inferno
Status     | ONLINE
VDEV Count | 1
Disk Count | 5

VDEV Name  | Type           | Disk Count
-----------+----------------+---------------
raidz1-0    | RAIDZ1         | 5

### Disk Information ###
###################################

NOTE: The TrueNAS API will return N/A for the Pool for the boot device(s) as well as any disk is not a member of a pool.
###################################
Field      | Value
-----------+---------------------------
Name       | nvme0n1
Model      | INTEL SSDPE21D960GA
Serial     | PHM29081000X960CGN
ZFS GUID   | 212601209224793468
Pool       | inferno
Size (GiB) | 894.25
-----------+---------------------------
-----------+---------------------------
Name       | nvme3n1
Model      | INTEL SSDPE21D960GA
Serial     | PHM2913000QM960CGN
ZFS GUID   | 16221756077833732578
Pool       | inferno
Size (GiB) | 894.25
-----------+---------------------------
-----------+---------------------------
Name       | nvme2n1
Model      | INTEL SSDPE21D960GA
Serial     | PHM2913000DC960CGN
ZFS GUID   | 11750420763846093416
Pool       | inferno
Size (GiB) | 894.25
-----------+---------------------------
-----------+---------------------------
Name       | nvme4n1
Model      | SAMSUNG MZVL2512HCJQ-00BL7
Serial     | S64KNX2T216015
ZFS GUID   | None
Pool       | N/A
Size (GiB) | 476.94
-----------+---------------------------
-----------+---------------------------
Name       | nvme5n1
Model      | INTEL SSDPE21D960GA
Serial     | PHM2908101QG960CGN
ZFS GUID   | 10743034860780890768
Pool       | inferno
Size (GiB) | 894.25
-----------+---------------------------
-----------+---------------------------
Name       | nvme1n1
Model      | INTEL SSDPE21D960GA
Serial     | PHM2913000YF960CGN
ZFS GUID   | 8625327235819249102
Pool       | inferno
Size (GiB) | 894.25
-----------+---------------------------
-----------+---------------------------

###################################
#       DD Benchmark Starting     #
###################################
Using 32 threads for the benchmark.


Creating test dataset for pool: inferno
Dataset inferno/tn-bench created successfully.

=== Space Verification ===
Available space: 882.66 GiB
Space required:  640.00 GiB (20 GiB/thread × 32 threads)

 Sufficient space available - proceeding with benchmarks...

###################################
#                                 #
#       DD Benchmark Starting     #
#                                 #
###################################
Using 32 threads for the benchmark.


Creating test dataset for pool: inferno
Dataset inferno/tn-bench created successfully.

Running benchmarks for pool: inferno
Running DD write benchmark with 1 threads...
Run 1 write speed: 330.56 MB/s
Run 2 write speed: 333.91 MB/s
Average write speed: 332.23 MB/s
Running DD read benchmark with 1 threads...
Run 1 read speed: 13507.10 MB/s
Run 2 read speed: 13834.20 MB/s
Average read speed: 13670.65 MB/s
Running DD write benchmark with 8 threads...
Run 1 write speed: 2537.39 MB/s
Run 2 write speed: 2539.67 MB/s
Average write speed: 2538.53 MB/s
Running DD read benchmark with 8 threads...
Run 1 read speed: 74423.04 MB/s
Run 2 read speed: 75516.14 MB/s
Average read speed: 74969.59 MB/s
Running DD write benchmark with 16 threads...
Run 1 write speed: 4524.23 MB/s
Run 2 write speed: 4527.36 MB/s
Average write speed: 4525.80 MB/s
Running DD read benchmark with 16 threads...
Run 1 read speed: 90504.07 MB/s
Run 2 read speed: 90349.46 MB/s
Average read speed: 90426.77 MB/s
Running DD write benchmark with 32 threads...
Run 1 write speed: 6293.79 MB/s
Run 2 write speed: 6193.00 MB/s
Average write speed: 6243.39 MB/s
Running DD read benchmark with 32 threads...
Run 1 read speed: 25320.35 MB/s
Run 2 read speed: 25346.17 MB/s
Average read speed: 25333.26 MB/s

###################################
#         DD Benchmark Results for Pool: inferno    #
###################################
#    Threads: 1    #
#    1M Seq Write Run 1: 330.56 MB/s     #
#    1M Seq Write Run 2: 333.91 MB/s     #
#    1M Seq Write Avg: 332.23 MB/s #
#    1M Seq Read Run 1: 13507.10 MB/s      #
#    1M Seq Read Run 2: 13834.20 MB/s      #
#    1M Seq Read Avg: 13670.65 MB/s  #
###################################
#    Threads: 8    #
#    1M Seq Write Run 1: 2537.39 MB/s     #
#    1M Seq Write Run 2: 2539.67 MB/s     #
#    1M Seq Write Avg: 2538.53 MB/s #
#    1M Seq Read Run 1: 74423.04 MB/s      #
#    1M Seq Read Run 2: 75516.14 MB/s      #
#    1M Seq Read Avg: 74969.59 MB/s  #
###################################
#    Threads: 16    #
#    1M Seq Write Run 1: 4524.23 MB/s     #
#    1M Seq Write Run 2: 4527.36 MB/s     #
#    1M Seq Write Avg: 4525.80 MB/s #
#    1M Seq Read Run 1: 90504.07 MB/s      #
#    1M Seq Read Run 2: 90349.46 MB/s      #
#    1M Seq Read Avg: 90426.77 MB/s  #
###################################
#    Threads: 32    #
#    1M Seq Write Run 1: 6293.79 MB/s     #
#    1M Seq Write Run 2: 6193.00 MB/s     #
#    1M Seq Write Avg: 6243.39 MB/s #
#    1M Seq Read Run 1: 25320.35 MB/s      #
#    1M Seq Read Run 2: 25346.17 MB/s      #
#    1M Seq Read Avg: 25333.26 MB/s  #
###################################
Cleaning up test files...
Running disk read benchmark...
###################################
This benchmark tests the 4K sequential read performance of each disk in the system using dd. It is run 2 times for each disk and averaged.
In order to work around ARC caching in systems with it still enabled, This benchmark reads data in the amount of total system RAM or the total size of the disk, whichever is smaller.
###################################
Testing disk: nvme0n1
Testing disk: nvme0n1
Testing disk: nvme3n1
Testing disk: nvme3n1
Testing disk: nvme2n1
Testing disk: nvme2n1
Testing disk: nvme4n1
Testing disk: nvme4n1
Testing disk: nvme5n1
Testing disk: nvme5n1
Testing disk: nvme1n1
Testing disk: nvme1n1

###################################
#         Disk Read Benchmark Results   #
###################################
#    Disk: nvme0n1    #
#    Run 1: 1532.82 MB/s     #
#    Run 2: 1343.92 MB/s     #
#    Average: 1438.37 MB/s     #
#    Disk: nvme3n1    #
#    Run 1: 1517.45 MB/s     #
#    Run 2: 1341.46 MB/s     #
#    Average: 1429.45 MB/s     #
#    Disk: nvme2n1    #
#    Run 1: 1510.00 MB/s     #
#    Run 2: 1331.97 MB/s     #
#    Average: 1420.99 MB/s     #
#    Disk: nvme4n1    #
#    Run 1: 1429.24 MB/s     #
#    Run 2: 1286.49 MB/s     #
#    Average: 1357.86 MB/s     #
#    Disk: nvme5n1    #
#    Run 1: 1512.97 MB/s     #
#    Run 2: 1324.44 MB/s     #
#    Average: 1418.71 MB/s     #
#    Disk: nvme1n1    #
#    Run 1: 1504.12 MB/s     #
#    Run 2: 1324.81 MB/s     #
#    Average: 1414.47 MB/s     #
###################################

Total benchmark time: 42.86 minutes
I’ll need to start exporting this in JSON because this won’t be maintanable… but for now…
Using some AI Magic to pull out some numbers and make some tables…
Ryzen vs EPYC – DD Benchmark Comparison for ZFS Pool inferno
Single Thread Performance
| Metric | Ryzen | EPYC |
|---|---|---|
| Seq Write Avg | 406 MB/s | 332 MB/s |
| Seq Read Avg | 12.6 GB/s | 13.7 GB/s |
Observation:
- We see here the Ryzen, with newer cores and higher clocks, beats the EPYC in single threaded writes.
- But EPYC having alot more RAM and extra channels wins even in single threaded reads.
Thread Scaling Behavior
Write Performance
| Threads | Ryzen 32G (MB/s) | EPYC 256G (MB/s) | EPYC/Ryzen Ratio |
|---|---|---|---|
| 1 | 406 | 332 | 0.82× |
| 1/4 Threads (3v8) | 1,144 | 2,539 | 2.22× |
| 1/4 Threads vs 1/2 Threads (6v8) | 1,842 | 2,539 | 1.38× |
| 1/2 Threads (6 vs 24) | 1,842 | 4,526 | 2.46× |
| 1/2 Threads vs All Threads (12v16) | 2,233 | 4,526 | 2.03× |
| All Threads v(12/32) | 2,233 | 6,243 | 2.80× |
Observation:
-
We just see domination here across all comparison points…thanks to massive caches on the CPU…a decent amount of RAM…and those extra juicy memory channels…
-
I would love to test this on a “top of the line” DDR5 platform…but that’s unobtanium … at least until they show up in droves on eBay after a 5 year lease.
Key Takeaway: NVME write performance is directly related to memory bandwidth, and therefore it’s unrelated to ARC.
Read Performance
| Threads | Ryzen 32G (MB/s) | 256G EPYC (MB/s) | EPYC/Ryzen Ratio |
|---|---|---|---|
| 1 | 12,636 | 13,670 | 1.08× |
| 3/8 | 8,328 | 74,970 | 9.02× |
| 6/16 | 8,444 | 90,427 | 10.8× |
| 12/32 | 8,489 | 25,333 | 2.97× |
Observation:
-
Here, I was expecing to see the biggest differance…and we do…if for no other reason than the QUANTITY of RAM. We do (this is NOT Direct IO), and its especially obvious when we see the sharp drop off in the “All Threads” test. At that point we’ve finally exhausted the 256G on the EPYC system.
-
The highly cached results in the middle (1/4 to 1/2 load) show just how helpful ARC can be, even in an NVME world.
Key Takeaway: In terms of “What do I upgrade first”: RAM still reigns supreme. For quantity…and bandwidth. The “newer”, albeit smaller, Ryzen 5600G doesn’t stand a chance with only dual channel memory.
Single Disk Single Thread Performance
| System | Avg. Across All Disks (MB/s) |
|---|---|
| Ryzen | 1529.73 |
| EPYC | 1413.31 |
Key Takeaway:
Here we again see that extra single core performance of the Ryzen make it edge out it’s server CPU uncle.
Final Thoughts
There’s alot of recent interest in “mini” NAS’s with 4 NVME drives in them. My results here with a gaming board prove those all NVME pools on top of Celerons and Atoms are bottlenecked by those systems. This is probably obvious to many, but well worth mentioning in terms of using benchmarking to better design your next upgrade.
To be clear, those users usecase’s may be fine with that level of performance. I suspect that this class of device would actually work very well for some folks. In fact, for the workload of just serving my “D” drive in Windows, my previous system was working well.
But those systems are not going to give you BRRRR fast disk access in a memory bandwidth starved world. People have high expectations for NVME drives, but you must not forget that RAID and Parity, let alone the rest of ZFS, have a performance cost. When you’re moving data to NVME drives as fast as system memory…Every bit of bandwidth helps. To really see the performance, you need to scale out your workload.
- More threads more better
- AI Needs GPU Memory…ZFS needs system Memory.
2 Likes
Dude, your a legend, I was looking for something like this, currently putting my rig through its pases now.
First thing your utility pointed out is have 12 x NVME drives in close proximity is going to require some better cooling ![]()
1 Like
Best of luck. Post back some numbers to the thread ![]()
Full details for my Dual Xeon System
Summary
System Information
Field | Value
----------------------±------------------------------------------
Version | 25.04.0
Load Average (1m) | 9.23974609375
Load Average (5m) | 9.9951171875
Load Average (15m) | 8.50048828125
Model | Intel(R) Xeon(R) Silver 4114 CPU @ 2.20GHz
Cores | 40
Physical Cores | 20
System Product | X11DPi-N(T)
Physical Memory (GiB) | 187.57
Pool Information
Field | Value
-----------±---------
Name | Data
Path | /mnt/Data
Status | ONLINE
VDEV Count | 1
Disk Count | 8
VDEV Name | Type | Disk Count
-----------±---------------±--------------
raidz1-0 | RAIDZ1 | 8
Pool Information
Field | Value
-----------±----------------
Name | SSD-Storage
Path | /mnt/SSD-Storage
Status | ONLINE
VDEV Count | 1
Disk Count | 8
VDEV Name | Type | Disk Count
-----------±---------------±--------------
raidz1-0 | RAIDZ1 | 8
Pool Information
Field | Value
-----------±-----------------
Name | Storage-NVME
Path | /mnt/Storage-NVME
Status | ONLINE
VDEV Count | 1
Disk Count | 4
VDEV Name | Type | Disk Count
-----------±---------------±--------------
raidz1-0 | RAIDZ1 | 4
Disk Information
###################################
NOTE: The TrueNAS API will return N/A for the Pool for the boot device(s) as well as any disk is not a member of a pool.
###################################
Field | Value
-----------±--------------------------
Name | nvme0n1
Model | INTEL SSDPEKKW256G8
ZFS GUID | None
Pool | N/A
Size (GiB) | 238.47
-----------±--------------------------
-----------±--------------------------
Name | nvme5n1
Model | SAMSUNG MZVL2512HCJQ-00BH1
ZFS GUID | 4450602655569652834
Pool | Data
Size (GiB) | 476.94
-----------±--------------------------
-----------±--------------------------
Name | nvme6n1
Model | SAMSUNG MZVL2512HCJQ-00BT7
ZFS GUID | 5926458112683331364
Pool | Data
Size (GiB) | 476.94
-----------±--------------------------
-----------±--------------------------
Name | nvme7n1
Model | SAMSUNG MZVL2512HCJQ-00B07
ZFS GUID | 1236302724236495374
Pool | Data
Size (GiB) | 476.94
-----------±--------------------------
-----------±--------------------------
Name | nvme9n1
Model | SAMSUNG MZVL2512HDJD-00BH1
ZFS GUID | 18332781427266276072
Pool | Data
Size (GiB) | 476.94
-----------±--------------------------
-----------±--------------------------
Name | nvme8n1
Model | SAMSUNG MZVL2512HCJQ-00BT7
ZFS GUID | 7391175405471013465
Pool | Data
Size (GiB) | 476.94
-----------±--------------------------
-----------±--------------------------
Name | nvme12n1
Model | SAMSUNG MZVL2512HCJQ-00BT7
ZFS GUID | 11331508540263128079
Pool | Data
Size (GiB) | 476.94
-----------±--------------------------
-----------±--------------------------
Name | nvme11n1
Model | SAMSUNG MZVL2512HDJD-00BH1
ZFS GUID | 8876862790215414010
Pool | Data
Size (GiB) | 476.94
-----------±--------------------------
-----------±--------------------------
Name | nvme10n1
Model | SAMSUNG MZVL2512HCJQ-00B07
ZFS GUID | 5056280700579319940
Pool | Data
Size (GiB) | 476.94
-----------±--------------------------
-----------±--------------------------
Name | sda
Model | Samsung_SSD_870_EVO_2TB
ZFS GUID | 7541989573187090975
Pool | SSD-Storage
Size (GiB) | 1863.02
-----------±--------------------------
-----------±--------------------------
Name | sdc
Model | Samsung_SSD_870_EVO_2TB
ZFS GUID | 204504882882034020
Pool | SSD-Storage
Size (GiB) | 1863.02
-----------±--------------------------
-----------±--------------------------
Name | sdb
Model | Samsung_SSD_870_EVO_2TB
ZFS GUID | 10993583493033583546
Pool | SSD-Storage
Size (GiB) | 1863.02
-----------±--------------------------
-----------±--------------------------
Name | sdd
Model | Samsung_SSD_870_EVO_2TB
ZFS GUID | 13147075643423818695
Pool | SSD-Storage
Size (GiB) | 1863.02
-----------±--------------------------
-----------±--------------------------
Name | sde
Model | Samsung_SSD_870_EVO_2TB
ZFS GUID | 4228130612758990657
Pool | SSD-Storage
Size (GiB) | 1863.02
-----------±--------------------------
-----------±--------------------------
Name | sdf
Model | Samsung_SSD_870_EVO_2TB
ZFS GUID | 5620208059301319368
Pool | SSD-Storage
Size (GiB) | 1863.02
-----------±--------------------------
-----------±--------------------------
Name | sdg
Model | Samsung_SSD_870_EVO_2TB
ZFS GUID | 1201412504994669976
Pool | SSD-Storage
Size (GiB) | 1863.02
-----------±--------------------------
-----------±--------------------------
Name | sdh
Model | Samsung_SSD_870_EVO_2TB
ZFS GUID | 899407647334607325
Pool | SSD-Storage
Size (GiB) | 1863.02
-----------±--------------------------
-----------±--------------------------
Name | nvme1n1
Model | SAMSUNG MZVL2512HCJQ-00BT7
ZFS GUID | 8456712694383025504
Pool | Storage-NVME
Size (GiB) | 476.94
-----------±--------------------------
-----------±--------------------------
Name | nvme2n1
Model | SAMSUNG MZVL2512HCJQ-00BT7
ZFS GUID | 7263527787463564665
Pool | Storage-NVME
Size (GiB) | 476.94
-----------±--------------------------
-----------±--------------------------
Name | nvme3n1
Model | SAMSUNG MZVL2512HCJQ-00B07
ZFS GUID | 15040064991693833772
Pool | Storage-NVME
Size (GiB) | 476.94
-----------±--------------------------
-----------±--------------------------
Name | nvme4n1
Model | SAMSUNG MZVL2512HDJD-00BH1
ZFS GUID | 16567423698335499734
Pool | Storage-NVME
Size (GiB) | 476.94
-----------±--------------------------
-----------±--------------------------
###################################
DD Benchmark Starting
###################################
Using 40 threads for the benchmark.
Creating test dataset for pool: Data
Created temporary dataset: Data/tn-bench
Dataset Data/tn-bench created successfully.
=== Space Verification ===
Available space: 1896.26 GiB
Space required: 800.00 GiB (20 GiB/thread × 40 threads)
Sufficient space available - proceeding with benchmarks…
###################################
DD Benchmark Starting
###################################
Using 40 threads for the benchmark.
Creating test dataset for pool: Data
Dataset Data/tn-bench created successfully.
Running benchmarks for pool: Data
Running DD write benchmark with 1 threads…
Run 1 write speed: 248.17 MB/s
Run 2 write speed: 243.65 MB/s
Average write speed: 245.91 MB/s
Running DD read benchmark with 1 threads…
Run 1 read speed: 6087.22 MB/s
Run 2 read speed: 5969.46 MB/s
Average read speed: 6028.34 MB/s
Running DD write benchmark with 10 threads…
Run 1 write speed: 1485.75 MB/s
Run 2 write speed: 1397.98 MB/s
Average write speed: 1441.86 MB/s
Running DD read benchmark with 10 threads…
Run 1 read speed: 27611.89 MB/s
Run 2 read speed: 32046.10 MB/s
Average read speed: 29829.00 MB/s
Running DD write benchmark with 20 threads…
Run 1 write speed: 1455.67 MB/s
Run 2 write speed: 1321.43 MB/s
Average write speed: 1388.55 MB/s
Running DD read benchmark with 20 threads…
Run 1 read speed: 18715.99 MB/s
Run 2 read speed: 19605.00 MB/s
Average read speed: 19160.49 MB/s
Running DD write benchmark with 40 threads…
Run 1 write speed: 1103.17 MB/s
2025 May 28 08:17:57 truenas Device: /dev/nvme10n1, Critical Warning (0x02): Temperature
Run 2 write speed: 548.76 MB/s
Average write speed: 825.96 MB/s
Running DD read benchmark with 40 threads…
Run 1 read speed: 18587.91 MB/s
Run 2 read speed: 19330.19 MB/s
Average read speed: 18959.05 MB/s
###################################
DD Benchmark Results for Pool: Data
###################################
Threads: 1
1M Seq Write Run 1: 248.17 MB/s
1M Seq Write Run 2: 243.65 MB/s
1M Seq Write Avg: 245.91 MB/s
1M Seq Read Run 1: 6087.22 MB/s
1M Seq Read Run 2: 5969.46 MB/s
1M Seq Read Avg: 6028.34 MB/s
###################################
Threads: 10
1M Seq Write Run 1: 1485.75 MB/s
1M Seq Write Run 2: 1397.98 MB/s
1M Seq Write Avg: 1441.86 MB/s
1M Seq Read Run 1: 27611.89 MB/s
1M Seq Read Run 2: 32046.10 MB/s
1M Seq Read Avg: 29829.00 MB/s
###################################
Threads: 20
1M Seq Write Run 1: 1455.67 MB/s
1M Seq Write Run 2: 1321.43 MB/s
1M Seq Write Avg: 1388.55 MB/s
1M Seq Read Run 1: 18715.99 MB/s
1M Seq Read Run 2: 19605.00 MB/s
1M Seq Read Avg: 19160.49 MB/s
###################################
Threads: 40
1M Seq Write Run 1: 1103.17 MB/s
1M Seq Write Run 2: 548.76 MB/s
1M Seq Write Avg: 825.96 MB/s
1M Seq Read Run 1: 18587.91 MB/s
1M Seq Read Run 2: 19330.19 MB/s
1M Seq Read Avg: 18959.05 MB/s
###################################
Cleaning up test files…
Creating test dataset for pool: SSD-Storage
Created temporary dataset: SSD-Storage/tn-bench
Dataset SSD-Storage/tn-bench created successfully.
Running benchmarks for pool: SSD-Storage
Running DD write benchmark with 1 threads…
Run 1 write speed: 246.64 MB/s
Run 2 write speed: 243.86 MB/s
Average write speed: 245.25 MB/s
Running DD read benchmark with 1 threads…
Run 1 read speed: 5941.99 MB/s
Run 2 read speed: 5769.93 MB/s
Average read speed: 5855.96 MB/s
Running DD write benchmark with 10 threads…
Run 1 write speed: 2114.04 MB/s
Run 2 write speed: 2068.56 MB/s
Average write speed: 2091.30 MB/s
Running DD read benchmark with 10 threads…
Run 1 read speed: 26746.25 MB/s
Run 2 read speed: 26236.46 MB/s
Average read speed: 26491.35 MB/s
Running DD write benchmark with 20 threads…
Run 1 write speed: 2982.67 MB/s
Run 2 write speed: 2795.37 MB/s
Average write speed: 2889.02 MB/s
Running DD read benchmark with 20 threads…
Run 1 read speed: 7918.66 MB/s
Run 2 read speed: 8127.37 MB/s
Average read speed: 8023.02 MB/s
Running DD write benchmark with 40 threads…
Run 1 write speed: 2752.24 MB/s
Run 2 write speed: 2639.23 MB/s
Average write speed: 2695.74 MB/s
Running DD read benchmark with 40 threads…
Run 1 read speed: 8038.02 MB/s
Run 2 read speed: 8158.04 MB/s
Average read speed: 8098.03 MB/s
###################################
DD Benchmark Results for Pool: SSD-Storage
###################################
Threads: 1
1M Seq Write Run 1: 246.64 MB/s
1M Seq Write Run 2: 243.86 MB/s
1M Seq Write Avg: 245.25 MB/s
1M Seq Read Run 1: 5941.99 MB/s
1M Seq Read Run 2: 5769.93 MB/s
1M Seq Read Avg: 5855.96 MB/s
###################################
Threads: 10
1M Seq Write Run 1: 2114.04 MB/s
1M Seq Write Run 2: 2068.56 MB/s
1M Seq Write Avg: 2091.30 MB/s
1M Seq Read Run 1: 26746.25 MB/s
1M Seq Read Run 2: 26236.46 MB/s
1M Seq Read Avg: 26491.35 MB/s
###################################
Threads: 20
1M Seq Write Run 1: 2982.67 MB/s
1M Seq Write Run 2: 2795.37 MB/s
1M Seq Write Avg: 2889.02 MB/s
1M Seq Read Run 1: 7918.66 MB/s
1M Seq Read Run 2: 8127.37 MB/s
1M Seq Read Avg: 8023.02 MB/s
###################################
Threads: 40
1M Seq Write Run 1: 2752.24 MB/s
1M Seq Write Run 2: 2639.23 MB/s
1M Seq Write Avg: 2695.74 MB/s
1M Seq Read Run 1: 8038.02 MB/s
1M Seq Read Run 2: 8158.04 MB/s
1M Seq Read Avg: 8098.03 MB/s
###################################
Cleaning up test files…
Creating test dataset for pool: Storage-NVME
Created temporary dataset: Storage-NVME/tn-bench
Dataset Storage-NVME/tn-bench created successfully.
Running benchmarks for pool: Storage-NVME
Running DD write benchmark with 1 threads…
Run 1 write speed: 248.44 MB/s
Run 2 write speed: 243.51 MB/s
Average write speed: 245.97 MB/s
Running DD read benchmark with 1 threads…
Run 1 read speed: 6119.93 MB/s
Run 2 read speed: 5526.62 MB/s
Average read speed: 5823.28 MB/s
Running DD write benchmark with 10 threads…
Run 1 write speed: 934.63 MB/s
Run 2 write speed: 938.99 MB/s
Average write speed: 936.81 MB/s
Running DD read benchmark with 10 threads…
Run 1 read speed: 23682.68 MB/s
Run 2 read speed: 30877.34 MB/s
Average read speed: 27280.01 MB/s
Running DD write benchmark with 20 threads…
Run 1 write speed: 938.81 MB/s
Run 2 write speed: 895.61 MB/s
Average write speed: 917.21 MB/s
Running DD read benchmark with 20 threads…
Run 1 read speed: 17110.12 MB/s
Run 2 read speed: 19653.73 MB/s
Average read speed: 18381.92 MB/s
Running DD write benchmark with 40 threads…
Run 1 write speed: 906.56 MB/s
Run 2 write speed: 909.54 MB/s
Average write speed: 908.05 MB/s
Running DD read benchmark with 40 threads…
Run 1 read speed: 19297.60 MB/s
Run 2 read speed: 19962.92 MB/s
Average read speed: 19630.26 MB/s
###################################
DD Benchmark Results for Pool: Storage-NVME
###################################
Threads: 1
1M Seq Write Run 1: 248.44 MB/s
1M Seq Write Run 2: 243.51 MB/s
1M Seq Write Avg: 245.97 MB/s
1M Seq Read Run 1: 6119.93 MB/s
1M Seq Read Run 2: 5526.62 MB/s
1M Seq Read Avg: 5823.28 MB/s
###################################
Threads: 10
1M Seq Write Run 1: 934.63 MB/s
1M Seq Write Run 2: 938.99 MB/s
1M Seq Write Avg: 936.81 MB/s
1M Seq Read Run 1: 23682.68 MB/s
1M Seq Read Run 2: 30877.34 MB/s
1M Seq Read Avg: 27280.01 MB/s
###################################
Threads: 20
1M Seq Write Run 1: 938.81 MB/s
1M Seq Write Run 2: 895.61 MB/s
1M Seq Write Avg: 917.21 MB/s
1M Seq Read Run 1: 17110.12 MB/s
1M Seq Read Run 2: 19653.73 MB/s
1M Seq Read Avg: 18381.92 MB/s
###################################
Threads: 40
1M Seq Write Run 1: 906.56 MB/s
1M Seq Write Run 2: 909.54 MB/s
1M Seq Write Avg: 908.05 MB/s
1M Seq Read Run 1: 19297.60 MB/s
1M Seq Read Run 2: 19962.92 MB/s
1M Seq Read Avg: 19630.26 MB/s
###################################
Cleaning up test files…
Running disk read benchmark…
###################################
This benchmark tests the 4K sequential read performance of each disk in the system using dd. It is run 2 times for each disk and averaged.
In order to work around ARC caching in systems with it still enabled, This benchmark reads data in the amount of total system RAM or the total size of the disk, whichever is smaller.
###################################
Testing disk: nvme0n1
Testing disk: nvme0n1
Testing disk: nvme5n1
Testing disk: nvme5n1
Testing disk: nvme6n1
Testing disk: nvme6n1
Testing disk: nvme7n1
Testing disk: nvme7n1
Testing disk: nvme9n1
Testing disk: nvme9n1
Testing disk: nvme8n1
Testing disk: nvme8n1
Testing disk: nvme12n1
Testing disk: nvme12n1
Testing disk: nvme11n1
Testing disk: nvme11n1
Testing disk: nvme10n1
Testing disk: nvme10n1
Testing disk: sda
Testing disk: sda
Testing disk: sdc
Testing disk: sdc
Testing disk: sdb
Testing disk: sdb
Testing disk: sdd
Testing disk: sdd
Testing disk: sde
Testing disk: sde
Testing disk: sdf
Testing disk: sdf
Testing disk: sdg
Testing disk: sdg
Testing disk: sdh
Testing disk: sdh
Testing disk: nvme1n1
Testing disk: nvme1n1
Testing disk: nvme2n1
Testing disk: nvme2n1
Testing disk: nvme3n1
Testing disk: nvme3n1
Testing disk: nvme4n1
Testing disk: nvme4n1
###################################
Disk Read Benchmark Results
###################################
Disk: nvme0n1
Run 1: 905.99 MB/s
Run 2: 948.49 MB/s
Average: 927.24 MB/s
Disk: nvme5n1
Run 1: 961.53 MB/s
Run 2: 959.69 MB/s
Average: 960.61 MB/s
Disk: nvme6n1
Run 1: 963.41 MB/s
Run 2: 996.30 MB/s
Average: 979.86 MB/s
Disk: nvme7n1
Run 1: 1022.24 MB/s
Run 2: 923.78 MB/s
Average: 973.01 MB/s
Disk: nvme9n1
Run 1: 1014.77 MB/s
Run 2: 986.16 MB/s
Average: 1000.46 MB/s
Disk: nvme8n1
Run 1: 1826.95 MB/s
Run 2: 1716.70 MB/s
Average: 1771.82 MB/s
Disk: nvme12n1
Run 1: 950.86 MB/s
Run 2: 966.97 MB/s
Average: 958.92 MB/s
Disk: nvme11n1
Run 1: 1009.31 MB/s
Run 2: 909.00 MB/s
Average: 959.16 MB/s
Disk: nvme10n1
Run 1: 952.76 MB/s
Run 2: 994.78 MB/s
Average: 973.77 MB/s
Disk: sda
Run 1: 531.23 MB/s
Run 2: 541.79 MB/s
Average: 536.51 MB/s
Disk: sdc
Run 1: 522.62 MB/s
Run 2: 562.75 MB/s
Average: 542.69 MB/s
Disk: sdb
Run 1: 542.93 MB/s
Run 2: 546.57 MB/s
Average: 544.75 MB/s
Disk: sdd
Run 1: 539.36 MB/s
Run 2: 541.81 MB/s
Average: 540.58 MB/s
Disk: sde
Run 1: 533.52 MB/s
Run 2: 538.63 MB/s
Average: 536.08 MB/s
Disk: sdf
Run 1: 542.87 MB/s
Run 2: 577.17 MB/s
Average: 560.02 MB/s
Disk: sdg
Run 1: 543.51 MB/s
Run 2: 552.87 MB/s
Average: 548.19 MB/s
Disk: sdh
Run 1: 542.71 MB/s
Run 2: 582.30 MB/s
Average: 562.50 MB/s
Disk: nvme1n1
Run 1: 984.04 MB/s
Run 2: 958.10 MB/s
Average: 971.07 MB/s
Disk: nvme2n1
Run 1: 999.97 MB/s
Run 2: 918.18 MB/s
Average: 959.07 MB/s
Disk: nvme3n1
Run 1: 942.57 MB/s
Run 2: 950.81 MB/s
Average: 946.69 MB/s
Disk: nvme4n1
Run 1: 998.07 MB/s
Run 2: 955.93 MB/s
Average: 977.00 MB/s
###################################
@NexGen3D Interesting results, I love that we just grabbed data for 3 differant disk types in there (HDD, SATA SSD, NVME)
So as I understand it you are working on the NVME angle now in a recent upgrade? Here’s some of my musings based on that understanding with some ideas for ugprades if thats what you are after.
Here’s the relevant data for max threads SATA vs NVME. Insert AI Magic Table
| Metric | NVMe (MB/s) | SATA SSD (MB/s) | NVMe / SATA Ratio |
|---|---|---|---|
| Threads | 40 | 40 | 1.00 |
| 1M Seq Write Run 1 | 906.56 | 2752.24 | 0.33 |
| 1M Seq Write Run 2 | 909.54 | 2639.23 | 0.34 |
| 1M Seq Write Avg | 908.05 | 2695.74 | 0.34 |
| 1M Seq Read Run 1 | 19297.60 | 8038.02 | 2.40 |
| 1M Seq Read Run 2 | 19962.92 | 8158.04 | 2.45 |
| 1M Seq Read Avg | 19630.26 | 8098.03 | 2.42 |
Otherwise, the reults show us prelly consistent behavior, which I am happy to see because the script is working well.
We see read performance more than 2x the SATA SSDs which is great to see, but you’re definitely hitting a memory bandwidth bottlneck there. The write performance proves it.
Whats more interesting is comparing this to my results.
| Metric                 | SATA SSD (MB/s) | NVMe (MB/s) | EPYC NVMe (MB/s) | EPYC / SATA Ratio | EPYC / NVMe Ratio |
|------------------------|------------------|--------------|-------------------|--------------------|--------------------|
| Threads                | 40               | 40           | 32                | 0.80               | 0.80               |
| 1M Seq Write Run 1     | 2752.24          | 906.56       | 6293.79           | 2.29               | 6.94               |
| 1M Seq Write Run 2     | 2639.23          | 909.54       | 6193.00           | 2.35               | 6.81               |
| 1M Seq Write Avg       | 2695.74          | 908.05       | 6243.39           | 2.31               | 6.88               |
| 1M Seq Read Run 1      | 8038.02          | 19297.60     | 25320.35          | 3.15               | 1.31               |
| 1M Seq Read Run 2      | 8158.04          | 19962.92     | 25346.17          | 3.11               | 1.27               |
| 1M Seq Read Avg        | 8098.03          | 19630.26     | 25333.26          | 3.13               | 1.29               |
These are my results with half as many NVME drives in the system, and I am getting better read and write performance. So in my case, the EPYC platform seems to be better optimized in terms of latencies and I/O differances than the slightly older Xeon 4114…and in a measurable way. But I think that speaks to your upgrade path.
The impact of your system having dual CPUs and the latency inherent with that design are a factor here.
192GB of memory means you have additional memory slots available, and so there’s performance improvement possible there depending on the configuration. Also, are they 2400MHz (Mine are 3200MHz)?
Single core is a factor here, where the 4114s are only 2.2GHz base clock.
https://www.cpubenchmark.net/compare/3753vs3095.2/AMD-EPYC-7F52-vs-[Dual-CPU]-Intel-Xeon-Silver-4114
Single Thread Rating, just as an example to my EPYC
2507 vs 1682
(-32.9%)
The fact that I am using Intel Optane instead of Consumer NAND NVME can probably account for a big part of the write performance I have over your system… But I am not sure and I think the platform based bottlenecks are more important to tackle anyway.
My suggestions
The Xeon 6136 may be a good bang for your buck upgrade. I see them sub $75 for a pair on Ebay.
https://www.intel.com/content/www/us/en/products/sku/120479/intel-xeon-gold-6136-processor-24-75m-cache-3-00-ghz/specifications.html
Populating both sockets vs only 1 socket, and differant RAM configurations might be interesting. Trading bandwidth for latency, differant configurations may yeild better or worse results. And if you end up using 1 CPU, you’ll still get about the same multithreaded perfomance as you are now probably using less power.
https://www.cpubenchmark.net/compare/3753vs3095.2vs3065/AMD-EPYC-7F52-vs-Intel-Xeon-Silver-4114-vs-Intel-Xeon-Gold-6136
6146 maybe viable too.
But otherwise RAM configuration variants might help. Populating some slots and not others may yeild better load balancing across available channels.Or just buy more RAM xD.
Yes, Epyc has much better IO throughput, but I built this system with value for money in mind, I wanted Epyc, but I got 2 CPU’s, 12 Sticks of ram and the Supermicro board for half the price of just the Epic Supermicro board on its own.
CPU’s I paid $19 each for them, ram I got for $10 a stick, and the Samsung OEM Pro NVME drives cost me $25 each (All values in AUD)
I am looking at a couple of Gold 6238 or 6242V’s as an upgrade, but to be honest, every client in my house is gigabit, and only a couple of workstations are 2.5g, the server has dual 10g but until I upgrade some of my end points, I really cant saturate the R/W of the network storage anyway.
I also think the Ram I got is only 2133mhz ECC, it is running in 6 channel mode per CPU, but the board can support 2900mhz modules, so this could be another upgrade path.
One thing to note, these 4114 silver CPUs together are cooler and pull less power versus the I9 9900K they replaced, that thing really cranked out the heat.
The Sata SSD’s are all consumer Samsung EVO’s I think they were 960 or 970, cant remember exactly, I love these drives, I have ones kicking around that must be 10years old now, even some 840’s, these are incredibly reliable, I have hundreds of Samsung HDD’s, SSD’s, NVME’s and not a single failure, even the old 80GB HDD’s still work ![]()
The SATA SSD Pool is on a LSI controller card, and its what I use for main NAS storage, the smaller NVME Pool is used purely for Frigate storage and has close to terabyte written to it constantly, so these get thrashed, not concerned to much about failure and its only security video footage and the drives are recycled from a PC recycler, plenty more cheap ones to swap them out with, the larger NVME array is for all of the Truenas App goodness.
Overall pretty happy with the performance compared to my older X390/I9 9900K system, it may have been quicker on a single thread, but I feel this Xeon system is quicker overall, and I was always hitting a wall on PCI lanes with X390, this was really giving me the sh*** and still today, all the consumer grade parts have this same limitation, I feel that an R9 9950X would been awesome, the PCI lane limitation was a deal breaker, so I went with old used commercial gear, and I’m glad I did, this is my first Supermicro board, and I love it, reminds me of my old Dual Athlon Asus board I had decades ago, but better in every way.
1 Like
This conversation is why I started this project and this thread ![]()
So thank you for sharing! I love reading about other people’s systems engineering and min maxing xD
Also, yes, consumer gear PCIE needs more lanes. At this point theres just so much demand for it.
Also if it means anything, I bought an older off contract TrueNAS M50 and it’s got some of the same stuff hardware wise (at least as a single node configuration). So you picked good stuff ![]()
One last edit:
Just a personally preference, I’m glad to see you are of similar mindset.
Older generation servers (which have historically dominated by Intel, because late generation Opterons were…special) have always been my go to homelab solution.
They are often dismissed as being hot and loud, both of which can be true, but anything after Westmere is perfectly viable given the right amount of space is available. You’re trading miles on the odometer for cost savings, but usually the ROI of using either used servers or used server parts vs building it yourself new, works out.
1 Like
Big update. Benchmarking Logic remains unchained from v1.07, but massive changes to the “UI”, JSON exporting and more user choice.
Todo is adding additional information to the JSON and formalizing it’s data structure.
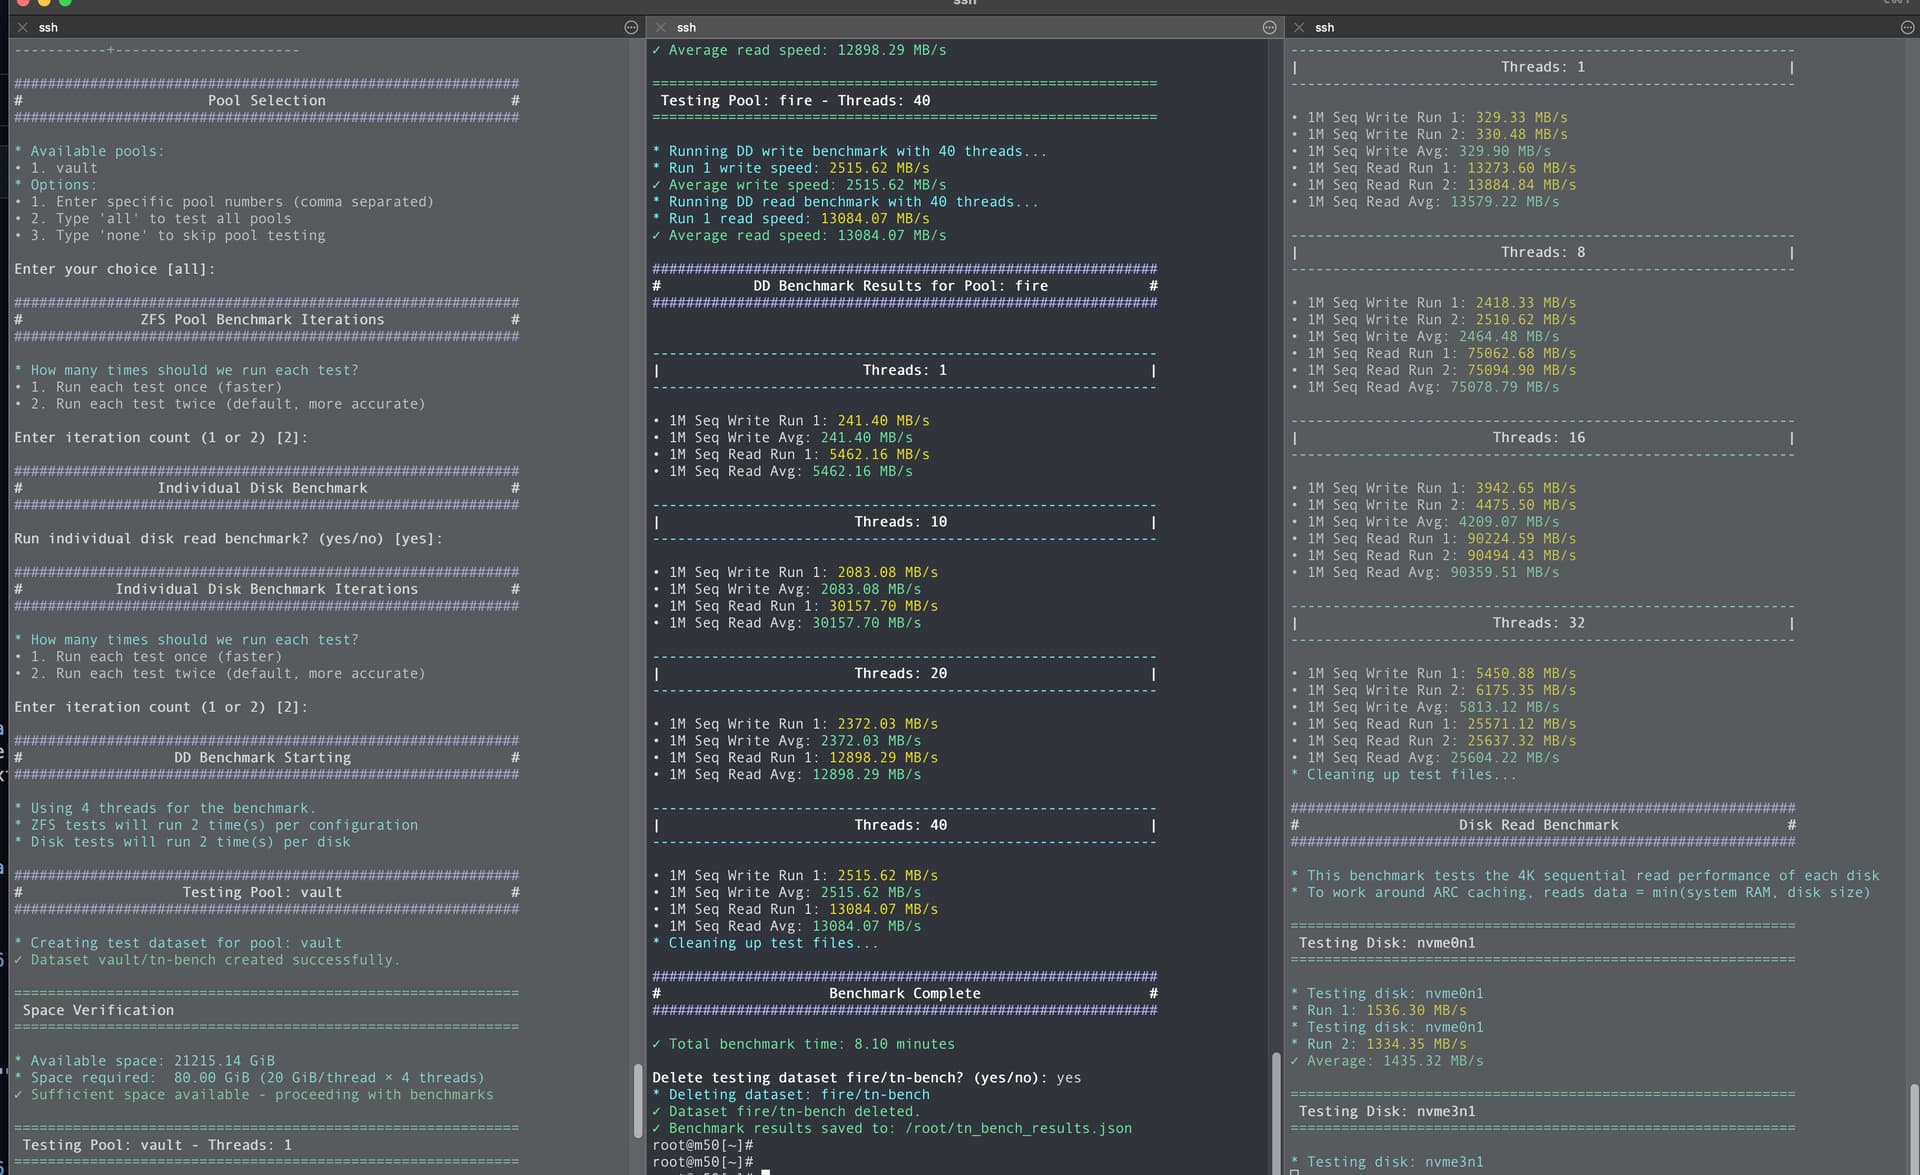
Will work on cleaning up this thread and the docs this weekend.
2 Likes
Here’s the results from two different systems I have. Hardware is exactly the same other than drive models. Oh on System 1 I kept the boot drives bot visible but on System 2 I used hardware raid via the BOSS card.
Both systems are AMD EPYC 7662 64C, with 512GB of DDR4 3200 MT/s (8x 64GB RDIMMs).
System 1 w/ INTEL SSDPF2KE016T9K NVMe
############################################################
#                      TN-Bench v1.10                      #
############################################################

TN-Bench is an OpenSource Software Script that uses standard tools to
Benchmark your System and collect various statistical information via
the TrueNAS API.

* TN-Bench will create a Dataset in each of your pools for testing purposes
* that will consume 20 GiB of space for every thread in your system.

! WARNING: This test will make your system EXTREMELY slow during its run.
! WARNING: It is recommended to run this test when no other workloads are running.

* ZFS ARC will impact your results. You can set zfs_arc_max to 1 to prevent ARC caching.
* Setting it back to 0 restores default behavior but requires a system restart.

============================================================
 Confirmation
============================================================

Would you like to continue? (yes/no): yes

------------------------------------------------------------
|                    System Information                    |
------------------------------------------------------------

Field                 | Value
----------------------+--------------------------------
Version               | 25.04.1
Load Average (1m)     | 0.01513671875
Load Average (5m)     | 0.2080078125
Load Average (15m)    | 0.158203125
Model                 | AMD EPYC 7662 64-Core Processor
Cores                 | 128
Physical Cores        | 64
System Product        | None
Physical Memory (GiB) | 503.28

------------------------------------------------------------
|                     Pool Information                     |
------------------------------------------------------------

Field      | Value
-----------+---------------
Name       | tank_nvme
Path       | /mnt/tank_nvme
Status     | ONLINE
VDEV Count | 2
Disk Count | 24

VDEV Name  | Type           | Disk Count
-----------+----------------+---------------
raidz1-0    | RAIDZ1         | 12
raidz1-1    | RAIDZ1         | 12

------------------------------------------------------------
|                     Disk Information                     |
------------------------------------------------------------

* The TrueNAS API returns N/A for the Pool for boot devices and disks not in a pool.
Field      | Value
-----------+---------------------
Name       | sdb
Model      | SSDSCKJB240G7R
Serial     | PHDW823105J7240E
ZFS GUID   | None
Pool       | N/A
Size (GiB) | 223.57
-----------+---------------------
Name       | sda
Model      | SSDSCKJB240G7R
Serial     | PHDW823105LJ240E
ZFS GUID   | None
Pool       | N/A
Size (GiB) | 223.57
-----------+---------------------
Name       | nvme0n1
Model      | INTEL SSDPF2KE016T9K
Serial     | PHAB1244012B1P9SGN
ZFS GUID   | 5861933030916740461
Pool       | tank_nvme
Size (GiB) | 1490.42
-----------+---------------------
Name       | nvme1n1
Model      | INTEL SSDPF2KE016T9K
Serial     | PHAB1244009W1P9SGN
ZFS GUID   | 11590537415743360153
Pool       | tank_nvme
Size (GiB) | 1490.42
-----------+---------------------
Name       | nvme2n1
Model      | INTEL SSDPF2KE016T9K
Serial     | PHAB1341018F1P9SGN
ZFS GUID   | 16589308648349444374
Pool       | tank_nvme
Size (GiB) | 1490.42
-----------+---------------------
Name       | nvme3n1
Model      | INTEL SSDPF2KE016T9K
Serial     | PHAB1270007W1P9SGN
ZFS GUID   | 1203374810049258842
Pool       | tank_nvme
Size (GiB) | 1490.42
-----------+---------------------
Name       | nvme4n1
Model      | INTEL SSDPF2KE016T9K
Serial     | PHAB129400ZH1P9SGN
ZFS GUID   | 6202337664095834747
Pool       | tank_nvme
Size (GiB) | 1490.42
-----------+---------------------
Name       | nvme5n1
Model      | INTEL SSDPF2KE016T9K
Serial     | PHAB129400561P9SGN
ZFS GUID   | 8537550077970074795
Pool       | tank_nvme
Size (GiB) | 1490.42
-----------+---------------------
Name       | nvme6n1
Model      | INTEL SSDPF2KE016T9K
Serial     | PHAB134100SV1P9SGN
ZFS GUID   | 16855618207879738730
Pool       | tank_nvme
Size (GiB) | 1490.42
-----------+---------------------
Name       | nvme7n1
Model      | INTEL SSDPF2KE016T9K
Serial     | PHAB1294005F1P9SGN
ZFS GUID   | 5961537271461066920
Pool       | tank_nvme
Size (GiB) | 1490.42
-----------+---------------------
Name       | nvme8n1
Model      | INTEL SSDPF2KE016T9K
Serial     | PHAB140000EX1P9SGN
ZFS GUID   | 16776619305566215868
Pool       | tank_nvme
Size (GiB) | 1490.42
-----------+---------------------
Name       | nvme9n1
Model      | INTEL SSDPF2KE016T9K
Serial     | PHAB124400A41P9SGN
ZFS GUID   | 2117554846416268517
Pool       | tank_nvme
Size (GiB) | 1490.42
-----------+---------------------
Name       | nvme10n1
Model      | INTEL SSDPF2KE016T9K
Serial     | PHAB134101891P9SGN
ZFS GUID   | 14717862588352451520
Pool       | tank_nvme
Size (GiB) | 1490.42
-----------+---------------------
Name       | nvme11n1
Model      | INTEL SSDPF2KE016T9K
Serial     | PHAB134101731P9SGN
ZFS GUID   | 13578649502042143974
Pool       | tank_nvme
Size (GiB) | 1490.42
-----------+---------------------
Name       | nvme12n1
Model      | INTEL SSDPF2KE016T9K
Serial     | PHAB134100RR1P9SGN
ZFS GUID   | 10420817034723409765
Pool       | tank_nvme
Size (GiB) | 1490.42
-----------+---------------------
Name       | nvme13n1
Model      | INTEL SSDPF2KE016T9K
Serial     | PHAB140000491P9SGN
ZFS GUID   | 2151485479892496135
Pool       | tank_nvme
Size (GiB) | 1490.42
-----------+---------------------
Name       | nvme14n1
Model      | INTEL SSDPF2KE016T9K
Serial     | PHAB1341017C1P9SGN
ZFS GUID   | 15132218399176357506
Pool       | tank_nvme
Size (GiB) | 1490.42
-----------+---------------------
Name       | nvme15n1
Model      | INTEL SSDPF2KE016T9K
Serial     | PHAB132600F11P9SGN
ZFS GUID   | 11158565604378637061
Pool       | tank_nvme
Size (GiB) | 1490.42
-----------+---------------------
Name       | nvme16n1
Model      | INTEL SSDPF2KE016T9K
Serial     | PHAB1244023L1P9SGN
ZFS GUID   | 7790513914833270269
Pool       | tank_nvme
Size (GiB) | 1490.42
-----------+---------------------
Name       | nvme17n1
Model      | INTEL SSDPF2KE016T9K
Serial     | PHAB151300BD1P9SGN
ZFS GUID   | 18104733870093673432
Pool       | tank_nvme
Size (GiB) | 1490.42
-----------+---------------------
Name       | nvme18n1
Model      | INTEL SSDPF2KE016T9K
Serial     | PHAB1244023F1P9SGN
ZFS GUID   | 7138352225471643863
Pool       | tank_nvme
Size (GiB) | 1490.42
-----------+---------------------
Name       | nvme19n1
Model      | INTEL SSDPF2KE016T9K
Serial     | PHAB124401WG1P9SGN
ZFS GUID   | 15245103947732914580
Pool       | tank_nvme
Size (GiB) | 1490.42
-----------+---------------------
Name       | nvme20n1
Model      | INTEL SSDPF2KE016T9K
Serial     | PHAB129400ZT1P9SGN
ZFS GUID   | 12579898537739679931
Pool       | tank_nvme
Size (GiB) | 1490.42
-----------+---------------------
Name       | nvme21n1
Model      | INTEL SSDPF2KE016T9K
Serial     | PHAB124402391P9SGN
ZFS GUID   | 2469907030742829503
Pool       | tank_nvme
Size (GiB) | 1490.42
-----------+---------------------
Name       | nvme22n1
Model      | INTEL SSDPF2KE016T9K
Serial     | PHAB124401181P9SGN
ZFS GUID   | 10326555314693874604
Pool       | tank_nvme
Size (GiB) | 1490.42
-----------+---------------------
Name       | nvme23n1
Model      | INTEL SSDPF2KE016T9K
Serial     | PHAB151300461P9SGN
ZFS GUID   | 13236563029701222546
Pool       | tank_nvme
Size (GiB) | 1490.42
-----------+---------------------
Name       | nvme24n1
Model      | INTEL SSDPEK1A118GA
Serial     | PHOC331401WQ118B
ZFS GUID   | 12671526320321356286
Pool       | N/A
Size (GiB) | 110.28
-----------+---------------------

############################################################
#                      Pool Selection                      #
############################################################

* Available pools:
• 1. tank_nvme
* Options:
• 1. Enter specific pool numbers (comma separated)
• 2. Type 'all' to test all pools
• 3. Type 'none' to skip pool testing

Enter your choice [all]: 1

############################################################
#              ZFS Pool Benchmark Iterations               #
############################################################

* How many times should we run each test?
• 1. Run each test once (faster)
• 2. Run each test twice (default, more accurate)

Enter iteration count (1 or 2) [2]:

############################################################
#                Individual Disk Benchmark                 #
############################################################

Run individual disk read benchmark? (yes/no) [yes]:

############################################################
#           Individual Disk Benchmark Iterations           #
############################################################

* How many times should we run each test?
• 1. Run each test once (faster)
• 2. Run each test twice (default, more accurate)

Enter iteration count (1 or 2) [2]:

############################################################
#                  DD Benchmark Starting                   #
############################################################

* Using 128 threads for the benchmark.
* ZFS tests will run 2 time(s) per configuration
* Disk tests will run 2 time(s) per disk

############################################################
#                 Testing Pool: tank_nvme                  #
############################################################

* Creating test dataset for pool: tank_nvme
✓ Dataset tank_nvme/tn-bench created successfully.

============================================================
 Space Verification
============================================================

* Available space: 30364.84 GiB
* Space required:  2560.00 GiB (20 GiB/thread × 128 threads)
✓ Sufficient space available - proceeding with benchmarks

============================================================
 Testing Pool: tank_nvme - Threads: 1
============================================================

* Running DD write benchmark with 1 threads...
* Run 1 write speed: 290.09 MB/s
* Run 2 write speed: 290.04 MB/s
✓ Average write speed: 290.06 MB/s
* Running DD read benchmark with 1 threads...
* Run 1 read speed: 12554.16 MB/s
* Run 2 read speed: 12627.29 MB/s
✓ Average read speed: 12590.72 MB/s

============================================================
 Testing Pool: tank_nvme - Threads: 32
============================================================

* Running DD write benchmark with 32 threads...
* Run 1 write speed: 6010.61 MB/s
* Run 2 write speed: 5941.69 MB/s
✓ Average write speed: 5976.15 MB/s
* Running DD read benchmark with 32 threads...
* Run 1 read speed: 87993.54 MB/s
* Run 2 read speed: 88517.51 MB/s
✓ Average read speed: 88255.53 MB/s

============================================================
 Testing Pool: tank_nvme - Threads: 64
============================================================

* Running DD write benchmark with 64 threads...
* Run 1 write speed: 5959.05 MB/s
* Run 2 write speed: 5939.39 MB/s
✓ Average write speed: 5949.22 MB/s
* Running DD read benchmark with 64 threads...
* Run 1 read speed: 13579.12 MB/s
* Run 2 read speed: 13581.22 MB/s
✓ Average read speed: 13580.17 MB/s

============================================================
 Testing Pool: tank_nvme - Threads: 128
============================================================

* Running DD write benchmark with 128 threads...
* Run 1 write speed: 5944.06 MB/s
* Run 2 write speed: 5925.43 MB/s
✓ Average write speed: 5934.74 MB/s
* Running DD read benchmark with 128 threads...
* Run 1 read speed: 13579.17 MB/s
* Run 2 read speed: 13580.83 MB/s
✓ Average read speed: 13580.00 MB/s

############################################################
#         DD Benchmark Results for Pool: tank_nvme         #
############################################################


------------------------------------------------------------
|                        Threads: 1                        |
------------------------------------------------------------

• 1M Seq Write Run 1: 290.09 MB/s
• 1M Seq Write Run 2: 290.04 MB/s
• 1M Seq Write Avg: 290.06 MB/s
• 1M Seq Read Run 1: 12554.16 MB/s
• 1M Seq Read Run 2: 12627.29 MB/s
• 1M Seq Read Avg: 12590.72 MB/s

------------------------------------------------------------
|                       Threads: 32                        |
------------------------------------------------------------

• 1M Seq Write Run 1: 6010.61 MB/s
• 1M Seq Write Run 2: 5941.69 MB/s
• 1M Seq Write Avg: 5976.15 MB/s
• 1M Seq Read Run 1: 87993.54 MB/s
• 1M Seq Read Run 2: 88517.51 MB/s
• 1M Seq Read Avg: 88255.53 MB/s

------------------------------------------------------------
|                       Threads: 64                        |
------------------------------------------------------------

• 1M Seq Write Run 1: 5959.05 MB/s
• 1M Seq Write Run 2: 5939.39 MB/s
• 1M Seq Write Avg: 5949.22 MB/s
• 1M Seq Read Run 1: 13579.12 MB/s
• 1M Seq Read Run 2: 13581.22 MB/s
• 1M Seq Read Avg: 13580.17 MB/s

------------------------------------------------------------
|                       Threads: 128                       |
------------------------------------------------------------

• 1M Seq Write Run 1: 5944.06 MB/s
• 1M Seq Write Run 2: 5925.43 MB/s
• 1M Seq Write Avg: 5934.74 MB/s
• 1M Seq Read Run 1: 13579.17 MB/s
• 1M Seq Read Run 2: 13580.83 MB/s
• 1M Seq Read Avg: 13580.00 MB/s
* Cleaning up test files...

############################################################
#                   Disk Read Benchmark                    #
############################################################

* This benchmark tests the 4K sequential read performance of each disk
* To work around ARC caching, reads data = min(system RAM, disk size)

============================================================
 Testing Disk: sdb
============================================================

* Testing disk: sdb
* Run 1: 366.14 MB/s
* Testing disk: sdb
* Run 2: 1777.39 MB/s
✓ Average: 1071.76 MB/s

============================================================
 Testing Disk: sda
============================================================

* Testing disk: sda
* Run 1: 368.25 MB/s
* Testing disk: sda
* Run 2: 1778.68 MB/s
✓ Average: 1073.47 MB/s

============================================================
 Testing Disk: nvme0n1
============================================================

* Testing disk: nvme0n1
* Run 1: 1219.95 MB/s
* Testing disk: nvme0n1
* Run 2: 1105.75 MB/s
✓ Average: 1162.85 MB/s

============================================================
 Testing Disk: nvme1n1
============================================================

* Testing disk: nvme1n1
* Run 1: 1219.87 MB/s
* Testing disk: nvme1n1
* Run 2: 1096.81 MB/s
✓ Average: 1158.34 MB/s

============================================================
 Testing Disk: nvme2n1
============================================================

* Testing disk: nvme2n1
* Run 1: 1224.29 MB/s
* Testing disk: nvme2n1
* Run 2: 1095.84 MB/s
✓ Average: 1160.06 MB/s

============================================================
 Testing Disk: nvme3n1
============================================================

* Testing disk: nvme3n1
* Run 1: 1220.38 MB/s
* Testing disk: nvme3n1
* Run 2: 1099.83 MB/s
✓ Average: 1160.11 MB/s

============================================================
 Testing Disk: nvme4n1
============================================================

* Testing disk: nvme4n1
* Run 1: 1219.19 MB/s
* Testing disk: nvme4n1
* Run 2: 1096.64 MB/s
✓ Average: 1157.92 MB/s

============================================================
 Testing Disk: nvme5n1
============================================================

* Testing disk: nvme5n1
* Run 1: 1220.42 MB/s
* Testing disk: nvme5n1
* Run 2: 1102.78 MB/s
✓ Average: 1161.60 MB/s

============================================================
 Testing Disk: nvme6n1
============================================================

* Testing disk: nvme6n1
* Run 1: 1220.79 MB/s
* Testing disk: nvme6n1
* Run 2: 1100.04 MB/s
✓ Average: 1160.42 MB/s

============================================================
 Testing Disk: nvme7n1
============================================================

* Testing disk: nvme7n1
* Run 1: 1217.11 MB/s
* Testing disk: nvme7n1
* Run 2: 1096.23 MB/s
✓ Average: 1156.67 MB/s

============================================================
 Testing Disk: nvme8n1
============================================================

* Testing disk: nvme8n1
* Run 1: 1220.42 MB/s
* Testing disk: nvme8n1
* Run 2: 1108.32 MB/s
✓ Average: 1164.37 MB/s

============================================================
 Testing Disk: nvme9n1
============================================================

* Testing disk: nvme9n1
* Run 1: 1215.58 MB/s
* Testing disk: nvme9n1
* Run 2: 1097.47 MB/s
✓ Average: 1156.53 MB/s

============================================================
 Testing Disk: nvme10n1
============================================================

* Testing disk: nvme10n1
* Run 1: 1228.96 MB/s
* Testing disk: nvme10n1
* Run 2: 1105.50 MB/s
✓ Average: 1167.23 MB/s

============================================================
 Testing Disk: nvme11n1
============================================================

* Testing disk: nvme11n1
* Run 1: 1224.87 MB/s
* Testing disk: nvme11n1
* Run 2: 1110.40 MB/s
✓ Average: 1167.63 MB/s

============================================================
 Testing Disk: nvme12n1
============================================================

* Testing disk: nvme12n1
* Run 1: 1217.78 MB/s
* Testing disk: nvme12n1
* Run 2: 1096.58 MB/s
✓ Average: 1157.18 MB/s

============================================================
 Testing Disk: nvme13n1
============================================================

* Testing disk: nvme13n1
* Run 1: 1204.11 MB/s
* Testing disk: nvme13n1
* Run 2: 1088.69 MB/s
✓ Average: 1146.40 MB/s

============================================================
 Testing Disk: nvme14n1
============================================================

* Testing disk: nvme14n1
* Run 1: 1218.49 MB/s
* Testing disk: nvme14n1
* Run 2: 1093.48 MB/s
✓ Average: 1155.99 MB/s

============================================================
 Testing Disk: nvme15n1
============================================================

* Testing disk: nvme15n1
* Run 1: 1215.31 MB/s
* Testing disk: nvme15n1
* Run 2: 1096.53 MB/s
✓ Average: 1155.92 MB/s

============================================================
 Testing Disk: nvme16n1
============================================================

* Testing disk: nvme16n1
* Run 1: 1222.97 MB/s
* Testing disk: nvme16n1
* Run 2: 1106.56 MB/s
✓ Average: 1164.76 MB/s

============================================================
 Testing Disk: nvme17n1
============================================================

* Testing disk: nvme17n1
* Run 1: 1220.54 MB/s
* Testing disk: nvme17n1
* Run 2: 1110.28 MB/s
✓ Average: 1165.41 MB/s

============================================================
 Testing Disk: nvme18n1
============================================================

* Testing disk: nvme18n1
* Run 1: 1218.57 MB/s
* Testing disk: nvme18n1
* Run 2: 1108.77 MB/s
✓ Average: 1163.67 MB/s

============================================================
 Testing Disk: nvme19n1
============================================================

* Testing disk: nvme19n1
* Run 1: 1224.45 MB/s
* Testing disk: nvme19n1
* Run 2: 1104.64 MB/s
✓ Average: 1164.55 MB/s

============================================================
 Testing Disk: nvme20n1
============================================================

* Testing disk: nvme20n1
* Run 1: 1222.20 MB/s
* Testing disk: nvme20n1
* Run 2: 1101.71 MB/s
✓ Average: 1161.95 MB/s

============================================================
 Testing Disk: nvme21n1
============================================================

* Testing disk: nvme21n1
* Run 1: 1212.45 MB/s
* Testing disk: nvme21n1
* Run 2: 1091.92 MB/s
✓ Average: 1152.18 MB/s

============================================================
 Testing Disk: nvme22n1
============================================================

* Testing disk: nvme22n1
* Run 1: 1217.45 MB/s
* Testing disk: nvme22n1
* Run 2: 1097.47 MB/s
✓ Average: 1157.46 MB/s

============================================================
 Testing Disk: nvme23n1
============================================================

* Testing disk: nvme23n1
* Run 1: 1217.23 MB/s
* Testing disk: nvme23n1
* Run 2: 1096.25 MB/s
✓ Average: 1156.74 MB/s

============================================================
 Testing Disk: nvme24n1
============================================================

* Testing disk: nvme24n1
* Run 1: 1281.74 MB/s
* Testing disk: nvme24n1
* Run 2: 1775.77 MB/s
✓ Average: 1528.75 MB/s

############################################################
#               Disk Read Benchmark Results                #
############################################################


------------------------------------------------------------
|                        Disk: sdb                         |
------------------------------------------------------------

• Run 1: 366.14 MB/s
• Run 2: 1777.39 MB/s
• Average: 1071.76 MB/s

------------------------------------------------------------
|                        Disk: sda                         |
------------------------------------------------------------

• Run 1: 368.25 MB/s
• Run 2: 1778.68 MB/s
• Average: 1073.47 MB/s

------------------------------------------------------------
|                      Disk: nvme0n1                       |
------------------------------------------------------------

• Run 1: 1219.95 MB/s
• Run 2: 1105.75 MB/s
• Average: 1162.85 MB/s

------------------------------------------------------------
|                      Disk: nvme1n1                       |
------------------------------------------------------------

• Run 1: 1219.87 MB/s
• Run 2: 1096.81 MB/s
• Average: 1158.34 MB/s

------------------------------------------------------------
|                      Disk: nvme2n1                       |
------------------------------------------------------------

• Run 1: 1224.29 MB/s
• Run 2: 1095.84 MB/s
• Average: 1160.06 MB/s

------------------------------------------------------------
|                      Disk: nvme3n1                       |
------------------------------------------------------------

• Run 1: 1220.38 MB/s
• Run 2: 1099.83 MB/s
• Average: 1160.11 MB/s

------------------------------------------------------------
|                      Disk: nvme4n1                       |
------------------------------------------------------------

• Run 1: 1219.19 MB/s
• Run 2: 1096.64 MB/s
• Average: 1157.92 MB/s

------------------------------------------------------------
|                      Disk: nvme5n1                       |
------------------------------------------------------------

• Run 1: 1220.42 MB/s
• Run 2: 1102.78 MB/s
• Average: 1161.60 MB/s

------------------------------------------------------------
|                      Disk: nvme6n1                       |
------------------------------------------------------------

• Run 1: 1220.79 MB/s
• Run 2: 1100.04 MB/s
• Average: 1160.42 MB/s

------------------------------------------------------------
|                      Disk: nvme7n1                       |
------------------------------------------------------------

• Run 1: 1217.11 MB/s
• Run 2: 1096.23 MB/s
• Average: 1156.67 MB/s

------------------------------------------------------------
|                      Disk: nvme8n1                       |
------------------------------------------------------------

• Run 1: 1220.42 MB/s
• Run 2: 1108.32 MB/s
• Average: 1164.37 MB/s

------------------------------------------------------------
|                      Disk: nvme9n1                       |
------------------------------------------------------------

• Run 1: 1215.58 MB/s
• Run 2: 1097.47 MB/s
• Average: 1156.53 MB/s

------------------------------------------------------------
|                      Disk: nvme10n1                      |
------------------------------------------------------------

• Run 1: 1228.96 MB/s
• Run 2: 1105.50 MB/s
• Average: 1167.23 MB/s

------------------------------------------------------------
|                      Disk: nvme11n1                      |
------------------------------------------------------------

• Run 1: 1224.87 MB/s
• Run 2: 1110.40 MB/s
• Average: 1167.63 MB/s

------------------------------------------------------------
|                      Disk: nvme12n1                      |
------------------------------------------------------------

• Run 1: 1217.78 MB/s
• Run 2: 1096.58 MB/s
• Average: 1157.18 MB/s

------------------------------------------------------------
|                      Disk: nvme13n1                      |
------------------------------------------------------------

• Run 1: 1204.11 MB/s
• Run 2: 1088.69 MB/s
• Average: 1146.40 MB/s

------------------------------------------------------------
|                      Disk: nvme14n1                      |
------------------------------------------------------------

• Run 1: 1218.49 MB/s
• Run 2: 1093.48 MB/s
• Average: 1155.99 MB/s

------------------------------------------------------------
|                      Disk: nvme15n1                      |
------------------------------------------------------------

• Run 1: 1215.31 MB/s
• Run 2: 1096.53 MB/s
• Average: 1155.92 MB/s

------------------------------------------------------------
|                      Disk: nvme16n1                      |
------------------------------------------------------------

• Run 1: 1222.97 MB/s
• Run 2: 1106.56 MB/s
• Average: 1164.76 MB/s

------------------------------------------------------------
|                      Disk: nvme17n1                      |
------------------------------------------------------------

• Run 1: 1220.54 MB/s
• Run 2: 1110.28 MB/s
• Average: 1165.41 MB/s

------------------------------------------------------------
|                      Disk: nvme18n1                      |
------------------------------------------------------------

• Run 1: 1218.57 MB/s
• Run 2: 1108.77 MB/s
• Average: 1163.67 MB/s

------------------------------------------------------------
|                      Disk: nvme19n1                      |
------------------------------------------------------------

• Run 1: 1224.45 MB/s
• Run 2: 1104.64 MB/s
• Average: 1164.55 MB/s

------------------------------------------------------------
|                      Disk: nvme20n1                      |
------------------------------------------------------------

• Run 1: 1222.20 MB/s
• Run 2: 1101.71 MB/s
• Average: 1161.95 MB/s

------------------------------------------------------------
|                      Disk: nvme21n1                      |
------------------------------------------------------------

• Run 1: 1212.45 MB/s
• Run 2: 1091.92 MB/s
• Average: 1152.18 MB/s

------------------------------------------------------------
|                      Disk: nvme22n1                      |
------------------------------------------------------------

• Run 1: 1217.45 MB/s
• Run 2: 1097.47 MB/s
• Average: 1157.46 MB/s

------------------------------------------------------------
|                      Disk: nvme23n1                      |
------------------------------------------------------------

• Run 1: 1217.23 MB/s
• Run 2: 1096.25 MB/s
• Average: 1156.74 MB/s

------------------------------------------------------------
|                      Disk: nvme24n1                      |
------------------------------------------------------------

• Run 1: 1281.74 MB/s
• Run 2: 1775.77 MB/s
• Average: 1528.75 MB/s

############################################################
#                    Benchmark Complete                    #
############################################################

✓ Total benchmark time: 408.15 minutes
System 2 w/ Dell branded Samsung drives
############################################################
#                      TN-Bench v1.10                      #
############################################################

TN-Bench is an OpenSource Software Script that uses standard tools to
Benchmark your System and collect various statistical information via
the TrueNAS API.

* TN-Bench will create a Dataset in each of your pools for testing purposes
* that will consume 20 GiB of space for every thread in your system.

! WARNING: This test will make your system EXTREMELY slow during its run.
! WARNING: It is recommended to run this test when no other workloads are running.

* ZFS ARC will impact your results. You can set zfs_arc_max to 1 to prevent ARC caching.
* Setting it back to 0 restores default behavior but requires a system restart.

============================================================
 Confirmation
============================================================

Would you like to continue? (yes/no): yes

------------------------------------------------------------
|                    System Information                    |
------------------------------------------------------------

Field                 | Value
----------------------+--------------------------------
Version               | 25.04.1
Load Average (1m)     | 0.11376953125
Load Average (5m)     | 1.314453125
Load Average (15m)    | 1.07421875
Model                 | AMD EPYC 7662 64-Core Processor
Cores                 | 128
Physical Cores        | 64
System Product        | None
Physical Memory (GiB) | 503.28

------------------------------------------------------------
|                     Pool Information                     |
------------------------------------------------------------

Field      | Value
-----------+----------
Name       | TANK
Path       | /mnt/TANK
Status     | ONLINE
VDEV Count | 2
Disk Count | 24

VDEV Name  | Type           | Disk Count
-----------+----------------+---------------
raidz1-0    | RAIDZ1         | 12
raidz1-1    | RAIDZ1         | 12

------------------------------------------------------------
|                     Disk Information                     |
------------------------------------------------------------

* The TrueNAS API returns N/A for the Pool for boot devices and disks not in a pool.
Field      | Value
-----------+----------------------------------
Name       | sda
Model      | DELLBOSS_VD
Serial     | 17f2a38508570010
ZFS GUID   | None
Pool       | N/A
Size (GiB) | 447.07
-----------+----------------------------------
Name       | nvme0n1
Model      | Dell Ent NVMe v2 AGN MU U.2 1.6TB
Serial     | S6CTNA0RA12595
ZFS GUID   | 9578401723327275319
Pool       | TANK
Size (GiB) | 1490.42
-----------+----------------------------------
Name       | nvme1n1
Model      | Dell Ent NVMe v2 AGN MU U.2 1.6TB
Serial     | S6CTNA0RA12593
ZFS GUID   | 16493314469107338392
Pool       | TANK
Size (GiB) | 1490.42
-----------+----------------------------------
Name       | nvme2n1
Model      | Dell Ent NVMe v2 AGN MU U.2 1.6TB
Serial     | S6CTNA0RA12555
ZFS GUID   | 2284397100341646953
Pool       | TANK
Size (GiB) | 1490.42
-----------+----------------------------------
Name       | nvme3n1
Model      | Dell Ent NVMe v2 AGN MU U.2 1.6TB
Serial     | S6CTNA0RA12591
ZFS GUID   | 2379668797837614451
Pool       | TANK
Size (GiB) | 1490.42
-----------+----------------------------------
Name       | nvme4n1
Model      | Dell Ent NVMe v2 AGN MU U.2 1.6TB
Serial     | S6CTNA0RA12605
ZFS GUID   | 7115188145300105827
Pool       | TANK
Size (GiB) | 1490.42
-----------+----------------------------------
Name       | nvme5n1
Model      | Dell Ent NVMe v2 AGN MU U.2 1.6TB
Serial     | S6CTNA0RA12610
ZFS GUID   | 396967913914441321
Pool       | TANK
Size (GiB) | 1490.42
-----------+----------------------------------
Name       | nvme6n1
Model      | Dell Ent NVMe v2 AGN MU U.2 1.6TB
Serial     | S6CTNA0RA12597
ZFS GUID   | 17092000990891462689
Pool       | TANK
Size (GiB) | 1490.42
-----------+----------------------------------
Name       | nvme7n1
Model      | Dell Ent NVMe v2 AGN MU U.2 1.6TB
Serial     | S6CTNA0RA12598
ZFS GUID   | 8771458765357871374
Pool       | TANK
Size (GiB) | 1490.42
-----------+----------------------------------
Name       | nvme8n1
Model      | Dell Ent NVMe v2 AGN MU U.2 1.6TB
Serial     | S6CTNA0RA12589
ZFS GUID   | 17327496731552332589
Pool       | TANK
Size (GiB) | 1490.42
-----------+----------------------------------
Name       | nvme9n1
Model      | Dell Ent NVMe v2 AGN MU U.2 1.6TB
Serial     | S6CTNA0RA12590
ZFS GUID   | 12267436198932738171
Pool       | TANK
Size (GiB) | 1490.42
-----------+----------------------------------
Name       | nvme10n1
Model      | Dell Ent NVMe v2 AGN MU U.2 1.6TB
Serial     | S6CTNA0RA12587
ZFS GUID   | 1599784523749477609
Pool       | TANK
Size (GiB) | 1490.42
-----------+----------------------------------
Name       | nvme11n1
Model      | Dell Ent NVMe v2 AGN MU U.2 1.6TB
Serial     | S6CTNA0RA12615
ZFS GUID   | 603448722177622227
Pool       | TANK
Size (GiB) | 1490.42
-----------+----------------------------------
Name       | nvme12n1
Model      | Dell Ent NVMe v2 AGN MU U.2 1.6TB
Serial     | S6CTNA0RA04283
ZFS GUID   | 3077441043607012352
Pool       | TANK
Size (GiB) | 1490.42
-----------+----------------------------------
Name       | nvme13n1
Model      | Dell Ent NVMe v2 AGN MU U.2 1.6TB
Serial     | S6CTNA0RA04776
ZFS GUID   | 13134616083144485938
Pool       | TANK
Size (GiB) | 1490.42
-----------+----------------------------------
Name       | nvme14n1
Model      | Dell Ent NVMe v2 AGN MU U.2 1.6TB
Serial     | S6CTNA0RA04779
ZFS GUID   | 12981670725398864550
Pool       | TANK
Size (GiB) | 1490.42
-----------+----------------------------------
Name       | nvme15n1
Model      | Dell Ent NVMe v2 AGN MU U.2 1.6TB
Serial     | S6CTNA0T507567
ZFS GUID   | 1528148225057871650
Pool       | TANK
Size (GiB) | 1490.42
-----------+----------------------------------
Name       | nvme16n1
Model      | Dell Ent NVMe v2 AGN MU U.2 1.6TB
Serial     | S6CTNA0T507566
ZFS GUID   | 344934966784289440
Pool       | TANK
Size (GiB) | 1490.42
-----------+----------------------------------
Name       | nvme17n1
Model      | Dell Ent NVMe v2 AGN MU U.2 1.6TB
Serial     | S6CTNA0R704240
ZFS GUID   | 15848361726259403723
Pool       | TANK
Size (GiB) | 1490.42
-----------+----------------------------------
Name       | nvme18n1
Model      | Dell Ent NVMe v2 AGN MU U.2 1.6TB
Serial     | S6CTNE0RC01125
ZFS GUID   | 1493734653931731866
Pool       | TANK
Size (GiB) | 1490.42
-----------+----------------------------------
Name       | nvme19n1
Model      | Dell Ent NVMe v2 AGN MU U.2 1.6TB
Serial     | S6CTNA0RA04781
ZFS GUID   | 3196105231274315637
Pool       | TANK
Size (GiB) | 1490.42
-----------+----------------------------------
Name       | nvme20n1
Model      | Dell Ent NVMe v2 AGN MU U.2 1.6TB
Serial     | S6CTNA0RA04778
ZFS GUID   | 6087712907268780921
Pool       | TANK
Size (GiB) | 1490.42
-----------+----------------------------------
Name       | nvme21n1
Model      | Dell Ent NVMe v2 AGN MU U.2 1.6TB
Serial     | S6CTNA0RA10832
ZFS GUID   | 14181120083509110904
Pool       | TANK
Size (GiB) | 1490.42
-----------+----------------------------------
Name       | nvme22n1
Model      | Dell Ent NVMe v2 AGN MU U.2 1.6TB
Serial     | S6CTNE0RC01128
ZFS GUID   | 410588381650683174
Pool       | TANK
Size (GiB) | 1490.42
-----------+----------------------------------
Name       | nvme23n1
Model      | Dell Ent NVMe v2 AGN MU U.2 1.6TB
Serial     | S6CTNA0T605574
ZFS GUID   | 14826303032100380133
Pool       | TANK
Size (GiB) | 1490.42
-----------+----------------------------------
Name       | nvme24n1
Model      | INTEL SSDPEK1A118GA
Serial     | PHOC216600TF118B
ZFS GUID   | 11880801796010945582
Pool       | N/A
Size (GiB) | 110.28
-----------+----------------------------------

############################################################
#                      Pool Selection                      #
############################################################

* Available pools:
• 1. TANK
* Options:
• 1. Enter specific pool numbers (comma separated)
• 2. Type 'all' to test all pools
• 3. Type 'none' to skip pool testing

Enter your choice [all]: 1

############################################################
#              ZFS Pool Benchmark Iterations               #
############################################################

* How many times should we run each test?
• 1. Run each test once (faster)
• 2. Run each test twice (default, more accurate)

Enter iteration count (1 or 2) [2]:

############################################################
#                Individual Disk Benchmark                 #
############################################################

Run individual disk read benchmark? (yes/no) [yes]:

############################################################
#           Individual Disk Benchmark Iterations           #
############################################################

* How many times should we run each test?
• 1. Run each test once (faster)
• 2. Run each test twice (default, more accurate)

Enter iteration count (1 or 2) [2]:

############################################################
#                  DD Benchmark Starting                   #
############################################################

* Using 128 threads for the benchmark.
* ZFS tests will run 2 time(s) per configuration
* Disk tests will run 2 time(s) per disk

############################################################
#                    Testing Pool: TANK                    #
############################################################

* Creating test dataset for pool: TANK
✓ Dataset TANK/tn-bench created successfully.

============================================================
 Space Verification
============================================================

* Available space: 15344.81 GiB
* Space required:  2560.00 GiB (20 GiB/thread × 128 threads)
✓ Sufficient space available - proceeding with benchmarks

============================================================
 Testing Pool: TANK - Threads: 1
============================================================

* Running DD write benchmark with 1 threads...
* Run 1 write speed: 285.06 MB/s
* Run 2 write speed: 280.48 MB/s
✓ Average write speed: 282.77 MB/s
* Running DD read benchmark with 1 threads...
* Run 1 read speed: 12510.73 MB/s
* Run 2 read speed: 12590.64 MB/s
✓ Average read speed: 12550.69 MB/s

============================================================
 Testing Pool: TANK - Threads: 32
============================================================

* Running DD write benchmark with 32 threads...
* Run 1 write speed: 6987.44 MB/s
* Run 2 write speed: 6854.52 MB/s
✓ Average write speed: 6920.98 MB/s
* Running DD read benchmark with 32 threads...
* Run 1 read speed: 86722.92 MB/s
* Run 2 read speed: 86896.59 MB/s
✓ Average read speed: 86809.75 MB/s

============================================================
 Testing Pool: TANK - Threads: 64
============================================================

* Running DD write benchmark with 64 threads...
* Run 1 write speed: 10293.96 MB/s
* Run 2 write speed: 10214.31 MB/s
✓ Average write speed: 10254.13 MB/s
* Running DD read benchmark with 64 threads...
* Run 1 read speed: 43998.05 MB/s
* Run 2 read speed: 43950.92 MB/s
✓ Average read speed: 43974.49 MB/s

============================================================
 Testing Pool: TANK - Threads: 128
============================================================

* Running DD write benchmark with 128 threads...
* Run 1 write speed: 11399.69 MB/s
* Run 2 write speed: 11292.56 MB/s
✓ Average write speed: 11346.13 MB/s
* Running DD read benchmark with 128 threads...
* Run 1 read speed: 40927.14 MB/s
* Run 2 read speed: 40717.09 MB/s
✓ Average read speed: 40822.12 MB/s

############################################################
#           DD Benchmark Results for Pool: TANK            #
############################################################


------------------------------------------------------------
|                        Threads: 1                        |
------------------------------------------------------------

• 1M Seq Write Run 1: 285.06 MB/s
• 1M Seq Write Run 2: 280.48 MB/s
• 1M Seq Write Avg: 282.77 MB/s
• 1M Seq Read Run 1: 12510.73 MB/s
• 1M Seq Read Run 2: 12590.64 MB/s
• 1M Seq Read Avg: 12550.69 MB/s

------------------------------------------------------------
|                       Threads: 32                        |
------------------------------------------------------------

• 1M Seq Write Run 1: 6987.44 MB/s
• 1M Seq Write Run 2: 6854.52 MB/s
• 1M Seq Write Avg: 6920.98 MB/s
• 1M Seq Read Run 1: 86722.92 MB/s
• 1M Seq Read Run 2: 86896.59 MB/s
• 1M Seq Read Avg: 86809.75 MB/s

------------------------------------------------------------
|                       Threads: 64                        |
------------------------------------------------------------

• 1M Seq Write Run 1: 10293.96 MB/s
• 1M Seq Write Run 2: 10214.31 MB/s
• 1M Seq Write Avg: 10254.13 MB/s
• 1M Seq Read Run 1: 43998.05 MB/s
• 1M Seq Read Run 2: 43950.92 MB/s
• 1M Seq Read Avg: 43974.49 MB/s

------------------------------------------------------------
|                       Threads: 128                       |
------------------------------------------------------------

• 1M Seq Write Run 1: 11399.69 MB/s
• 1M Seq Write Run 2: 11292.56 MB/s
• 1M Seq Write Avg: 11346.13 MB/s
• 1M Seq Read Run 1: 40927.14 MB/s
• 1M Seq Read Run 2: 40717.09 MB/s
• 1M Seq Read Avg: 40822.12 MB/s
* Cleaning up test files...

############################################################
#                   Disk Read Benchmark                    #
############################################################

* This benchmark tests the 4K sequential read performance of each disk
* To work around ARC caching, reads data = min(system RAM, disk size)

============================================================
 Testing Disk: sda
============================================================

* Testing disk: sda
* Run 1: 507.66 MB/s
* Testing disk: sda
* Run 2: 1760.09 MB/s
✓ Average: 1133.88 MB/s

============================================================
 Testing Disk: nvme0n1
============================================================

* Testing disk: nvme0n1
* Run 1: 958.22 MB/s
* Testing disk: nvme0n1
* Run 2: 921.23 MB/s
✓ Average: 939.73 MB/s

============================================================
 Testing Disk: nvme1n1
============================================================

* Testing disk: nvme1n1
* Run 1: 963.02 MB/s
* Testing disk: nvme1n1
* Run 2: 918.84 MB/s
✓ Average: 940.93 MB/s

============================================================
 Testing Disk: nvme2n1
============================================================

* Testing disk: nvme2n1
* Run 1: 962.35 MB/s
* Testing disk: nvme2n1
* Run 2: 920.54 MB/s
✓ Average: 941.44 MB/s

============================================================
 Testing Disk: nvme3n1
============================================================

* Testing disk: nvme3n1
* Run 1: 941.93 MB/s
* Testing disk: nvme3n1
* Run 2: 923.42 MB/s
✓ Average: 932.67 MB/s

============================================================
 Testing Disk: nvme4n1
============================================================

* Testing disk: nvme4n1
* Run 1: 961.70 MB/s
* Testing disk: nvme4n1
* Run 2: 924.84 MB/s
✓ Average: 943.27 MB/s

============================================================
 Testing Disk: nvme5n1
============================================================

* Testing disk: nvme5n1
* Run 1: 966.51 MB/s
* Testing disk: nvme5n1
* Run 2: 932.06 MB/s
✓ Average: 949.28 MB/s

============================================================
 Testing Disk: nvme6n1
============================================================

* Testing disk: nvme6n1
* Run 1: 964.06 MB/s
* Testing disk: nvme6n1
* Run 2: 928.29 MB/s
✓ Average: 946.18 MB/s

============================================================
 Testing Disk: nvme7n1
============================================================

* Testing disk: nvme7n1
* Run 1: 965.61 MB/s
* Testing disk: nvme7n1
* Run 2: 920.59 MB/s
✓ Average: 943.10 MB/s

============================================================
 Testing Disk: nvme8n1
============================================================

* Testing disk: nvme8n1
* Run 1: 967.47 MB/s
* Testing disk: nvme8n1
* Run 2: 922.06 MB/s
✓ Average: 944.77 MB/s

============================================================
 Testing Disk: nvme9n1
============================================================

* Testing disk: nvme9n1
* Run 1: 937.71 MB/s
* Testing disk: nvme9n1
* Run 2: 927.70 MB/s
✓ Average: 932.71 MB/s

============================================================
 Testing Disk: nvme10n1
============================================================

* Testing disk: nvme10n1
* Run 1: 965.10 MB/s
* Testing disk: nvme10n1
* Run 2: 922.65 MB/s
✓ Average: 943.87 MB/s

============================================================
 Testing Disk: nvme11n1
============================================================

* Testing disk: nvme11n1
* Run 1: 961.96 MB/s
* Testing disk: nvme11n1
* Run 2: 920.74 MB/s
✓ Average: 941.35 MB/s

============================================================
 Testing Disk: nvme12n1
============================================================

* Testing disk: nvme12n1
* Run 1: 959.38 MB/s
* Testing disk: nvme12n1
* Run 2: 913.47 MB/s
✓ Average: 936.42 MB/s

============================================================
 Testing Disk: nvme13n1
============================================================

* Testing disk: nvme13n1
* Run 1: 965.89 MB/s
* Testing disk: nvme13n1
* Run 2: 923.95 MB/s
✓ Average: 944.92 MB/s

============================================================
 Testing Disk: nvme14n1
============================================================

* Testing disk: nvme14n1
* Run 1: 818.75 MB/s
* Testing disk: nvme14n1
* Run 2: 905.10 MB/s
✓ Average: 861.93 MB/s

============================================================
 Testing Disk: nvme15n1
============================================================

* Testing disk: nvme15n1
* Run 1: 961.02 MB/s
* Testing disk: nvme15n1
* Run 2: 913.09 MB/s
✓ Average: 937.05 MB/s

============================================================
 Testing Disk: nvme16n1
============================================================

* Testing disk: nvme16n1
* Run 1: 958.57 MB/s
* Testing disk: nvme16n1
* Run 2: 915.70 MB/s
✓ Average: 937.14 MB/s

============================================================
 Testing Disk: nvme17n1
============================================================

* Testing disk: nvme17n1
* Run 1: 949.33 MB/s
* Testing disk: nvme17n1
* Run 2: 907.66 MB/s
✓ Average: 928.50 MB/s

============================================================
 Testing Disk: nvme18n1
============================================================

* Testing disk: nvme18n1
* Run 1: 961.89 MB/s
* Testing disk: nvme18n1
* Run 2: 911.99 MB/s
✓ Average: 936.94 MB/s

============================================================
 Testing Disk: nvme19n1
============================================================

* Testing disk: nvme19n1
* Run 1: 964.08 MB/s
* Testing disk: nvme19n1
* Run 2: 919.37 MB/s
✓ Average: 941.73 MB/s

============================================================
 Testing Disk: nvme20n1
============================================================

* Testing disk: nvme20n1
* Run 1: 962.79 MB/s
* Testing disk: nvme20n1
* Run 2: 912.99 MB/s
✓ Average: 937.89 MB/s

============================================================
 Testing Disk: nvme21n1
============================================================

* Testing disk: nvme21n1
* Run 1: 966.97 MB/s
* Testing disk: nvme21n1
* Run 2: 927.15 MB/s
✓ Average: 947.06 MB/s

============================================================
 Testing Disk: nvme22n1
============================================================

* Testing disk: nvme22n1
* Run 1: 963.79 MB/s
* Testing disk: nvme22n1
* Run 2: 925.86 MB/s
✓ Average: 944.83 MB/s

============================================================
 Testing Disk: nvme23n1
============================================================

* Testing disk: nvme23n1
* Run 1: 953.61 MB/s
* Testing disk: nvme23n1
* Run 2: 910.89 MB/s
✓ Average: 932.25 MB/s

============================================================
 Testing Disk: nvme24n1
============================================================

* Testing disk: nvme24n1
* Run 1: 1275.22 MB/s
* Testing disk: nvme24n1
* Run 2: 1755.06 MB/s
✓ Average: 1515.14 MB/s

############################################################
#               Disk Read Benchmark Results                #
############################################################


------------------------------------------------------------
|                        Disk: sda                         |
------------------------------------------------------------

• Run 1: 507.66 MB/s
• Run 2: 1760.09 MB/s
• Average: 1133.88 MB/s

------------------------------------------------------------
|                      Disk: nvme0n1                       |
------------------------------------------------------------

• Run 1: 958.22 MB/s
• Run 2: 921.23 MB/s
• Average: 939.73 MB/s

------------------------------------------------------------
|                      Disk: nvme1n1                       |
------------------------------------------------------------

• Run 1: 963.02 MB/s
• Run 2: 918.84 MB/s
• Average: 940.93 MB/s

------------------------------------------------------------
|                      Disk: nvme2n1                       |
------------------------------------------------------------

• Run 1: 962.35 MB/s
• Run 2: 920.54 MB/s
• Average: 941.44 MB/s

------------------------------------------------------------
|                      Disk: nvme3n1                       |
------------------------------------------------------------

• Run 1: 941.93 MB/s
• Run 2: 923.42 MB/s
• Average: 932.67 MB/s

------------------------------------------------------------
|                      Disk: nvme4n1                       |
------------------------------------------------------------

• Run 1: 961.70 MB/s
• Run 2: 924.84 MB/s
• Average: 943.27 MB/s

------------------------------------------------------------
|                      Disk: nvme5n1                       |
------------------------------------------------------------

• Run 1: 966.51 MB/s
• Run 2: 932.06 MB/s
• Average: 949.28 MB/s

------------------------------------------------------------
|                      Disk: nvme6n1                       |
------------------------------------------------------------

• Run 1: 964.06 MB/s
• Run 2: 928.29 MB/s
• Average: 946.18 MB/s

------------------------------------------------------------
|                      Disk: nvme7n1                       |
------------------------------------------------------------

• Run 1: 965.61 MB/s
• Run 2: 920.59 MB/s
• Average: 943.10 MB/s

------------------------------------------------------------
|                      Disk: nvme8n1                       |
------------------------------------------------------------

• Run 1: 967.47 MB/s
• Run 2: 922.06 MB/s
• Average: 944.77 MB/s

------------------------------------------------------------
|                      Disk: nvme9n1                       |
------------------------------------------------------------

• Run 1: 937.71 MB/s
• Run 2: 927.70 MB/s
• Average: 932.71 MB/s

------------------------------------------------------------
|                      Disk: nvme10n1                      |
------------------------------------------------------------

• Run 1: 965.10 MB/s
• Run 2: 922.65 MB/s
• Average: 943.87 MB/s

------------------------------------------------------------
|                      Disk: nvme11n1                      |
------------------------------------------------------------

• Run 1: 961.96 MB/s
• Run 2: 920.74 MB/s
• Average: 941.35 MB/s

------------------------------------------------------------
|                      Disk: nvme12n1                      |
------------------------------------------------------------

• Run 1: 959.38 MB/s
• Run 2: 913.47 MB/s
• Average: 936.42 MB/s

------------------------------------------------------------
|                      Disk: nvme13n1                      |
------------------------------------------------------------

• Run 1: 965.89 MB/s
• Run 2: 923.95 MB/s
• Average: 944.92 MB/s

------------------------------------------------------------
|                      Disk: nvme14n1                      |
------------------------------------------------------------

• Run 1: 818.75 MB/s
• Run 2: 905.10 MB/s
• Average: 861.93 MB/s

------------------------------------------------------------
|                      Disk: nvme15n1                      |
------------------------------------------------------------

• Run 1: 961.02 MB/s
• Run 2: 913.09 MB/s
• Average: 937.05 MB/s

------------------------------------------------------------
|                      Disk: nvme16n1                      |
------------------------------------------------------------

• Run 1: 958.57 MB/s
• Run 2: 915.70 MB/s
• Average: 937.14 MB/s

------------------------------------------------------------
|                      Disk: nvme17n1                      |
------------------------------------------------------------

• Run 1: 949.33 MB/s
• Run 2: 907.66 MB/s
• Average: 928.50 MB/s

------------------------------------------------------------
|                      Disk: nvme18n1                      |
------------------------------------------------------------

• Run 1: 961.89 MB/s
• Run 2: 911.99 MB/s
• Average: 936.94 MB/s

------------------------------------------------------------
|                      Disk: nvme19n1                      |
------------------------------------------------------------

• Run 1: 964.08 MB/s
• Run 2: 919.37 MB/s
• Average: 941.73 MB/s

------------------------------------------------------------
|                      Disk: nvme20n1                      |
------------------------------------------------------------

• Run 1: 962.79 MB/s
• Run 2: 912.99 MB/s
• Average: 937.89 MB/s

------------------------------------------------------------
|                      Disk: nvme21n1                      |
------------------------------------------------------------

• Run 1: 966.97 MB/s
• Run 2: 927.15 MB/s
• Average: 947.06 MB/s

------------------------------------------------------------
|                      Disk: nvme22n1                      |
------------------------------------------------------------

• Run 1: 963.79 MB/s
• Run 2: 925.86 MB/s
• Average: 944.83 MB/s

------------------------------------------------------------
|                      Disk: nvme23n1                      |
------------------------------------------------------------

• Run 1: 953.61 MB/s
• Run 2: 910.89 MB/s
• Average: 932.25 MB/s

------------------------------------------------------------
|                      Disk: nvme24n1                      |
------------------------------------------------------------

• Run 1: 1275.22 MB/s
• Run 2: 1755.06 MB/s
• Average: 1515.14 MB/s

############################################################
#                    Benchmark Complete                    #
############################################################

✓ Total benchmark time: 474.69 minutes
Something I noticed was that System 2 had hit 100% CPU utilization during testing but I don’t really think I saw System 1 do that. System 2 idles at about 461 watts and system 1 idles at about 349 watts.
During testing System 2 hit a peak of 753 watts. System 1’s peak was 551.
It’s interesting to see the performance difference. Also no I don’t just run these EPYC systems with TrueNAS all the time lol just wanted to compare the drives for fun and education really.
I’m happy to play around with any type of pool config and rerun for curiosity sake.
Completed the update to v1.11 tonight. In addition to the new UI teased in the v1.10 pre-release, TN-Bench -- An OpenSource Community TrueNAS Benchmarking and Testing Utility - #30 by NickF1227
the other major improvement is to the output file capabilities. Essentially, I am creating a schema for these files in JSON so I can make the results reliably machine-readable. I’d eventually like to get an open-source leaderboard going.
Please note: It currently includes drive serial numbers, which may or may not be something people care about sharing.
oot@m50[~]# cat tn_bench_results.json
{
    "schema_version": "1.0",
    "metadata": {
        "start_timestamp": "2025-08-04T20:34:26.969784",
        "end_timestamp": "2025-08-04T20:50:27.302593",
        "duration_minutes": 16.005546820163726,
        "benchmark_config": {
            "selected_pools": [
                "fire"
            ],
            "disk_benchmark_run": false,
            "zfs_iterations": 2,
            "disk_iterations": 2
        }
    },
    "system": {
        "os_version": "25.04.1",
        "load_average_1m": 25.52880859375,
        "load_average_5m": 27.32177734375,
        "load_average_15m": 30.61474609375,
        "cpu_model": "Intel(R) Xeon(R) Silver 4114 CPU @ 2.20GHz",
        "logical_cores": 40,
        "physical_cores": 20,
        "system_product": "TRUENAS-M50-S",
        "memory_gib": 251.55774307250977
    },
    "pools": [
        {
            "name": "fire",
            "path": "/mnt/fire",
            "status": "ONLINE",
            "vdevs": [
                {
                    "name": "raidz1-0",
                    "type": "RAIDZ1",
                    "disk_count": 4
                }
            ],
            "benchmark": [
                {
                    "threads": 1,
                    "write_speeds": [
                        204.96292932061314,
                        202.3578537857777
                    ],
                    "average_write_speed": 203.66039155319544,
                    "read_speeds": [
                        4863.654197102248,
                        5009.578685975755
                    ],
                    "average_read_speed": 4936.616441539001,
                    "iterations": 2
                },
                {
                    "threads": 10,
                    "write_speeds": [
                        1678.2894846485497,
                        1644.8750263459667
                    ],
                    "average_write_speed": 1661.5822554972583,
                    "read_speeds": [
                        15826.325540856818,
                        15528.846003799119
                    ],
                    "average_read_speed": 15677.58577232797,
                    "iterations": 2
                },
                {
                    "threads": 20,
                    "write_speeds": [
                        2185.8755797678336,
                        2278.5324688746978
                    ],
                    "average_write_speed": 2232.204024321266,
                    "read_speeds": [
                        12733.717138495245,
                        12943.126477744501
                    ],
                    "average_read_speed": 12838.421808119874,
                    "iterations": 2
                },
                {
                    "threads": 40,
                    "write_speeds": [
                        2669.9946736619777,
                        2813.6952230212414
                    ],
                    "average_write_speed": 2741.84494834161,
                    "read_speeds": [
                        12787.97198559776,
                        12562.836734119619
                    ],
                    "average_read_speed": 12675.40435985869,
                    "iterations": 2
                }
            ]
        },
For now, if anyone wants their results stacked up against another set of results, I can probably accomodate.
HI Nick,
Awesome work and thanks for writing this script! Thought I’d run 1.10 in a tmux session on 25.04.2 to try this out. It operated fine until it hit the delete benchmark dataset for pool 2 before quitting on its own. It also never wrote the output file, despite my use of the --output option.
Here are some results from before then, when I was manually watching the session unfold. There are two pools, my main pool redacted to xxx and Alcatraz, a mSATA SSD that I used to use for L2ARC.
There are some wildly different results for individual drives, and I presume these are caused by ARC not being disabled?
#                      TN-Bench v1.10                      #

...
------------------------------------------------------------
|                    System Information                    |
------------------------------------------------------------

Field                 | Value
----------------------+--------------------------------------
Version               | 25.04.2
Load Average (1m)     | 0.3798828125
Load Average (5m)     | 2.18798828125
Load Average (15m)    | 5.1474609375
Model                 | Intel(R) Xeon(R) CPU D-1537 @ 1.70GHz
Cores                 | 16
Physical Cores        | 8
System Product        | Super Server
Physical Memory (GiB) | 125.70

------------------------------------------------------------
|                     Pool Information                     |
------------------------------------------------------------

Field      | Value
-----------+----------------
Name       | xxx
Path       | /mnt/xxx
Status     | ONLINE
VDEV Count | 1
Disk Count | 8

VDEV Name  | Type           | Disk Count
-----------+----------------+---------------
raidz3-0    | RAIDZ3         | 8

------------------------------------------------------------
|                     Disk Information                     |
------------------------------------------------------------

* The TrueNAS API returns N/A for the Pool for boot devices and disks not in a pool.
Field      | Value
-----------+------------------------------
Name       | sdk
Model      | SuperMicro_SSD
Pool       | N/A
Size (GiB) | 59.00
-----------+------------------------------
Name       | sdo
Model      | SuperMicro_SSD
Pool       | N/A
Size (GiB) | 59.00
-----------+------------------------------
Name       | sdn
Model      | Samsung_SSD_860_EVO_mSATA_1TB
Pool       | N/A
Size (GiB) | 931.51
-----------+------------------------------
Name       | nvme0n1
Model      | INTEL SSDPEL1K100GA
Pool       | N/A
Size (GiB) | 93.16
-----------+------------------------------
Name       | sdb
Model      | INTEL_SSDSC2BX016T4
Pool       | N/A
Size (GiB) | 1490.42
-----------+------------------------------
Name       | sdi
Model      | INTEL_SSDSC2BX016T4
Pool       | N/A
Size (GiB) | 1490.42
-----------+------------------------------
Name       | sdm
Model      | HGST_HUH721010ALE600
Serial     | 2THPLLPD
ZFS GUID   | 12542143120419847484
Pool       | xxx
Size (GiB) | 9314.00
-----------+------------------------------
Name       | sdc
Model      | HGST_HUH721010ALE600
Pool       | xxx
Size (GiB) | 9314.00
-----------+------------------------------
Name       | sdd
Model      | INTEL_SSDSC2BX016T4K
Pool       | N/A
Size (GiB) | 1490.42
-----------+------------------------------
Name       | sde
Model      | HGST_HUH721010ALE600
Pool       | xxx
Size (GiB) | 9314.00
-----------+------------------------------
Name       | sdf
Model      | INTEL_SSDSC2BX016T4
Pool       | N/A
Size (GiB) | 1490.42
-----------+------------------------------
Name       | sdh
Model      | HGST_HUH721010ALE600
Pool       | xxx
Size (GiB) | 9314.00
-----------+------------------------------
Name       | sdg
Model      | HGST_HUH721010ALE600
Pool       | xxx
Size (GiB) | 9314.00
-----------+------------------------------
Name       | sdl
Model      | HGST_HUH721010ALE600
Pool       | xxx
Size (GiB) | 9314.00
-----------+------------------------------
Name       | sdj
Model      | HGST_HUH721010ALE604
Pool       | xxx
Size (GiB) | 9314.00
-----------+------------------------------
Name       | sda
Model      | HGST_HUH721010ALE600
Pool       | xxx
Size (GiB) | 9314.00
-----------+------------------------------

...
=
 Space Verification
=

* Available space: 29985.27 GiB
* Space required:  320.00 GiB (20 GiB/thread × 16 threads)
✓ Sufficient space available - proceeding with benchmarks

============================================================
 Testing Pool: xxx - Threads: 1
============================================================

* Running DD write benchmark with 1 threads...
* Run 1 write speed: 216.79 MB/s
* Run 2 write speed: 215.97 MB/s
✓ Average write speed: 216.38 MB/s
* Running DD read benchmark with 1 threads...
* Run 1 read speed: 1578.10 MB/s
* Run 2 read speed: 6416.35 MB/s
✓ Average read speed: 3997.22 MB/s

============================================================
 Testing Pool: xxx - Threads: 4
============================================================

* Running DD write benchmark with 4 threads...
* Run 1 write speed: 697.19 MB/s
* Run 2 write speed: 712.43 MB/s
✓ Average write speed: 704.81 MB/s
* Running DD read benchmark with 4 threads...
* Run 1 read speed: 4123.36 MB/s
* Run 2 read speed: 14158.00 MB/s
✓ Average read speed: 9140.68 MB/s

============================================================
 Testing Pool: xxx - Threads: 8
============================================================

* Running DD write benchmark with 8 threads...
* Run 1 write speed: 762.32 MB/s
* Run 2 write speed: 751.13 MB/s
✓ Average write speed: 756.72 MB/s
* Running DD read benchmark with 8 threads...
* Run 1 read speed: 2798.23 MB/s
* Run 2 read speed: 1702.66 MB/s
✓ Average read speed: 2250.44 MB/s

============================================================
 Testing Pool: xxx - Threads: 16
============================================================

* Running DD write benchmark with 16 threads...
* Run 1 write speed: 732.78 MB/s
* Run 2 write speed: 753.71 MB/s
✓ Average write speed: 743.24 MB/s
* Running DD read benchmark with 16 threads...
* Run 1 read speed: 640.04 MB/s
* Run 2 read speed: 651.73 MB/s
✓ Average read speed: 645.89 MB/s

############################################################
#        DD Benchmark Results for Pool: xxx         #
############################################################


------------------------------------------------------------
|                        Threads: 1                        |
------------------------------------------------------------

• 1M Seq Write Run 1: 216.79 MB/s
• 1M Seq Write Run 2: 215.97 MB/s
• 1M Seq Write Avg: 216.38 MB/s
• 1M Seq Read Run 1: 1578.10 MB/s
• 1M Seq Read Run 2: 6416.35 MB/s
• 1M Seq Read Avg: 3997.22 MB/s

------------------------------------------------------------
|                        Threads: 4                        |
------------------------------------------------------------

• 1M Seq Write Run 1: 697.19 MB/s
• 1M Seq Write Run 2: 712.43 MB/s
• 1M Seq Write Avg: 704.81 MB/s
• 1M Seq Read Run 1: 4123.36 MB/s
• 1M Seq Read Run 2: 14158.00 MB/s
• 1M Seq Read Avg: 9140.68 MB/s

------------------------------------------------------------
|                        Threads: 8                        |
------------------------------------------------------------

• 1M Seq Write Run 1: 762.32 MB/s
• 1M Seq Write Run 2: 751.13 MB/s
• 1M Seq Write Avg: 756.72 MB/s
• 1M Seq Read Run 1: 2798.23 MB/s
• 1M Seq Read Run 2: 1702.66 MB/s
• 1M Seq Read Avg: 2250.44 MB/s

------------------------------------------------------------
|                       Threads: 16                        |
------------------------------------------------------------

• 1M Seq Write Run 1: 732.78 MB/s
• 1M Seq Write Run 2: 753.71 MB/s
• 1M Seq Write Avg: 743.24 MB/s
• 1M Seq Read Run 1: 640.04 MB/s
• 1M Seq Read Run 2: 651.73 MB/s
• 1M Seq Read Avg: 645.89 MB/s
* Cleaning up test files...

############################################################
#                  Testing Pool: Alcatraz                  #
############################################################

* Creating test dataset for pool: Alcatraz
✓ Created temporary dataset: Alcatraz/tn-bench
✓ Dataset Alcatraz/tn-bench created successfully.

============================================================
 Space Verification
============================================================

* Available space: 886.56 GiB
* Space required:  320.00 GiB (20 GiB/thread × 16 threads)
✓ Sufficient space available - proceeding with benchmarks

============================================================
 Testing Pool: Alcatraz - Threads: 1
============================================================

* Running DD write benchmark with 1 threads...
* Run 1 write speed: 222.06 MB/s
* Run 2 write speed: 210.61 MB/s
✓ Average write speed: 216.33 MB/s
* Running DD read benchmark with 1 threads...
* Run 1 read speed: 6849.27 MB/s
* Run 2 read speed: 6338.34 MB/s
✓ Average read speed: 6593.81 MB/s

============================================================
 Testing Pool: Alcatraz - Threads: 4
============================================================

* Running DD write benchmark with 4 threads...
* Run 1 write speed: 128.94 MB/s
* Run 2 write speed: 152.18 MB/s
✓ Average write speed: 140.56 MB/s
* Running DD read benchmark with 4 threads...
* Run 1 read speed: 13990.28 MB/s
* Run 2 read speed: 14299.75 MB/s
✓ Average read speed: 14145.01 MB/s

============================================================
 Testing Pool: Alcatraz - Threads: 8
============================================================

* Running DD write benchmark with 8 threads...
* Run 1 write speed: 196.93 MB/s
* Run 2 write speed: 196.56 MB/s
✓ Average write speed: 196.74 MB/s
* Running DD read benchmark with 8 threads...
* Run 1 read speed: 11215.92 MB/s
* Run 2 read speed: 11188.86 MB/s
✓ Average read speed: 11202.39 MB/s

============================================================
 Testing Pool: Alcatraz - Threads: 16
============================================================

* Running DD write benchmark with 16 threads...
* Run 1 write speed: 176.66 MB/s
* Run 2 write speed: 140.50 MB/s
✓ Average write speed: 158.58 MB/s
* Running DD read benchmark with 16 threads...
* Run 1 read speed: 944.76 MB/s
* Run 2 read speed: 1084.33 MB/s
✓ Average read speed: 1014.54 MB/s

############################################################
#         DD Benchmark Results for Pool: Alcatraz          #
############################################################


------------------------------------------------------------
|                        Threads: 1                        |
------------------------------------------------------------

• 1M Seq Write Run 1: 222.06 MB/s
• 1M Seq Write Run 2: 210.61 MB/s
• 1M Seq Write Avg: 216.33 MB/s
• 1M Seq Read Run 1: 6849.27 MB/s
• 1M Seq Read Run 2: 6338.34 MB/s
• 1M Seq Read Avg: 6593.81 MB/s

------------------------------------------------------------
|                        Threads: 4                        |
------------------------------------------------------------

• 1M Seq Write Run 1: 128.94 MB/s
• 1M Seq Write Run 2: 152.18 MB/s
• 1M Seq Write Avg: 140.56 MB/s
• 1M Seq Read Run 1: 13990.28 MB/s
• 1M Seq Read Run 2: 14299.75 MB/s
• 1M Seq Read Avg: 14145.01 MB/s

------------------------------------------------------------
|                        Threads: 8                        |
------------------------------------------------------------

• 1M Seq Write Run 1: 196.93 MB/s
• 1M Seq Write Run 2: 196.56 MB/s
• 1M Seq Write Avg: 196.74 MB/s
• 1M Seq Read Run 1: 11215.92 MB/s
• 1M Seq Read Run 2: 11188.86 MB/s
• 1M Seq Read Avg: 11202.39 MB/s

------------------------------------------------------------
|                       Threads: 16                        |
------------------------------------------------------------

• 1M Seq Write Run 1: 176.66 MB/s
• 1M Seq Write Run 2: 140.50 MB/s
• 1M Seq Write Avg: 158.58 MB/s
• 1M Seq Read Run 1: 944.76 MB/s
• 1M Seq Read Run 2: 1084.33 MB/s
• 1M Seq Read Avg: 1014.54 MB/s
* Cleaning up test files...

############################################################
#                   Disk Read Benchmark                    #
############################################################

* This benchmark tests the 4K sequential read performance of each disk
* To work around ARC caching, reads data = min(system RAM, disk size)

============================================================
 Testing Disk: sdk
============================================================

* Testing disk: sdk
* Run 1: 259.09 MB/s
* Testing disk: sdk
* Run 2: 1565.08 MB/s
✓ Average: 912.08 MB/s

============================================================
 Testing Disk: sdo
============================================================

* Testing disk: sdo
* Run 1: 258.47 MB/s
* Testing disk: sdo
* Run 2: 256.39 MB/s
✓ Average: 257.43 MB/s

============================================================
 Testing Disk: sdn
============================================================

* Testing disk: sdn
* Run 1: 439.93 MB/s
* Testing disk: sdn
* Run 2: 445.94 MB/s
✓ Average: 442.94 MB/s

============================================================
 Testing Disk: nvme0n1
============================================================

* Testing disk: nvme0n1
* Run 1: 1389.19 MB/s
* Testing disk: nvme0n1
* Run 2: 1320.39 MB/s
✓ Average: 1354.79 MB/s

============================================================
 Testing Disk: sdb
============================================================

* Testing disk: sdb
* Run 1: 501.87 MB/s
* Testing disk: sdb
* Run 2: 518.68 MB/s
✓ Average: 510.28 MB/s

============================================================
 Testing Disk: sdi
============================================================

* Testing disk: sdi
* Run 1: 517.98 MB/s
* Testing disk: sdi
* Run 2: 518.09 MB/s
✓ Average: 518.04 MB/s

============================================================
 Testing Disk: sdm
============================================================

* Testing disk: sdm
* Run 1: 241.95 MB/s
* Testing disk: sdm
* Run 2: 242.87 MB/s
✓ Average: 242.41 MB/s

============================================================
 Testing Disk: sdc
============================================================

* Testing disk: sdc
Hey man. @Constantin
-
So you ran the test, it finished, it asked you to delete the dataset and then it crashed?
I know it may be possible for the dataset to be not deleted because it is busy for one reason or another. Someone already opened a GitHub issue for that, but i’ve never seen the behavior you are describing exactly if thats what you are saying. I’ll have to investigate. -
sdk,sdo,sdmare all around the same andsdi,sdb,sdnare all about the same. This probably means thatINTEL_SSDSC2BX016T4andSamsung_SSD_860_EVO_mSATA_1TBare just faster thanSuperMicro_SSD and HGST_HUH721010ALE600which would make sense.
This was useful to stress test, thanks. All 32 cores were >80% during the 12 and 24 thread dd reads. I’ve never played around too much with benchmarking tools. After I migrate to this new system, I’ll run the benchmark tool on my old system that is a 3 2-way mirrors stripped (I’m not sure the best way to say this tbh, but it is 3 2-way mirrors stripped) of spinning disks with a SLOG.
I had a USB drive from the install still inserted, so it was tested too, which I find amusing.
NVMe NAS
############################################################
TN-Bench v1.11
############################################################
TN-Bench is an OpenSource Software Script that uses standard tools to
Benchmark your System and collect various statistical information via
the TrueNAS API.
- TN-Bench will create a Dataset in each of your pools for testing purposes
- that will consume 20 GiB of space for every thread in your system.
! WARNING: This test will make your system EXTREMELY slow during its run.
! WARNING: It is recommended to run this test when no other workloads are running.
- ZFS ARC will impact your results. You can set zfs_arc_max to 1 to prevent ARC caching.
- Setting it back to 0 restores default behavior but requires a system restart.
============================================================
Confirmation
Would you like to continue? (yes/no): yes
| System Information |
|---|
Field | Value
----------------------±--------------------------------
Version | 25.04.2
Load Average (1m) | 0.02294921875
Load Average (5m) | 0.046875
Load Average (15m) | 0.01318359375
Model | AMD EPYC 4464P 12-Core Processor
Cores | 24
Physical Cores | 12
System Product | B650D4U3-2L2Q/BCM
Physical Memory (GiB) | 124.92
| Pool Information |
|---|
Field | Value
-----------±--------------
Name | tardis_z2
Path | /mnt/tardis_z2
Status | ONLINE
VDEV Count | 1
Disk Count | 5
VDEV Name | Type | Disk Count
-----------±---------------±--------------
raidz1-0 | RAIDZ1 | 5
| Disk Information |
|---|
- The TrueNAS API returns N/A for the Pool for boot devices and disks not in a pool.
Field | Value
-----------±------------------------------------------------------------------------------------------------------------------------
Name | sdc
Model | SanDisk_3.2Gen1
Serial | 0401da43e2ed1e4d5b82c7923064fcadb3ccce3b422735edf70c5b3c4c09ee8daae1000000000000000000001e732ed0ff9462188155810768aaf42a
ZFS GUID | None
Pool | N/A
Size (GiB) | 28.64
-----------±------------------------------------------------------------------------------------------------------------------------
Name | sda
Model | Patriot_P210_256GB
Serial | P210MIBB250407003136
ZFS GUID | None
Pool | N/A
Size (GiB) | 238.47
-----------±------------------------------------------------------------------------------------------------------------------------
Name | sdb
Model | Patriot_P210_256GB
Serial | P210MIBB250407003024
ZFS GUID | None
Pool | N/A
Size (GiB) | 238.47
-----------±------------------------------------------------------------------------------------------------------------------------
Name | nvme3n1
Model | Samsung SSD 990 PRO with Heatsink 4TB
Serial | S7DSNJ0Y402910R
ZFS GUID | 747736133115953849
Pool | tardis_z2
Size (GiB) | 3726.02
-----------±------------------------------------------------------------------------------------------------------------------------
Name | nvme1n1
Model | Samsung SSD 990 PRO 4TB
Serial | S7KGNJ0Y602169B
ZFS GUID | 17894769789241912266
Pool | tardis_z2
Size (GiB) | 3726.02
-----------±------------------------------------------------------------------------------------------------------------------------
Name | nvme0n1
Model | Samsung SSD 990 PRO 4TB
Serial | S7KGNJ0Y602255A
ZFS GUID | 17412625518204936695
Pool | tardis_z2
Size (GiB) | 3726.02
-----------±------------------------------------------------------------------------------------------------------------------------
Name | nvme2n1
Model | Samsung SSD 990 PRO 4TB
Serial | S7KGNJ0Y602238M
ZFS GUID | 8622360930852436874
Pool | tardis_z2
Size (GiB) | 3726.02
-----------±------------------------------------------------------------------------------------------------------------------------
Name | nvme4n1
Model | Samsung SSD 990 PRO 4TB
Serial | S7KGNJ0Y602184R
ZFS GUID | 14336767869761954501
Pool | tardis_z2
Size (GiB) | 3726.02
-----------±------------------------------------------------------------------------------------------------------------------------
############################################################
Pool Selection
############################################################
- Available pools:
• 1. tardis_z2 - Options:
• 1. Enter specific pool numbers (comma separated)
• 2. Type ‘all’ to test all pools
• 3. Type ‘none’ to skip pool testing
Enter your choice [all]: 1
############################################################
ZFS Pool Benchmark Iterations
############################################################
- How many times should we run each test?
• 1. Run each test once (faster)
• 2. Run each test twice (default, more accurate)
Enter iteration count (1 or 2) [2]:
############################################################
Individual Disk Benchmark
############################################################
Run individual disk read benchmark? (yes/no) [yes]:
############################################################
Individual Disk Benchmark Iterations
############################################################
- How many times should we run each test?
• 1. Run each test once (faster)
• 2. Run each test twice (default, more accurate)
Enter iteration count (1 or 2) [2]:
############################################################
DD Benchmark Starting
############################################################
- Using 24 threads for the benchmark.
- ZFS tests will run 2 time(s) per configuration
- Disk tests will run 2 time(s) per disk
############################################################
Testing Pool: tardis_z2
############################################################
- Creating test dataset for pool: tardis_z2
✓ Dataset tardis_z2/tn-bench created successfully.
============================================================
Space Verification
- Available space: 14736.59 GiB
- Space required: 480.00 GiB (20 GiB/thread × 24 threads)
✓ Sufficient space available - proceeding with benchmarks
============================================================
Testing Pool: tardis_z2 - Threads: 1
- Running DD write benchmark with 1 threads…
- Run 1 write speed: 588.48 MB/s
- Run 2 write speed: 591.28 MB/s
✓ Average write speed: 589.88 MB/s - Running DD read benchmark with 1 threads…
- Run 1 read speed: 22435.67 MB/s
- Run 2 read speed: 22534.48 MB/s
✓ Average read speed: 22485.08 MB/s
============================================================
Testing Pool: tardis_z2 - Threads: 6
- Running DD write benchmark with 6 threads…
- Run 1 write speed: 2680.72 MB/s
- Run 2 write speed: 2677.85 MB/s
✓ Average write speed: 2679.28 MB/s - Running DD read benchmark with 6 threads…
- Run 1 read speed: 27927.82 MB/s
- Run 2 read speed: 27966.54 MB/s
✓ Average read speed: 27947.18 MB/s
============================================================
Testing Pool: tardis_z2 - Threads: 12
- Running DD write benchmark with 12 threads…
- Run 1 write speed: 4018.84 MB/s
- Run 2 write speed: 4015.50 MB/s
✓ Average write speed: 4017.17 MB/s - Running DD read benchmark with 12 threads…
- Run 1 read speed: 17475.28 MB/s
- Run 2 read speed: 21265.96 MB/s
✓ Average read speed: 19370.62 MB/s
============================================================
Testing Pool: tardis_z2 - Threads: 24
- Running DD write benchmark with 24 threads…
- Run 1 write speed: 4427.91 MB/s
- Run 2 write speed: 4425.37 MB/s
✓ Average write speed: 4426.64 MB/s - Running DD read benchmark with 24 threads…
- Run 1 read speed: 17218.26 MB/s
- Run 2 read speed: 17289.90 MB/s
✓ Average read speed: 17254.08 MB/s
############################################################
DD Benchmark Results for Pool: tardis_z2
############################################################
| Threads: 1 |
|---|
• 1M Seq Write Run 1: 588.48 MB/s
• 1M Seq Write Run 2: 591.28 MB/s
• 1M Seq Write Avg: 589.88 MB/s
• 1M Seq Read Run 1: 22435.67 MB/s
• 1M Seq Read Run 2: 22534.48 MB/s
• 1M Seq Read Avg: 22485.08 MB/s
| Threads: 6 |
|---|
• 1M Seq Write Run 1: 2680.72 MB/s
• 1M Seq Write Run 2: 2677.85 MB/s
• 1M Seq Write Avg: 2679.28 MB/s
• 1M Seq Read Run 1: 27927.82 MB/s
• 1M Seq Read Run 2: 27966.54 MB/s
• 1M Seq Read Avg: 27947.18 MB/s
| Threads: 12 |
|---|
• 1M Seq Write Run 1: 4018.84 MB/s
• 1M Seq Write Run 2: 4015.50 MB/s
• 1M Seq Write Avg: 4017.17 MB/s
• 1M Seq Read Run 1: 17475.28 MB/s
• 1M Seq Read Run 2: 21265.96 MB/s
• 1M Seq Read Avg: 19370.62 MB/s
| Threads: 24 |
|---|
• 1M Seq Write Run 1: 4427.91 MB/s
• 1M Seq Write Run 2: 4425.37 MB/s
• 1M Seq Write Avg: 4426.64 MB/s
• 1M Seq Read Run 1: 17218.26 MB/s
• 1M Seq Read Run 2: 17289.90 MB/s
• 1M Seq Read Avg: 17254.08 MB/s
- Cleaning up test files…
############################################################
Disk Read Benchmark
############################################################
- This benchmark tests the 4K sequential read performance of each disk
- To work around ARC caching, reads data = min(system RAM, disk size)
============================================================
Testing Disk: sdc
- Testing disk: sdc
- Run 1: 143.88 MB/s
- Testing disk: sdc
- Run 2: 143.69 MB/s
✓ Average: 143.79 MB/s
============================================================
Testing Disk: sda
- Testing disk: sda
- Run 1: 459.84 MB/s
- Testing disk: sda
- Run 2: 459.15 MB/s
✓ Average: 459.49 MB/s
============================================================
Testing Disk: sdb
- Testing disk: sdb
- Run 1: 460.39 MB/s
- Testing disk: sdb
- Run 2: 459.79 MB/s
✓ Average: 460.09 MB/s
============================================================
Testing Disk: nvme3n1
- Testing disk: nvme3n1
- Run 1: 2932.54 MB/s
- Testing disk: nvme3n1
- Run 2: 2685.28 MB/s
✓ Average: 2808.91 MB/s
============================================================
Testing Disk: nvme1n1
- Testing disk: nvme1n1
- Run 1: 2925.18 MB/s
- Testing disk: nvme1n1
- Run 2: 2695.59 MB/s
✓ Average: 2810.39 MB/s
============================================================
Testing Disk: nvme0n1
- Testing disk: nvme0n1
- Run 1: 2983.47 MB/s
- Testing disk: nvme0n1
- Run 2: 2698.64 MB/s
✓ Average: 2841.06 MB/s
============================================================
Testing Disk: nvme2n1
- Testing disk: nvme2n1
- Run 1: 2955.51 MB/s
- Testing disk: nvme2n1
- Run 2: 2695.72 MB/s
✓ Average: 2825.62 MB/s
============================================================
Testing Disk: nvme4n1
- Testing disk: nvme4n1
- Run 1: 2940.69 MB/s
- Testing disk: nvme4n1
- Run 2: 2698.49 MB/s
✓ Average: 2819.59 MB/s
############################################################
Disk Read Benchmark Results
############################################################
| Disk: sdc |
|---|
• Run 1: 143.88 MB/s
• Run 2: 143.69 MB/s
• Average: 143.79 MB/s
| Disk: sda |
|---|
• Run 1: 459.84 MB/s
• Run 2: 459.15 MB/s
• Average: 459.49 MB/s
| Disk: sdb |
|---|
• Run 1: 460.39 MB/s
• Run 2: 459.79 MB/s
• Average: 460.09 MB/s
| Disk: nvme3n1 |
|---|
• Run 1: 2932.54 MB/s
• Run 2: 2685.28 MB/s
• Average: 2808.91 MB/s
| Disk: nvme1n1 |
|---|
• Run 1: 2925.18 MB/s
• Run 2: 2695.59 MB/s
• Average: 2810.39 MB/s
| Disk: nvme0n1 |
|---|
• Run 1: 2983.47 MB/s
• Run 2: 2698.64 MB/s
• Average: 2841.06 MB/s
| Disk: nvme2n1 |
|---|
• Run 1: 2955.51 MB/s
• Run 2: 2695.72 MB/s
• Average: 2825.62 MB/s
| Disk: nvme4n1 |
|---|
• Run 1: 2940.69 MB/s
• Run 2: 2698.49 MB/s
• Average: 2819.59 MB/s
############################################################
Benchmark Complete
############################################################
✓ Total benchmark time: 38.81 minutes
Delete testing dataset tardis_z2/tn-bench? (yes/no): yes
- Deleting dataset: tardis_z2/tn-bench
✓ Dataset tardis_z2/tn-bench deleted.
✓ Benchmark results saved to: /root/TN-Bench/tn_bench_results.json
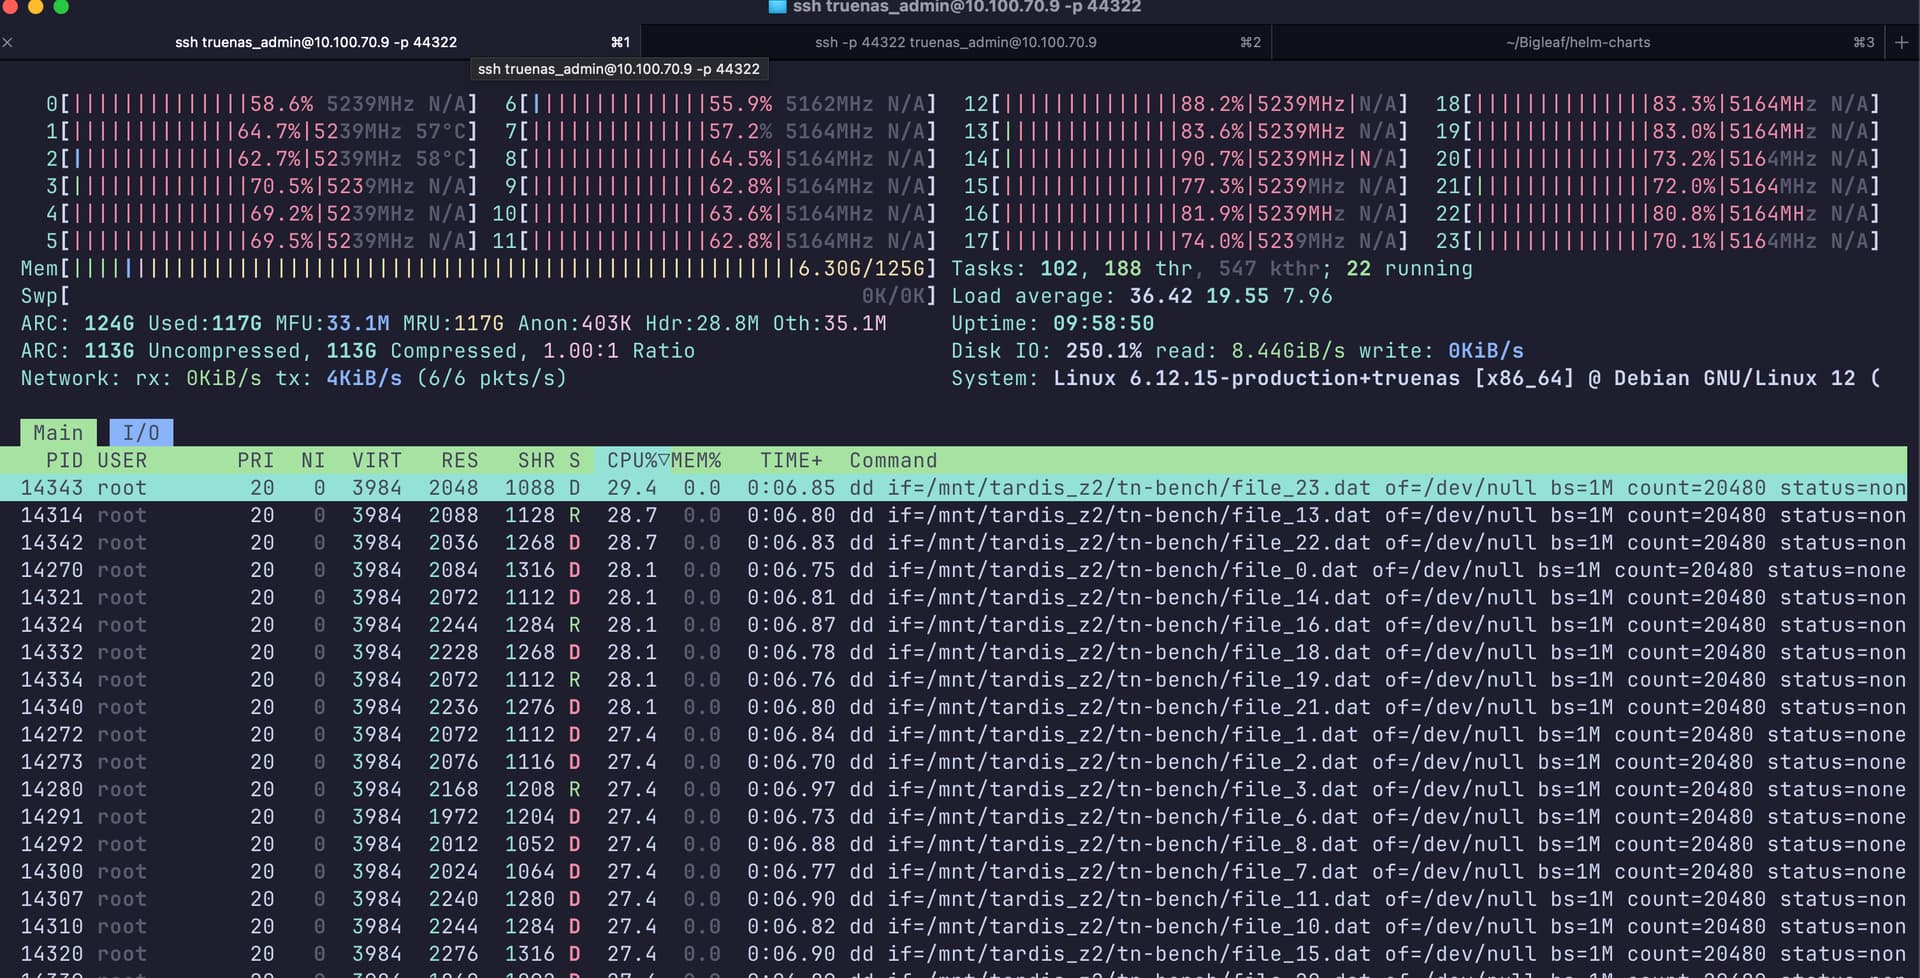
1 Like
I will try to give yoh a more coherent answer when I have a moment. But basically it went plonk with a middleware error before it could finish Alcatraz, my msata pool. I didnt write down the error, of course, since I’m a dummy.
I rerun the script with tmux and hopefully it will fail in the same spot again. However, if it’s not too much trouble, could the output file actually get generated as the script progresses vs. only at the end? That way, if the script fails, it’ll at least leave the admin with some idea where it failed and what it was able to collect in the meantime.
Also, the result inconsistency refers to some I/o being super quick on round 2, which suggests that arc issue you mention in the documentation. I’ll try to do a better job the next time but the timeout is what it is. Waiting for it to finish without losing the session is pretty difficult.
You can run the script inside of tmux if you are having session instability because of WiFi or something.
Yup. That’s what did after the first or second disconnect. Let me try that again.
OK, started by echo 1 > into the zfs arc max parameter, then restarted the script in a tmux session and going to bed. You might want to include the exact CLI command in the script so people can more easily execute it?
OK, just a quick update of an example I mentioned:
* Running DD read benchmark with 1 threads...
* Run 1 read speed: 1233.52 MB/s
* Run 2 read speed: 6375.58 MB/s
✓ Average read speed: 3804.55 MB/s
This is with the ARC set to 1 as discussed in the script. This delta re: read speeds should not be possible even if the average of 1 thread is pretty similar to the more consistent outputs with 4 threads.
I will look at this for sure but I’m not sure that the test actually means anything here
print_info("ZFS ARC will impact your results. You can set zfs_arc_max to 1 to prevent ARC caching.")
print_info("Setting it back to 0 restores default behavior but requires a system restart.")
Okay so this is my bad for not being clear in my messaging. Sorry sir.
I should rephrase this print statement to be more clear. I don’t actually recommend running in that configuration, that particular tunable is a size (in bytes iirc) and settting it to 1 doesn’t actually disable ARC it just practically does.
Its a cheesy hack snd setting this to a very low value like 1 might not be a great idea…this is just for benchmarking ![]()
Setting it that low may result in unpredictable behavior and I’d not even considered that when I’d written the print statement. I might do some testing in this area when I have some time, but for now probably don’t do 1.
Particularly in your case your system is in production already, and experimenting with these sorts of ZFS tunables is only advisable if you don’t have data you care about in your pools.
As an aside: I would generally advocate testing with default ARC behavior, since that’s what you’d typically run in production and also that’s where the vast majority of the user base is.
According to the docs, it can’t be below 64MB (because 64MB ought to be enough for anybody). Moreover, they state:
It cannot be set back to 0 while running and reducing it below the current ARC size will not cause the ARC to shrink without memory pressure to induce shrinking.
I didn’t use your tool and didn’t pay enough attention to the whole discussion, but why not just go with something like zfs set primarycache=none <pool-name>/<test-dataset>?