Reran the tests last night and this time it exited nicely, complete with a functioning output file. Do you want me to send it to you, Nick?
One of the things to consider for future editions is whether UUIDs, system names, etc. should be omitted, especially if this is to become a effort where more people participate. The current output file is a very verbose setting, you may consider creating a second output file option without the benefit / complexity of json that only lists the essentials.
According to the docs, it can’t be below 64MB (because 64MB ought to be enough for anybody). Moreover, they state:
It cannot be set back to 0 while running and reducing it below the current ARC size will not cause the ARC to shrink without memory pressure to induce shrinking.
The above is why my doc indicates you need to restart after setting it back to 0.
Up to you, is there a question you have about the result?
Yes, and this is an interesting topic. I have thought about this alot, and I have not yet decided on the exact direction.
For now:
The standard output in the terminal window is designed to be human readable and easily parsed as the script runs. The output is very verbose intentially, because things tend to break more often on a system with hardware problems when under load
Generating a results file mid-stream may not be possible, since I am doing math on the backend. I would prefer not generating incomplete output files, but for debugging purposes I can consider.
I’d imagine folks like @mattheja will continue using this script to burn-in test, and I intend on adding the ability to loop, forever.
The JSON output is designed to be very verbose and it’s meant for machine-readability. I have considered what you are saying re “PII” like UUIDs or hostnames.
IMO, ZFS UUIDs are globally unique and there’s no real security concern with sharing them. Hostnames/Serial numbers may be a differant story, and I have considered ommitting them.
However, I’d like to eventually build an “Open-Source Leaderboard Database Website” and I might want to use these values as “keys” even though I don’t intend on presenting them.
I think a “tuple” of a few keys could be a “TN-Bench” “GUID”. This way you can look through your own benchmark history for your system in the website.
I’m not sure yet, I just want to have the tools on the script side I’d need to make a compare systems page like 3DMark or PassMark. The JSON generated is owned by the user and it’s their right to share or not.
It’s still running for me, but something that’s striking is the abysmal write performance of my NVMe SSD pool. It’s a mirrored pair of Samsung SSD 990 EVO 2TB drives, and here’s what I’m seeing:
============================================================
 Space Verification
============================================================

* Available space: 1464.88 GiB
* Space required:  1120.00 GiB (20 GiB/thread × 56 threads)
✓ Sufficient space available - proceeding with benchmarks

============================================================
 Testing Pool: software - Threads: 1
============================================================

* Running DD write benchmark with 1 threads...
* Run 1 write speed: 313.32 MB/s
* Run 2 write speed: 310.43 MB/s
✓ Average write speed: 311.87 MB/s
* Running DD read benchmark with 1 threads...
* Run 1 read speed: 6146.37 MB/s
* Run 2 read speed: 5572.58 MB/s
✓ Average read speed: 5859.48 MB/s

============================================================
 Testing Pool: software - Threads: 14
============================================================

* Running DD write benchmark with 14 threads...
* Run 1 write speed: 237.03 MB/s
* Run 2 write speed: 277.38 MB/s
✓ Average write speed: 257.20 MB/s
* Running DD read benchmark with 14 threads...
* Run 1 read speed: 7019.43 MB/s
* Run 2 read speed: 8422.22 MB/s
✓ Average read speed: 7720.82 MB/s
These are in the two NVMe slots on my motherboard. I don’t have much experience with NVMe devices, but this seems off to me.
System configuration is in the .sig, but it’s 2x Xeon Gold 6132s, 128 GB RAM, in a SuperMicro X11DPH-T.
I don’t have access to one of these drives, but I do have some older Samsung and other M.2s I can test. I can see where they land for the lulz.
I suspect we’ll find that consumer-y M.2 drives, and EVO (TLC) and QLC drives in particular will probably show pretty poor results in this test. You’re writing 1120.00 GiB to disk all at once, or roughly half a “drive write” in your case.
This should more than saturate any caches on the drive itself, and was an intentional design decision for the benchmark itself. Worst case scenario very busy system.
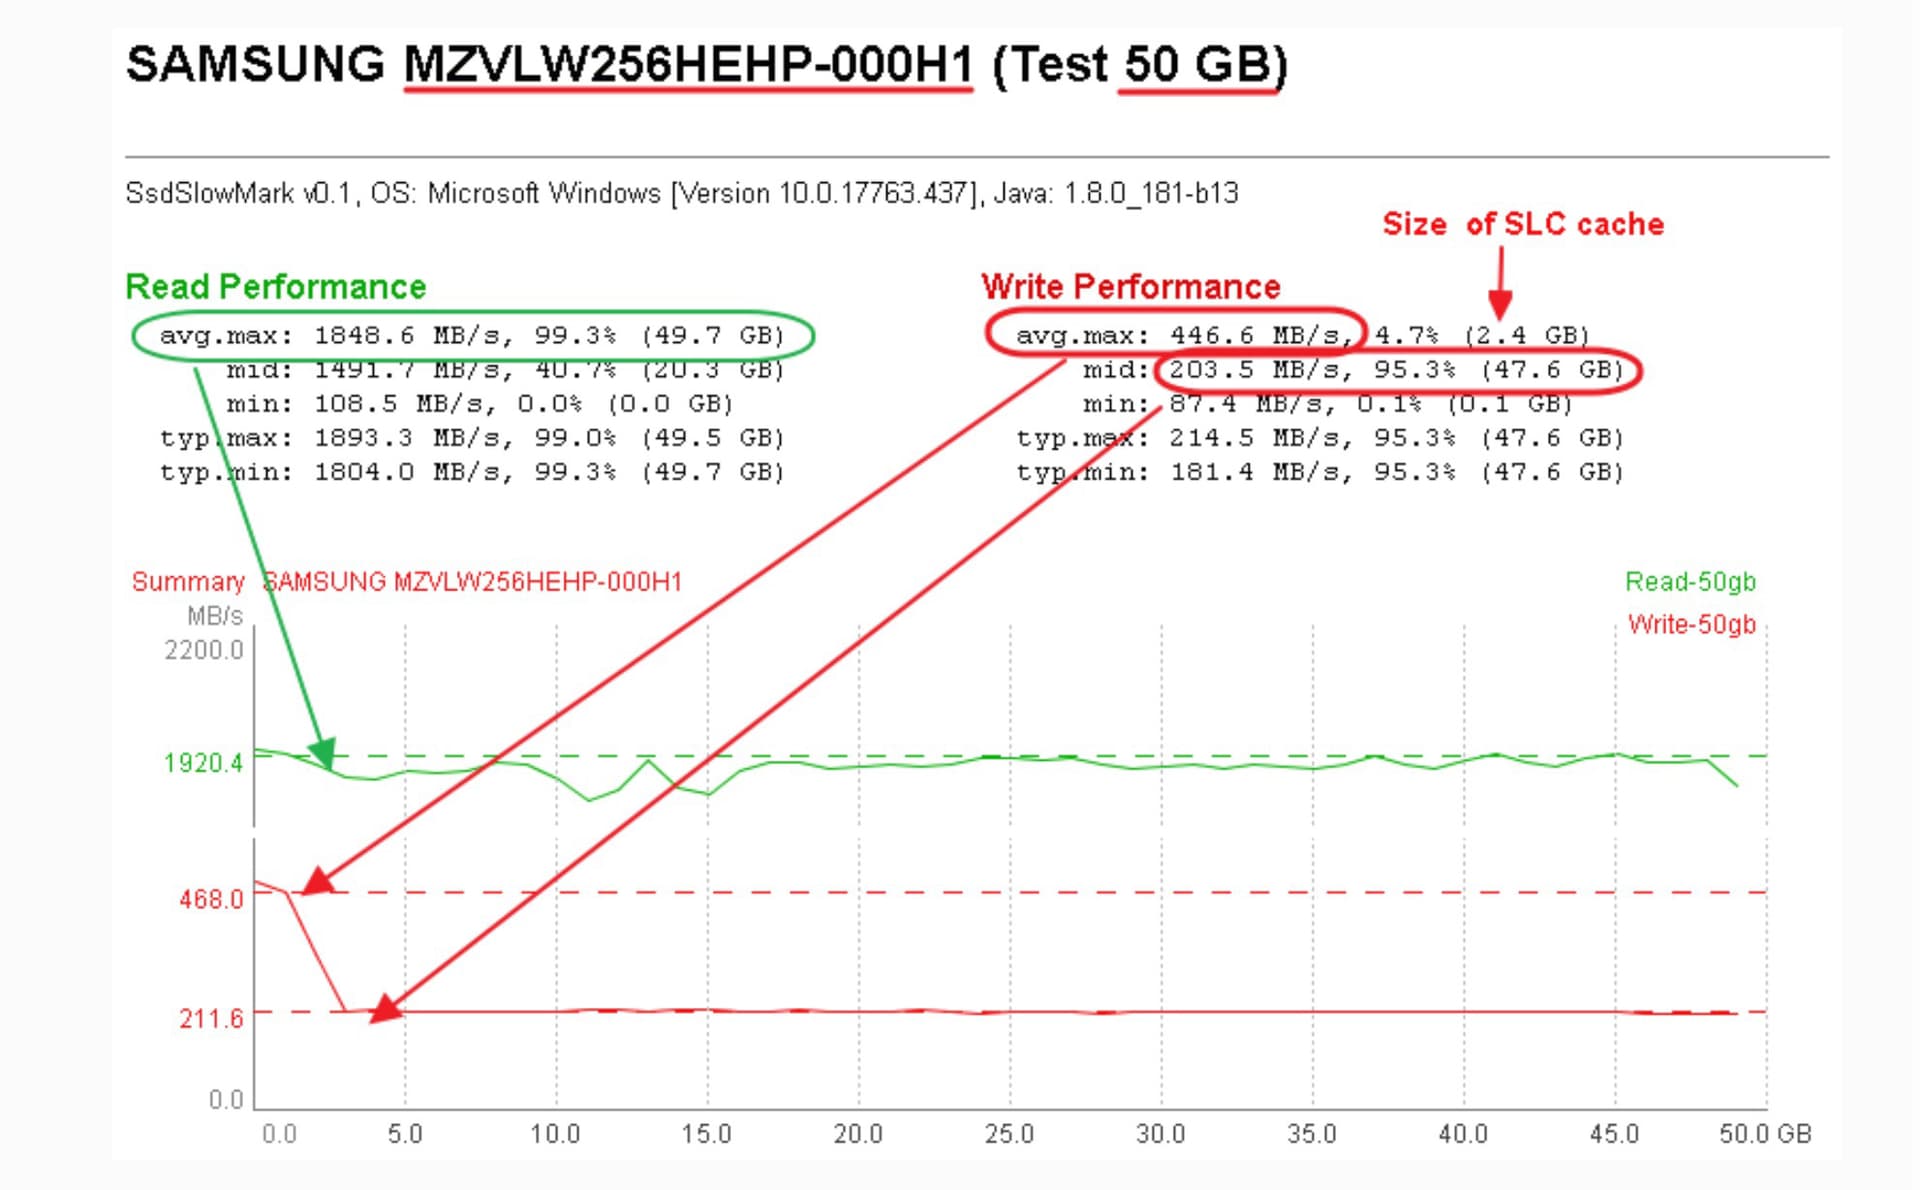
The drive firmware/controller will buffer some of the writes issued
“L1” DRAM (and there are plenty of M.2s without ANY DRAM),
“L2” some of these writes in “SLC” cache
and then the rest is flushed off to whatever multiple MLC/TLC/QLC is on the stick.
These cache’s tend to not be very big. I’ve not used this particular software, but his graphic here is perfect, so credit where credit is due. https://tools4free.github.io/ssd-slow-mark/
I’ll try to get some more data for you dan, but this may be expected behavior.
You are also “downclocking” PCI-E 5 drives to a PCI-E 3 bus. So that’s an interesting variable to test as well. I can probably spin up TrueNAS on my gaming desktop some day, but don’t have any PCI-E 5 drives right now.
I’m more than a little surprised that write performance is worse that a pair of mirrored spinners. Writes slower than reads don’t surprise me a lot, but they’re a lot slower.
According to the product page, they’re Gen5x2, or Gen4x4. I’m not sure how that plays out here.
The short answer is, I think we’re writing more to the drive than its cache can handle. And when you only have a single (can you confirm if yours has 1 or 2?) TLC NAND package on an M.2 stick…I can absolutely see how it can perform worse than a hard drive. I’ve had some dog slow writing SSDs over the years.
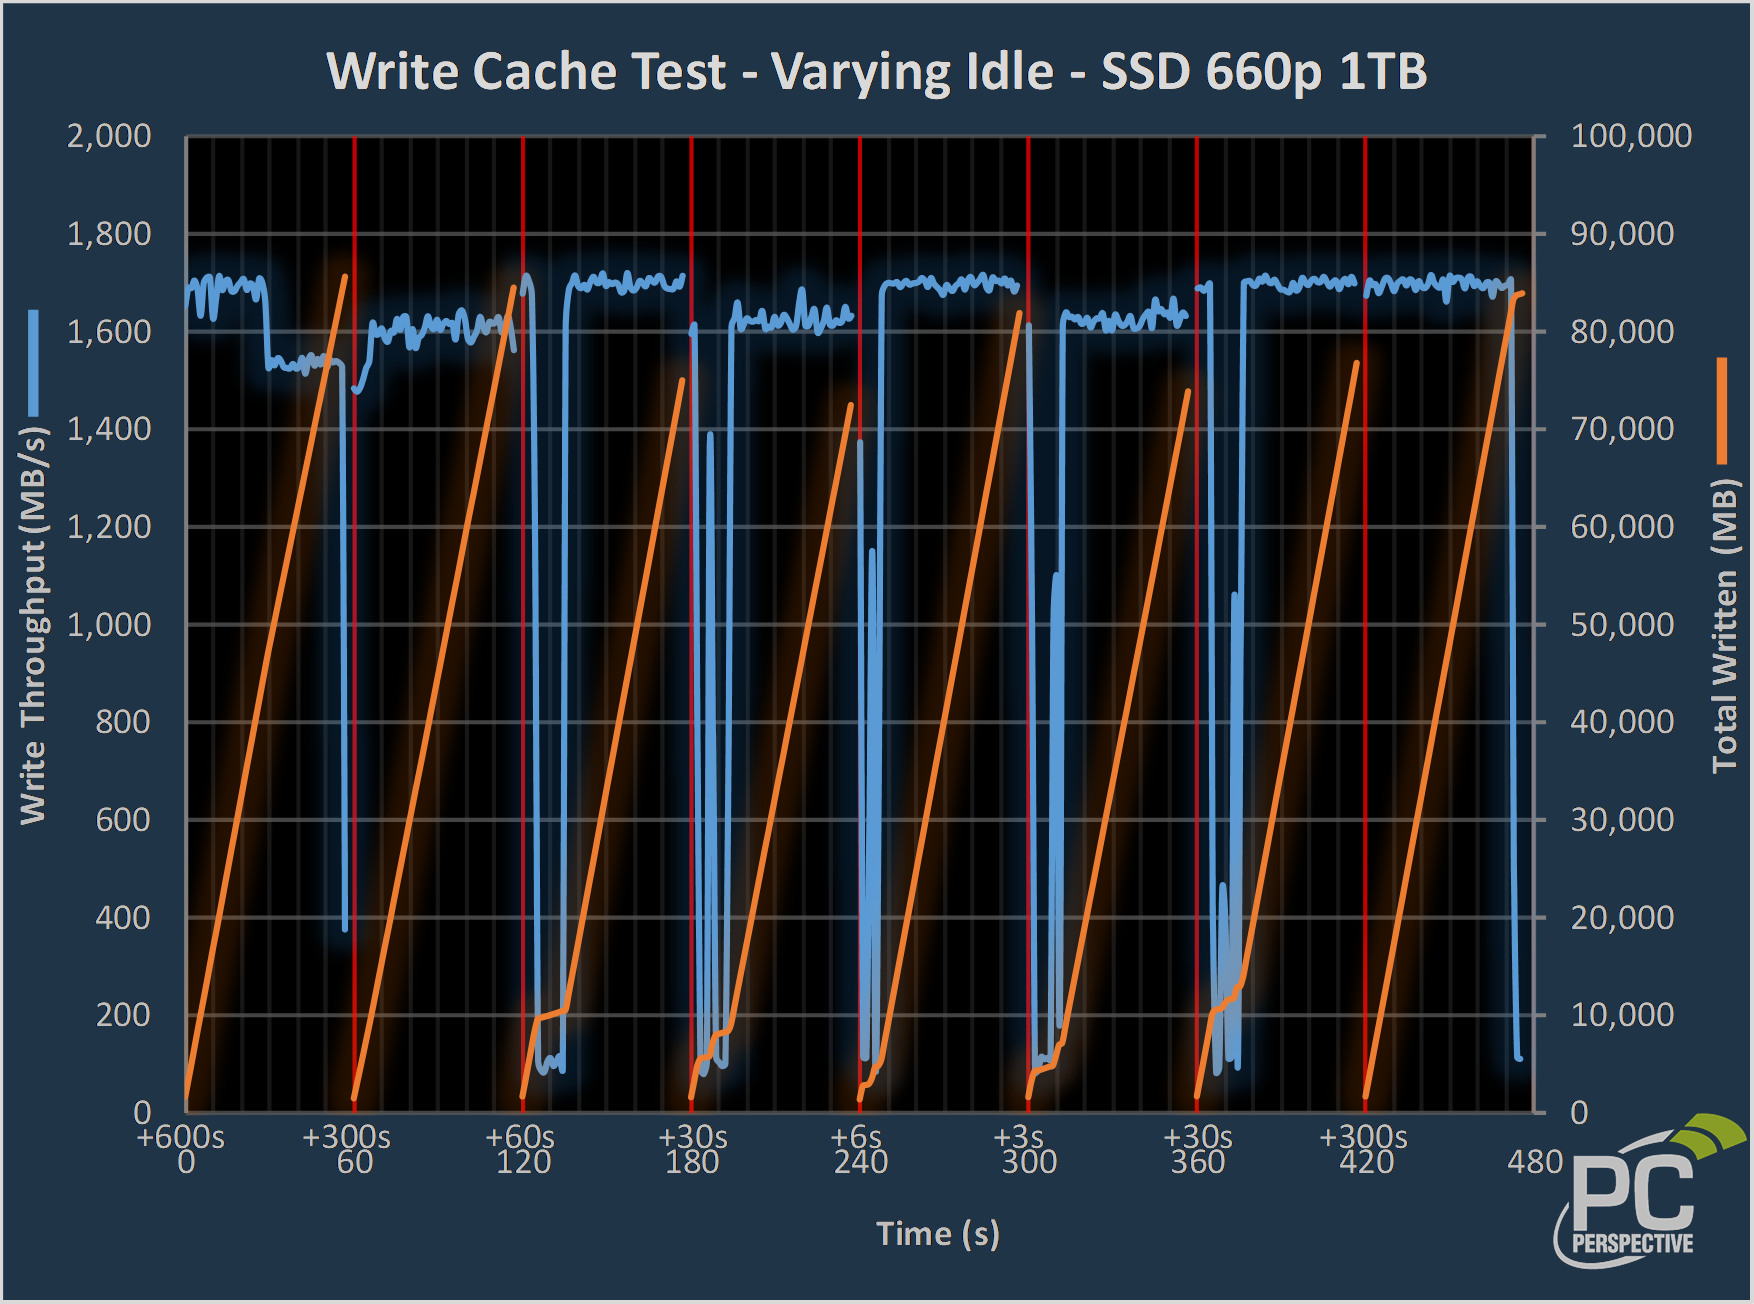
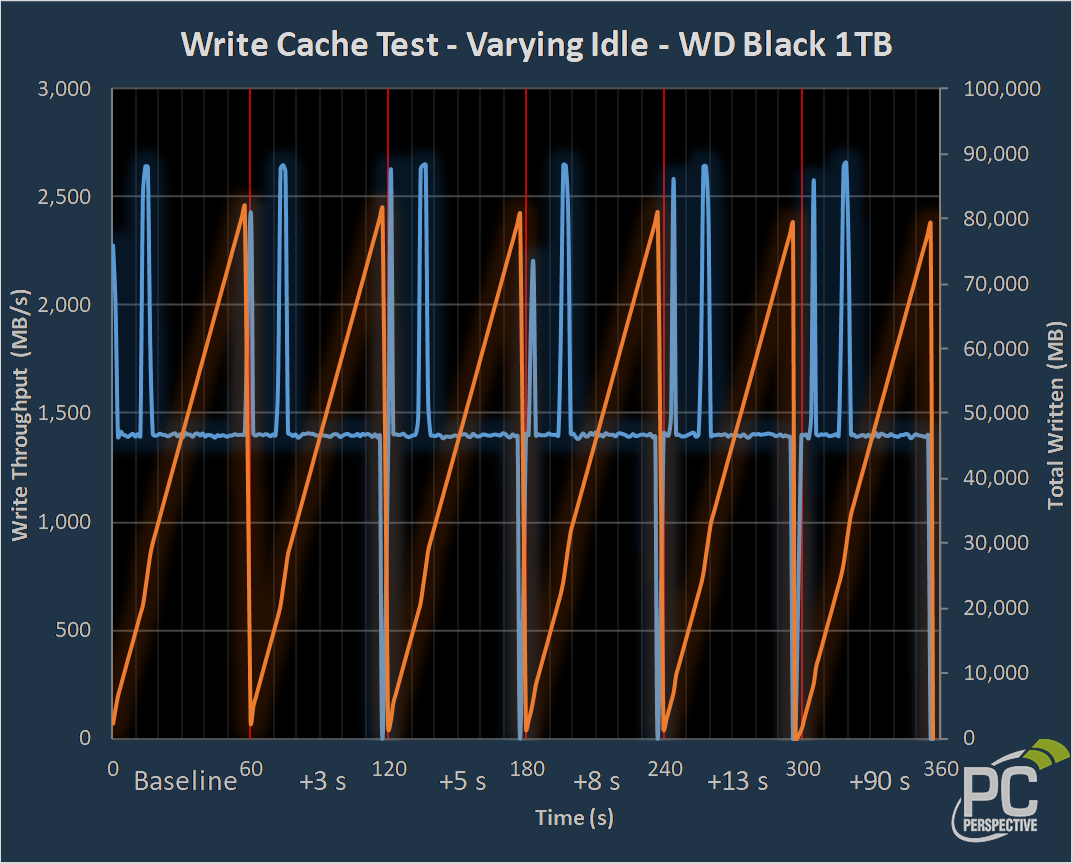
Alot of my understanding of how SSDs work is credited to the work Allyn Malvantno did over at PCPer in the latter half of the past decade.
First some definitions for the thread
NAND Type
Bits per Cell
Voltage States per Cell
SLC
1
2
MLC
2
4
TLC
3
8
QLC
4
16
This is a perfect example of what I am describing. Although a little old, it’s points still exist in more modern SSDs.
Maybe someday I’ll get this level of granularity with TN-Bench.
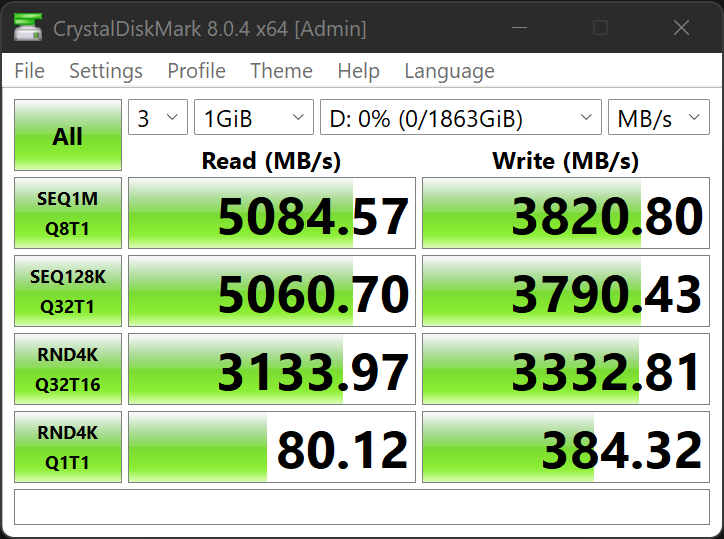
EDIT: Also @dan interestingly, the CrystalDiskMark RND4KQ1T1 Benchmark result is right around where TN Bench is. It may be an interesting coicidence or maybe actually interesting.
Since ZFS is actually issuing 4K writes to these drives (ashift=12), this may actually be a cheeky way to figure out what ZFS write performance as measured by TN-Bench’s method might look like when shopping for drives. The way Crystal is doing what they are doing must be a similar enough method to get a roughly analogous number. For no other reason than everyone tests CrystalDiskMark for some reason.
It’s not a perfect analogy though.
Because we’re doing the dd 1M at a time here, we’re basically floored in the accelerator and I’m not sure what crystal is doing.
I think the reason your result in TN-Bench is worse than that result in Crystal is a combination of running in Gen3 mode and caching behaviors. It’s something weird at a hardware level.
That’s only when using all 56 threads, right? Using a single thread, it’s only 20 GiB, and even there it only averages 312 MB/sec. Yeah, it’s worse with 14 threads, but it doesn’t have to get to the large writes to have a problem–and it sounds like it’s a caching issue. Interesting.
I have data on this system so I can’t break up this pool to test a mirror right now.
root@notprod[~]# zpool status fire
  pool: fire
 state: ONLINE
  scan: scrub repaired 0B in 00:21:55 with 0 errors on Wed Aug  6 00:21:59 2025
config:

	NAME                                      STATE     READ WRITE CKSUM
	fire                                      ONLINE       0     0     0
	  raidz1-0                                ONLINE       0     0     0
	    3388ac6e-cab2-44db-9263-fa2ba74533d6  ONLINE       0     0     0
	    d202b781-89b4-4a71-ae7a-c60f2ea42107  ONLINE       0     0     0
	    de403cf3-6f47-4fc4-8eb4-3c0b91aa76e7  ONLINE       0     0     0
	    1e922cd8-ba0e-4c36-b317-a8dd6ecb52eb  ONLINE       0     0     0
tn-bench on a Dual Socket Xeon Silver 4114 System
-----------+---------------------------
Name       | nvme0n1
Model      | INTEL SSDPE2KE016T8
Serial     | PHLN013100MD1P6AGN
ZFS GUID   | 17475493647287877073
Pool       | fire
Size (GiB) | 1400.00
-----------+---------------------------
Name       | nvme1n1
Model      | INTEL SSDPE2KE016T8
Serial     | PHLN931600FE1P6AGN
ZFS GUID   | 11275382002255862348
Pool       | fire
Size (GiB) | 1400.00
-----------+---------------------------
Name       | nvme2n1
Model      | SAMSUNG MZWLL1T6HEHP-00003
Serial     | S3HDNX0KB01220
ZFS GUID   | 4368323531340162613
Pool       | fire
Size (GiB) | 1399.22
-----------+---------------------------
Name       | nvme3n1
Model      | SAMSUNG MZWLL1T6HEHP-00003
Serial     | S3HDNX0KB01248
ZFS GUID   | 3818548647571812337
Pool       | fire
Size (GiB) | 1399.22
-----------+---------------------------
============================================================
 Testing Pool: ice - Threads: 1
============================================================

* Running DD write benchmark with 1 threads...
* Run 1 write speed: 233.13 MB/s
* Run 2 write speed: 232.29 MB/s
✓ Average write speed: 232.71 MB/s
* Running DD read benchmark with 1 threads...
* Run 1 read speed: 5878.96 MB/s
* Run 2 read speed: 5701.97 MB/s
✓ Average read speed: 5790.47 MB/s

============================================================
 Testing Pool: ice - Threads: 10
============================================================

* Running DD write benchmark with 10 threads...
* Run 1 write speed: 1824.02 MB/s
* Run 2 write speed: 1909.31 MB/s
✓ Average write speed: 1866.66 MB/s
* Running DD read benchmark with 10 threads...
* Run 1 read speed: 15102.95 MB/s
* Run 2 read speed: 29395.15 MB/s
✓ Average read speed: 22249.05 MB/s
So your result still looks consistent with what I am seeing.
And probably consistent also with what I am seeing here
None of this is apples-apples, but its the data we have.
But it does prove that single thread performance of NVME is a complicated issue.
From a TN-Bench result perspective, 200-400 MB/s seems to be about right for small nvme pools on DDR4/PCIE-Gen3 platforms. I can do some Gen3/Gen4 testing in my Epyc system this weekend most likely.
I’ve always wondered if your approach to testing with dd and pseudo devices is better than using fio. I observed “unrealistic” drops in performance and significant discrepancies between read and write speeds that could not be attributed to poor pool design, PCI lane starvation, CPU load, or ARC configuration. (All of these are possible, but not probable. To the extent seen, that is.)
People have been using dd and devices like /dev/urandom and /dev/null to test relative performance since long before fio has existed. It is the stone age original performance testing tool. The philosophy for TN-Bench is: Keep it simple, stupid, and leverage mature technology.
fio can make things “more complicated” by running mixed I/O depths and can run mixed reads/writes in the same “instance” or job, where “dd” can’t. “dd” is full throttle all the time, and it makes measuring it’s performance simpler. fio can be run in similar ways to what I am doing with dd, but I don’t see a compelling reason to switch.
Its a little unfair for you to critisize the software and make that sort of claim without sharing your results and why you think the “drops” are “unrelistic”.
Also, the closest relative to TN-Bench is more like solnet-array-test, not fio. It also used dd in a similar way to do it’s individual disk read tests. Many of us on the forums used it as the de-facto performance test, back in the day, and it was published over 10 years ago. The author claimed it to be in use since far predating TrueNAS, back to 1998.
Code:
sol.net disk array test v3

1) Use all disks (from camcontrol)
2) Use selected disks (from camcontrol|grep)
3) Specify disks
4) Show camcontrol list

Option: 2

Enter grep match pattern (e.g. ST150176): ST4

Selected disks: da3 da4 da5 da6 da7 da8 da9 da10 da11 da12 da13 da14
<ATA ST4000DM000-1F21 CC52>  at scbus3 target 44 lun 0 (da3,pass5)
<ATA ST4000DM000-1F21 CC52>  at scbus3 target 45 lun 0 (da4,pass6)
<ATA ST4000DM000-1F21 CC52>  at scbus3 target 46 lun 0 (da5,pass7)
<ATA ST4000DM000-1F21 CC51>  at scbus3 target 47 lun 0 (da6,pass8)
<ATA ST4000DM000-1F21 CC51>  at scbus3 target 48 lun 0 (da7,pass9)
<ATA ST4000DM000-1F21 CC51>  at scbus3 target 49 lun 0 (da8,pass10)
<ATA ST4000DM000-1F21 CC52>  at scbus3 target 50 lun 0 (da9,pass11)
<ATA ST4000DM000-1F21 CC51>  at scbus3 target 51 lun 0 (da10,pass12)
<ATA ST4000DM000-1F21 CC52>  at scbus3 target 52 lun 0 (da11,pass13)
<ATA ST4000DM000-1F21 CC52>  at scbus3 target 53 lun 0 (da12,pass14)
<ATA ST4000DM000-1F21 CC52>  at scbus3 target 54 lun 0 (da13,pass15)
<ATA ST4000DM000-1F21 CC52>  at scbus3 target 55 lun 0 (da14,pass16)
Is this correct? (y/N): y
Performing initial serial array read (baseline speeds)
Tue Oct 21 08:21:23 CDT 2014
Tue Oct 21 08:26:47 CDT 2014
Completed: initial serial array read (baseline speeds)

Array's average speed is 97.6883 MB/sec per disk

Disk  Disk Size  MB/sec %ofAvg
------- ---------- ------ ------
da3  3815447MB  98  100
da4  3815447MB  90  92
da5  3815447MB  98  100
da6  3815447MB  97  99
da7  3815447MB  95  97
da8  3815447MB  82  84 --SLOW--
da9  3815447MB  87  89 --SLOW--
da10  3815447MB  84  86 --SLOW--
da11  3815447MB  97  99
da12  3815447MB  92  94
da13  3815447MB  102  104
da14  3815447MB  151  155 ++FAST++

Performing initial parallel array read
Tue Oct 21 08:26:47 CDT 2014
The disk da3 appears to be 3815447 MB.
Disk is reading at about 74 MB/sec
This suggests that this pass may take around 860 minutes

  Serial Parall % of
Disk  Disk Size  MB/sec MB/sec Serial
------- ---------- ------ ------ ------
da3  3815447MB  98  86  88 --SLOW--
da4  3815447MB  90  74  82 --SLOW--
da5  3815447MB  98  82  84 --SLOW--
da6  3815447MB  97  91  95
da7  3815447MB  95  72  76 --SLOW--
da8  3815447MB  82  80  97
da9  3815447MB  87  84  96
da10  3815447MB  84  111  133 ++FAST++
da11  3815447MB  97  120  124 ++FAST++
da12  3815447MB  92  116  126 ++FAST++
da13  3815447MB  102  123  121 ++FAST++
da14  3815447MB  151  144  95

Awaiting completion: initial parallel array read
Tue Oct 21 08:39:32 CDT 2014
Completed: initial parallel array read

Disk's average time is 741 seconds per disk

Disk  Bytes Transferred Seconds %ofAvg
------- ----------------- ------- ------
da3  104857600000  743  100
da4  104857600000  764  103
da5  104857600000  752  101
da6  104857600000  737  99
da7  104857600000  748  101
da8  104857600000  754  102
da9  104857600000  738  100
da10  104857600000  762  103
da11  104857600000  748  101
da12  104857600000  756  102
da13  104857600000  740  100
da14  104857600000  653  88 ++FAST++

Performing initial parallel seek-stress array read
Tue Oct 21 08:39:32 CDT 2014
The disk da3 appears to be 3815447 MB.
Disk is reading at about 58 MB/sec
This suggests that this pass may take around 1093 minutes

  Serial Parall % of
Disk  Disk Size  MB/sec MB/sec Serial
------- ---------- ------ ------ ------
da3  3815447MB  98  52  53
da4  3815447MB  90  48  53
da5  3815447MB  98  50  51
da6  3815447MB  97  50  52
da7  3815447MB  95  48  50
da8  3815447MB  82  48  59
da9  3815447MB  87  54  62
da10  3815447MB  84  47  56
da11  3815447MB  97  49  50
da12  3815447MB  92  50  55
da13  3815447MB  102  49  48
da14  3815447MB  151  52  34

Awaiting completion: initial parallel seek-stress array read
I am sorry. I admire every project. I didn’t mean to hurt anyone. I was just trying to understand what you are benchmarking and why. Concerning history: The bogomips in Linux kernel from the 90ies and UNIX “byte” benchmarks of the 70ies are there as well. Nevertheless, it appears that no one currently utilizes them for comparison purposes.
To give you an idea of my results: the system in my signature did 850-900 MB/s sequential read and 250-320 MB/s sequential write on a pool configured with three vdevs (each two-way mirrors), as measured by tn-bench. I highly doubt those figures, though. fio tests showed significantly higher figures. Even a client VM writing on that pool with mixed loads via 10GbE NFS got higher output.
The culprits are those pseudo-devices and the syscalls that dd does for single-threaded copying — hence the name data duplicator. The low I/O queue depth adds to this issue. In my opinion(!), you can’t measure full bandwidth with dd. It was never intended to do so.