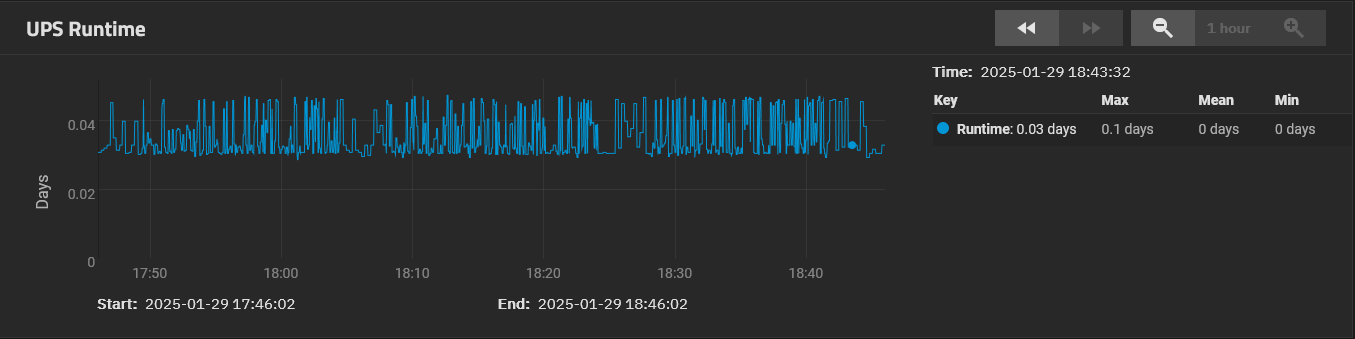
Currently the UPS Runtime is graphed using units expressed in days, eg. 0.03 days.
0.03 days is shown for an actual runtime of ~3200 seconds or ~54 minutes), and a Max figure of 0.1 days (unlikely - that would be 8640 seconds which is almost possible) and both Mean and Min are entirely missing (0 days).
0.03 days and 0.1 days are not very “friendly”, or even useful, units, at least not for smaller UPSs.
Being able to choose between minutes (or even seconds) as an alternative unit to days for the UPS Runtime graph would be nice.
And perhaps a more appropriate unit will also “fix” Max, Mean and Min?
There are multiple reports on Jira asking for a more suitable runtime unit:
Surely this should be an easy fix? My runtime just says 0 days on all the y axis lines. I can’t troubleshoot very well when I have no idea how long it thinks the runtime is.
I would really like this also, my UPS doesn’t even last for an hour so minutes or seconds would be good for me. Days doesn’t help at all, and I think it’s pretty uncommon to have UPS runtime that lasts days.
F yes. Days is a completely nonsensical unit of measure for 99.9% of users. Let the user select, and better yet, use a sensible default. The “easy button” here would be to default to minutes, better yet would be to default to a unit that makes sense for the actual system in use–so if the UPS is reporting 300 minutes of runtime, “hours” is probably a sensible unit. “Seconds” would be silly, so would “days.”
But user-selectable, defaulting to minutes, would cover just about everyone.
Concur. The auto setting could look at the rate of depletion to auto-populate an estimated runtime to whatever the shutdown-triggering voltage is. Then display the info in human-intuitive format.
Ie if the time to shutdown is estimated to be less than an hour, use minutes, If the shutdown time is more than 1 hour, use an hour and minutes, etc. ideally, also communicate the local time at which the shutdown is estimated to occur based on current trends, not just the estimated runtime.
Presumably, NUT communicates much of this info, the NUT server on the TrueNAS has to interpret and mangle said info for display to the admin.
I’ve just started with TrueNAS and while there are some rough edges in 25.10.0.1, this is the one that made me laugh out loud.
Otherwise, I’m really impressed with TrueNAS and am slowly migrating my home office Synology storage over to it as it earns my confidence.
Thanks for your consideration.
BEWARE: If you change the System>Services>UPS>General Options: Identifier to something other than “ups”, the Reporting>UPS graphs will not pick up the data!