Wanting to replace drive with error with a spare—how?

What is the procedure for replace drive that has errors with a spare that I have in the pool already?

I would like to have sdd take over for sde, which I would like to discard. These drives are rather old drives, and this is a practice environment. My server only has four bays, and as can be seen above, they are all occupied.

Did you check the documentation?

I’m not 100 % sure where you hang, can’t you select the spare as a replacement disk?

As of now the drive has not faulted, hence the spare did not automatically take over.

What errors does it display? If it’s old and you want to replace it anyway you can ahead. Otherwise some CRC errors may indicate an issue with cabling or power.

3 Likes

I am surprised that you are using an L2ARC for only 4TB of disk - we do not know how much memory your system has, but I would be surprised if it has a positive impact on your performance.

My own advice (and see standard disclaimer) would be to:

  1. Remove the cache from this pool;
  2. Swap sdd for sde as you suggest; and
  3. Replace both sdb and sde with new SATA disks (of whatever capacity you fancy) and add them to your pool as a new mirror vDev.
1 Like

I’m a bit curious exactly what kind of failure it is that you have. Right now I can’t tell.

Can you post the output of zpool status -v so we can see the errors?

EDIT: Forgot to add smartctl -x /dev/sde output as well.

2 Likes

In terms of what has already happened, as @chuck32 has said, sde has not actually errored because if it had then sdd would already have been resilvered.

  1. Run zpool status from the shell and copy and paste the results here.
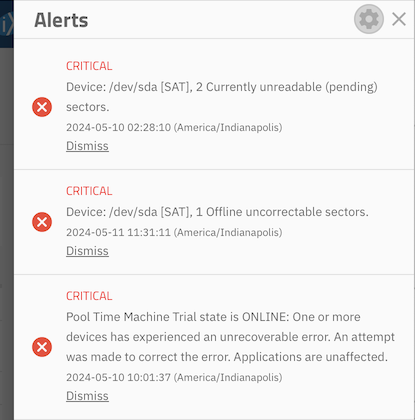
  2. Check your alerts and see when the errors happened and what errors they were.
  3. Do you run regular Scrubs and if so when was the last?
  4. Running a new scrub might be a good idea but we need more info I think.
  5. What were the last SMART results for sde?
  6. It might be appropriate to run a SMART long test on sde - again we need more info.

Once we have more info you can decide whether these errors were temporary or not and whether changing the drive is necessary or advisory. It might simply be sufficient to clear the errors.

I have the information from here:

Screenshot 2024-05-13 at 11.49.20 AM

I was unaware of the fact that the swap-out can happen automatically. Since this system is one I am playing around with to learn about how TrueNAS behaves, I will just let that happen.

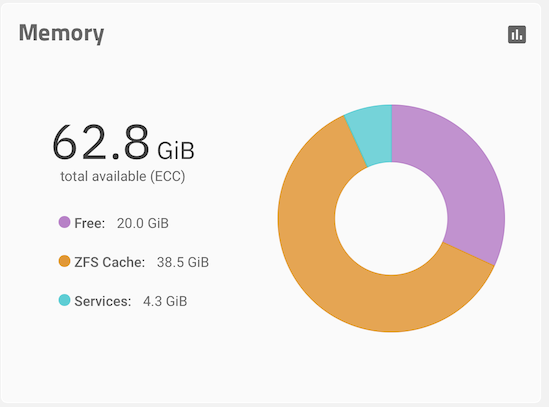
The system is a Supermicro SuperServer 6018U-TRT4+ system I picked up from eBay for very cheap. Before receiving and installing the 12-TB drives I now have, I wanted to see how it all works. The server is equipped with 64 GB or RAM:

Screenshot 2024-05-13 at 11.57.22 AM

Based on that, there’s no obvious use case for a L2ARC, and definitely not enough RAM to support 1 TB of L2ARC.
I’m also surprised this was set up as a 2-way mirror with spare rather than directly as 3-way mirror.

1 Like

I would take the jump and say the drive needs replacement. You can still post the output requested by @joeschmuck but I would assume the result will still be, that we’d recommend a replacement.

@DominikHoffmann You have shown us two completely different error messages, each for two different drives.

What version of TrueNAS are you running? I will assume some variant of SCALE.
In the GUI, Left side, System Settings - > Shell
You should have a shell window.

Type zpool status -v and post the results. That will address the drive sde message.

Type smartctl -x /dev/sde and post the results. That will take care of sde drive issues.

Type smartctl -x /dev/sda and post the results. That will take care of the CRITICAL errors messages you posted.

Do not confuse zpool errors with drive errors. Drive errors may cause zpool errors, however an unstable system or improper shutdown can as well. You have not provided the correct information yet.

However, you can replace the drive sde within the pool if you desire, no harm there however it may not be required. The data will help determine what is going on.

@DominikHoffmann As Joe has pointed out you have two completely separate issues which presumably happened at two separate times. In your first information, sda was ONLINE and now it is OFFLINE. Clearly something else happened in between.

To have a hope of diagnosing these we need the info Joe asked for collected at the same time i.e. the same error state.

@DominikHoffmann

P.S. I would also like to add a plaudit and send you an (imaginary) Certificate of Excellence in Advanced Common Sense for spending the time playing before you commit your data to your NAS.

With hindsight I was in too much of a hurry with mine - although I am still pretty happy with my choices (though with hindsight I would have done a RAIDZ2 rather than a RAIDZ1 across my 5 drives), I wish I had taken the time to e.g. pull out a drive and corrupt the data so that I could see how to recover from a (virtual) dead drive. But with data on it, I am not going to play around and risk losing the data.

1 Like

What are you going to look for in the output of those two commands?

Output of zpool status -v:

  pool: Time Machine Trial
 state: ONLINE
status: One or more devices has experienced an unrecoverable error.  An
        attempt was made to correct the error.  Applications are unaffected.
action: Determine if the device needs to be replaced, and clear the errors
        using 'zpool clear' or replace the device with 'zpool replace'.
   see: https://openzfs.github.io/openzfs-docs/msg/ZFS-8000-9P
  scan: resilvered 2.02G in 00:01:12 with 0 errors on Thu May  9 11:54:36 2024
config:

        NAME                                      STATE     READ WRITE CKSUM
        Time Machine Trial                        ONLINE       0     0     0
          mirror-0                                ONLINE       0     0     0
            bee99e48-08fa-41d1-8a58-1af466b76587  ONLINE       0     0     2
            f2fa3e44-5d72-4c39-b21d-5ef168fc3cdb  ONLINE       0     0     0
        cache
          763ec928-2c91-4ef3-9674-8c5e61112d49    ONLINE       0     0     0
        spares
          4d1ec5f1-8f3a-4f97-a5f7-7f36fb3aad17    AVAIL   

errors: No known data errors

  pool: boot-pool
 state: ONLINE
  scan: scrub repaired 0B in 00:00:21 with 0 errors on Thu May  9 15:15:42 2024
config:

        NAME        STATE     READ WRITE CKSUM
        boot-pool   ONLINE       0     0     0
          sdc3      ONLINE       0     0     0

errors: No known data errors

Output of smartctl -x /dev/sde :

smartctl 7.4 2023-08-01 r5530 [x86_64-linux-6.6.20-production+truenas] (local build)
Copyright (C) 2002-23, Bruce Allen, Christian Franke, www.smartmontools.org

=== START OF INFORMATION SECTION ===
Model Family:     Hitachi Deskstar 7K2000
Device Model:     Hitachi HDS722020ALA330
Serial Number:    JK11D1YAKWB2VZ
LU WWN Device Id: 5 000cca 221f6b62b
Firmware Version: JKAOA3MA
User Capacity:    2,000,398,934,016 bytes [2.00 TB]
Sector Size:      512 bytes logical/physical
Rotation Rate:    7200 rpm
Form Factor:      3.5 inches
Device is:        In smartctl database 7.3/5528
ATA Version is:   ATA8-ACS T13/1699-D revision 4
SATA Version is:  SATA 2.6, 3.0 Gb/s
Local Time is:    Mon May 13 12:43:19 2024 EDT
SMART support is: Available - device has SMART capability.
SMART support is: Enabled
AAM feature is:   Unavailable
APM feature is:   Disabled
Rd look-ahead is: Enabled
Write cache is:   Enabled
DSN feature is:   Unavailable
ATA Security is:  Disabled, NOT FROZEN [SEC1]
Wt Cache Reorder: Enabled

=== START OF READ SMART DATA SECTION ===
SMART overall-health self-assessment test result: PASSED

General SMART Values:
Offline data collection status:  (0x84) Offline data collection activity
                                        was suspended by an interrupting command from host.
                                        Auto Offline Data Collection: Enabled.
Self-test execution status:      (   0) The previous self-test routine completed
                                        without error or no self-test has ever 
                                        been run.
Total time to complete Offline 
data collection:                (21889) seconds.
Offline data collection
capabilities:                    (0x5b) SMART execute Offline immediate.
                                        Auto Offline data collection on/off support.
                                        Suspend Offline collection upon new
                                        command.
                                        Offline surface scan supported.
                                        Self-test supported.
                                        No Conveyance Self-test supported.
                                        Selective Self-test supported.
SMART capabilities:            (0x0003) Saves SMART data before entering
                                        power-saving mode.
                                        Supports SMART auto save timer.
Error logging capability:        (0x01) Error logging supported.
                                        General Purpose Logging supported.
Short self-test routine 
recommended polling time:        (   1) minutes.
Extended self-test routine
recommended polling time:        ( 365) minutes.
SCT capabilities:              (0x003d) SCT Status supported.
                                        SCT Error Recovery Control supported.
                                        SCT Feature Control supported.
                                        SCT Data Table supported.

SMART Attributes Data Structure revision number: 16
Vendor Specific SMART Attributes with Thresholds:
ID# ATTRIBUTE_NAME          FLAGS    VALUE WORST THRESH FAIL RAW_VALUE
  1 Raw_Read_Error_Rate     PO-R--   100   100   016    -    0
  2 Throughput_Performance  P-S---   133   133   054    -    99
  3 Spin_Up_Time            POS---   121   121   024    -    636 (Average 554)
  4 Start_Stop_Count        -O--C-   100   100   000    -    927
  5 Reallocated_Sector_Ct   PO--CK   100   100   005    -    2
  7 Seek_Error_Rate         PO-R--   100   100   067    -    0
  8 Seek_Time_Performance   P-S---   121   121   020    -    35
  9 Power_On_Hours          -O--C-   099   099   000    -    11514
 10 Spin_Retry_Count        PO--C-   100   100   060    -    0
 12 Power_Cycle_Count       -O--CK   100   100   000    -    22
192 Power-Off_Retract_Count -O--CK   099   099   000    -    1221
193 Load_Cycle_Count        -O--C-   099   099   000    -    1221
194 Temperature_Celsius     -O----   142   142   000    -    42 (Min/Max 21/59)
196 Reallocated_Event_Count -O--CK   100   100   000    -    2
197 Current_Pending_Sector  -O---K   100   100   000    -    0
198 Offline_Uncorrectable   ---R--   100   100   000    -    0
199 UDMA_CRC_Error_Count    -O-R--   200   200   000    -    18
                            ||||||_ K auto-keep
                            |||||__ C event count
                            ||||___ R error rate
                            |||____ S speed/performance
                            ||_____ O updated online
                            |______ P prefailure warning

General Purpose Log Directory Version 1
SMART           Log Directory Version 1 [multi-sector log support]
Address    Access  R/W   Size  Description
0x00       GPL,SL  R/O      1  Log Directory
0x01           SL  R/O      1  Summary SMART error log
0x03       GPL     R/O      1  Ext. Comprehensive SMART error log
0x04       GPL     R/O      7  Device Statistics log
0x06           SL  R/O      1  SMART self-test log
0x07       GPL     R/O      1  Extended self-test log
0x09           SL  R/W      1  Selective self-test log
0x10       GPL     R/O      1  NCQ Command Error log
0x11       GPL     R/O      1  SATA Phy Event Counters log
0x20       GPL     R/O      1  Streaming performance log
0x21       GPL     R/O      1  Write stream error log
0x22       GPL     R/O      1  Read stream error log
0x80-0x9f  GPL,SL  R/W     16  Host vendor specific log
0xe0       GPL,SL  R/W      1  SCT Command/Status
0xe1       GPL,SL  R/W      1  SCT Data Transfer

SMART Extended Comprehensive Error Log Version: 0 (1 sectors)
No Errors Logged

SMART Extended Self-test Log Version: 1 (1 sectors)
No self-tests have been logged.  [To run self-tests, use: smartctl -t]

SMART Selective self-test log data structure revision number 1
 SPAN  MIN_LBA  MAX_LBA  CURRENT_TEST_STATUS
    1        0        0  Not_testing
    2        0        0  Not_testing
    3        0        0  Not_testing
    4        0        0  Not_testing
    5        0        0  Not_testing
Selective self-test flags (0x0):
  After scanning selected spans, do NOT read-scan remainder of disk.
If Selective self-test is pending on power-up, resume after 0 minute delay.

SCT Status Version:                  3
SCT Version (vendor specific):       256 (0x0100)
Device State:                        SMART Off-line Data Collection executing in background (4)
Current Temperature:                    43 Celsius
Power Cycle Min/Max Temperature:     28/45 Celsius
Lifetime    Min/Max Temperature:     21/59 Celsius
Under/Over Temperature Limit Count:   0/0

SCT Temperature History Version:     2
Temperature Sampling Period:         1 minute
Temperature Logging Interval:        1 minute
Min/Max recommended Temperature:      0/60 Celsius
Min/Max Temperature Limit:           -40/70 Celsius
Temperature History Size (Index):    128 (32)

Index    Estimated Time   Temperature Celsius
  33    2024-05-13 10:36    43  ************************
 ...    ..(  2 skipped).    ..  ************************
  36    2024-05-13 10:39    43  ************************
  37    2024-05-13 10:40    44  *************************
  38    2024-05-13 10:41    43  ************************
 ...    ..( 30 skipped).    ..  ************************
  69    2024-05-13 11:12    43  ************************
  70    2024-05-13 11:13    44  *************************
 ...    ..(  6 skipped).    ..  *************************
  77    2024-05-13 11:20    44  *************************
  78    2024-05-13 11:21    43  ************************
 ...    ..( 14 skipped).    ..  ************************
  93    2024-05-13 11:36    43  ************************
  94    2024-05-13 11:37    44  *************************
 ...    ..(  2 skipped).    ..  *************************
  97    2024-05-13 11:40    44  *************************
  98    2024-05-13 11:41    43  ************************
 ...    ..( 19 skipped).    ..  ************************
 118    2024-05-13 12:01    43  ************************
 119    2024-05-13 12:02    42  ***********************
 120    2024-05-13 12:03    43  ************************
 ...    ..( 17 skipped).    ..  ************************
  10    2024-05-13 12:21    43  ************************
  11    2024-05-13 12:22    44  *************************
  12    2024-05-13 12:23    44  *************************
  13    2024-05-13 12:24    43  ************************
 ...    ..( 18 skipped).    ..  ************************
  32    2024-05-13 12:43    43  ************************

SCT Error Recovery Control:
           Read: Disabled
          Write: Disabled

Device Statistics (GP Log 0x04)
Page  Offset Size        Value Flags Description
0x01  =====  =               =  ===  == General Statistics (rev 1) ==
0x01  0x008  4              22  ---  Lifetime Power-On Resets
0x01  0x010  4           11514  ---  Power-on Hours
0x01  0x018  6     15438536290  ---  Logical Sectors Written
0x01  0x020  6        49269477  ---  Number of Write Commands
0x01  0x028  6   1240225687546  ---  Logical Sectors Read
0x01  0x030  6        56751045  ---  Number of Read Commands
0x03  =====  =               =  ===  == Rotating Media Statistics (rev 1) ==
0x03  0x008  4           10579  ---  Spindle Motor Power-on Hours
0x03  0x010  4           10579  ---  Head Flying Hours
0x03  0x018  4            1221  ---  Head Load Events
0x03  0x020  4               2  ---  Number of Reallocated Logical Sectors
0x03  0x028  4              67  ---  Read Recovery Attempts
0x03  0x030  4               0  ---  Number of Mechanical Start Failures
0x04  =====  =               =  ===  == General Errors Statistics (rev 1) ==
0x04  0x008  4               0  ---  Number of Reported Uncorrectable Errors
0x04  0x010  4              25  ---  Resets Between Cmd Acceptance and Completion
0x05  =====  =               =  ===  == Temperature Statistics (rev 1) ==
0x05  0x008  1              42  ---  Current Temperature
0x05  0x010  1              42  N--  Average Short Term Temperature
0x05  0x018  1              36  N--  Average Long Term Temperature
0x05  0x020  1              59  ---  Highest Temperature
0x05  0x028  1              21  ---  Lowest Temperature
0x05  0x030  1              55  N--  Highest Average Short Term Temperature
0x05  0x038  1               0  N--  Lowest Average Short Term Temperature
0x05  0x040  1              52  N--  Highest Average Long Term Temperature
0x05  0x048  1               0  N--  Lowest Average Long Term Temperature
0x05  0x050  4               0  ---  Time in Over-Temperature
0x05  0x058  1              60  ---  Specified Maximum Operating Temperature
0x05  0x060  4               0  ---  Time in Under-Temperature
0x05  0x068  1               0  ---  Specified Minimum Operating Temperature
0x06  =====  =               =  ===  == Transport Statistics (rev 1) ==
0x06  0x008  4             469  ---  Number of Hardware Resets
0x06  0x010  4             306  ---  Number of ASR Events
0x06  0x018  4              18  ---  Number of Interface CRC Errors
                                |||_ C monitored condition met
                                ||__ D supports DSN
                                |___ N normalized value

Pending Defects log (GP Log 0x0c) not supported

SATA Phy Event Counters (GP Log 0x11)
ID      Size     Value  Description
0x0001  2            0  Command failed due to ICRC error
0x0002  2            0  R_ERR response for data FIS
0x0005  2            0  R_ERR response for non-data FIS
0x0009  2            1  Transition from drive PhyRdy to drive PhyNRdy
0x000a  2            1  Device-to-host register FISes sent due to a COMRESET
0x000b  2            0  CRC errors within host-to-device FIS
0x000d  2            0  Non-CRC errors within host-to-device FIS

Doesn’t the system do that on a default schedule automatically?

Long time since I’ve done a fresh install but I do remember having to set scrub tasks up.
Check Data Protection → Scrub Tasks

I set it up as a 2-disk mirror first, because I found two identical 2 TB drives in my stash. Only when the errors started happening, did I discover another 2 TB drive I had, and started looking into how I would have it replace the one with the errors.

And for sda?

With the output of zpool status that was posted afterwards I’m not too sure anymore. Before that I would have thought the sdX IDs have changed in-between reboots, since the alerts are older.

Output of smartctl -x /dev/sda:

smartctl 7.4 2023-08-01 r5530 [x86_64-linux-6.6.20-production+truenas] (local build)
Copyright (C) 2002-23, Bruce Allen, Christian Franke, www.smartmontools.org

=== START OF INFORMATION SECTION ===
Model Family:     Hitachi Deskstar 7K2000
Device Model:     Hitachi HDS722020ALA330
Serial Number:    JK1130YAHPK9KT
LU WWN Device Id: 5 000cca 221d7e445
Firmware Version: JKAOA28A
User Capacity:    2,000,398,934,016 bytes [2.00 TB]
Sector Size:      512 bytes logical/physical
Rotation Rate:    7200 rpm
Form Factor:      3.5 inches
Device is:        In smartctl database 7.3/5528
ATA Version is:   ATA8-ACS T13/1699-D revision 4
SATA Version is:  SATA 2.6, 3.0 Gb/s
Local Time is:    Mon May 13 13:12:09 2024 EDT
SMART support is: Available - device has SMART capability.
SMART support is: Enabled
AAM feature is:   Disabled
APM feature is:   Disabled
Rd look-ahead is: Enabled
Write cache is:   Enabled
DSN feature is:   Unavailable
ATA Security is:  Disabled, NOT FROZEN [SEC1]
Wt Cache Reorder: Enabled

=== START OF READ SMART DATA SECTION ===
SMART overall-health self-assessment test result: PASSED

General SMART Values:
Offline data collection status:  (0x84) Offline data collection activity
                                        was suspended by an interrupting command from host.
                                        Auto Offline Data Collection: Enabled.
Self-test execution status:      (   0) The previous self-test routine completed
                                        without error or no self-test has ever 
                                        been run.
Total time to complete Offline 
data collection:                (22624) seconds.
Offline data collection
capabilities:                    (0x5b) SMART execute Offline immediate.
                                        Auto Offline data collection on/off support.
                                        Suspend Offline collection upon new
                                        command.
                                        Offline surface scan supported.
                                        Self-test supported.
                                        No Conveyance Self-test supported.
                                        Selective Self-test supported.
SMART capabilities:            (0x0003) Saves SMART data before entering
                                        power-saving mode.
                                        Supports SMART auto save timer.
Error logging capability:        (0x01) Error logging supported.
                                        General Purpose Logging supported.
Short self-test routine 
recommended polling time:        (   1) minutes.
Extended self-test routine
recommended polling time:        ( 377) minutes.
SCT capabilities:              (0x003d) SCT Status supported.
                                        SCT Error Recovery Control supported.
                                        SCT Feature Control supported.
                                        SCT Data Table supported.

SMART Attributes Data Structure revision number: 16
Vendor Specific SMART Attributes with Thresholds:
ID# ATTRIBUTE_NAME          FLAGS    VALUE WORST THRESH FAIL RAW_VALUE
  1 Raw_Read_Error_Rate     PO-R--   100   100   016    -    0
  2 Throughput_Performance  P-S---   133   133   054    -    102
  3 Spin_Up_Time            POS---   126   126   024    -    516 (Average 632)
  4 Start_Stop_Count        -O--C-   100   100   000    -    823
  5 Reallocated_Sector_Ct   PO--CK   100   100   005    -    165
  7 Seek_Error_Rate         PO-R--   100   100   067    -    0
  8 Seek_Time_Performance   P-S---   112   112   020    -    39
  9 Power_On_Hours          -O--C-   094   094   000    -    48519
 10 Spin_Retry_Count        PO--C-   100   100   060    -    0
 12 Power_Cycle_Count       -O--CK   100   100   000    -    156
192 Power-Off_Retract_Count -O--CK   099   099   000    -    1348
193 Load_Cycle_Count        -O--C-   099   099   000    -    1348
194 Temperature_Celsius     -O----   142   142   000    -    42 (Min/Max 19/64)
196 Reallocated_Event_Count -O--CK   100   100   000    -    165
197 Current_Pending_Sector  -O---K   100   100   000    -    2
198 Offline_Uncorrectable   ---R--   100   100   000    -    0
199 UDMA_CRC_Error_Count    -O-R--   200   200   000    -    294
                            ||||||_ K auto-keep
                            |||||__ C event count
                            ||||___ R error rate
                            |||____ S speed/performance
                            ||_____ O updated online
                            |______ P prefailure warning

General Purpose Log Directory Version 1
SMART           Log Directory Version 1 [multi-sector log support]
Address    Access  R/W   Size  Description
0x00       GPL,SL  R/O      1  Log Directory
0x01           SL  R/O      1  Summary SMART error log
0x03       GPL     R/O      1  Ext. Comprehensive SMART error log
0x04       GPL     R/O      7  Device Statistics log
0x06           SL  R/O      1  SMART self-test log
0x07       GPL     R/O      1  Extended self-test log
0x09           SL  R/W      1  Selective self-test log
0x10       GPL     R/O      1  NCQ Command Error log
0x11       GPL     R/O      1  SATA Phy Event Counters log
0x20       GPL     R/O      1  Streaming performance log
0x21       GPL     R/O      1  Write stream error log
0x22       GPL     R/O      1  Read stream error log
0x80-0x9f  GPL,SL  R/W     16  Host vendor specific log
0xe0       GPL,SL  R/W      1  SCT Command/Status
0xe1       GPL,SL  R/W      1  SCT Data Transfer

SMART Extended Comprehensive Error Log Version: 1 (1 sectors)
Device Error Count: 300 (device log contains only the most recent 4 errors)
        CR     = Command Register
        FEATR  = Features Register
        COUNT  = Count (was: Sector Count) Register
        LBA_48 = Upper bytes of LBA High/Mid/Low Registers ]  ATA-8
        LH     = LBA High (was: Cylinder High) Register    ]   LBA
        LM     = LBA Mid (was: Cylinder Low) Register      ] Register
        LL     = LBA Low (was: Sector Number) Register     ]
        DV     = Device (was: Device/Head) Register
        DC     = Device Control Register
        ER     = Error register
        ST     = Status register
Powered_Up_Time is measured from power on, and printed as
DDd+hh:mm:SS.sss where DD=days, hh=hours, mm=minutes,
SS=sec, and sss=millisec. It "wraps" after 49.710 days.

Error 300 [3] occurred at disk power-on lifetime: 47750 hours (1989 days + 14 hours)
  When the command that caused the error occurred, the device was active or idle.

  After command completion occurred, registers were:
  ER -- ST COUNT  LBA_48  LH LM LL DV DC
  -- -- -- == -- == == == -- -- -- -- --
  40 -- 51 00 29 00 00 b3 ca df af 00 00  Error: UNC 41 sectors at LBA = 0xb3cadfaf = 3016417199

  Commands leading to the command that caused the error were:
  CR FEATR COUNT  LBA_48  LH LM LL DV DC  Powered_Up_Time  Command/Feature_Name
  -- == -- == -- == == == -- -- -- -- --  ---------------  --------------------
  25 00 03 01 00 00 00 b3 ca de d8 43 00 14d+06:13:36.712  READ DMA EXT
  25 00 03 01 00 00 00 b3 ca dd d8 43 00 14d+06:13:36.693  READ DMA EXT
  25 00 03 01 00 00 00 b3 ca dc d8 43 00 14d+06:13:36.673  READ DMA EXT
  25 00 03 01 00 00 00 b3 ca db d8 43 00 14d+06:13:36.653  READ DMA EXT
  25 00 03 01 00 00 00 b3 ca da d8 43 00 14d+06:13:36.635  READ DMA EXT

Error 299 [2] occurred at disk power-on lifetime: 47733 hours (1988 days + 21 hours)
  When the command that caused the error occurred, the device was active or idle.

  After command completion occurred, registers were:
  ER -- ST COUNT  LBA_48  LH LM LL DV DC
  -- -- -- == -- == == == -- -- -- -- --
  40 -- 51 00 29 00 00 b3 ca df af 00 00  Error: UNC 41 sectors at LBA = 0xb3cadfaf = 3016417199

  Commands leading to the command that caused the error were:
  CR FEATR COUNT  LBA_48  LH LM LL DV DC  Powered_Up_Time  Command/Feature_Name
  -- == -- == -- == == == -- -- -- -- --  ---------------  --------------------
  25 00 03 01 00 00 00 b3 ca de d8 43 00  9d+22:01:45.890  READ DMA EXT
  25 00 03 01 00 00 00 b3 ca dd d8 43 00  9d+22:01:45.870  READ DMA EXT
  25 00 03 01 00 00 00 b3 ca dc d8 43 00  9d+22:01:45.851  READ DMA EXT
  25 00 03 01 00 00 00 b3 ca db d8 43 00  9d+22:01:45.833  READ DMA EXT
  25 00 03 01 00 00 00 b3 ca da d8 43 00  9d+22:01:45.815  READ DMA EXT

Error 298 [1] occurred at disk power-on lifetime: 47731 hours (1988 days + 19 hours)
  When the command that caused the error occurred, the device was active or idle.

  After command completion occurred, registers were:
  ER -- ST COUNT  LBA_48  LH LM LL DV DC
  -- -- -- == -- == == == -- -- -- -- --
  40 -- 51 00 29 00 00 b3 ca df af 00 00  Error: UNC 41 sectors at LBA = 0xb3cadfaf = 3016417199

  Commands leading to the command that caused the error were:
  CR FEATR COUNT  LBA_48  LH LM LL DV DC  Powered_Up_Time  Command/Feature_Name
  -- == -- == -- == == == -- -- -- -- --  ---------------  --------------------
  25 00 03 01 00 00 00 b3 ca de d8 43 00  9d+12:42:45.605  READ DMA EXT
  25 00 03 01 00 00 00 b3 ca dd d8 43 00  9d+12:42:45.587  READ DMA EXT
  25 00 03 01 00 00 00 b3 ca dc d8 43 00  9d+12:42:45.568  READ DMA EXT
  25 00 03 01 00 00 00 b3 ca db d8 43 00  9d+12:42:45.550  READ DMA EXT
  25 00 03 01 00 00 00 b3 ca da d8 43 00  9d+12:42:45.532  READ DMA EXT

Error 297 [0] occurred at disk power-on lifetime: 47721 hours (1988 days + 9 hours)
  When the command that caused the error occurred, the device was active or idle.

  After command completion occurred, registers were:
  ER -- ST COUNT  LBA_48  LH LM LL DV DC
  -- -- -- == -- == == == -- -- -- -- --
  40 -- 51 00 e9 00 00 b3 ca d9 ef 00 00  Error: UNC 233 sectors at LBA = 0xb3cad9ef = 3016415727

  Commands leading to the command that caused the error were:
  CR FEATR COUNT  LBA_48  LH LM LL DV DC  Powered_Up_Time  Command/Feature_Name
  -- == -- == -- == == == -- -- -- -- --  ---------------  --------------------
  25 00 03 01 00 00 00 b3 ca d9 d8 43 00  6d+20:53:19.272  READ DMA EXT
  25 00 03 01 00 00 00 b3 ca d8 d8 43 00  6d+20:53:19.254  READ DMA EXT
  25 00 03 01 00 00 00 b3 ca d7 d8 43 00  6d+20:53:19.236  READ DMA EXT
  25 00 03 01 00 00 00 b3 ca d6 d8 43 00  6d+20:53:19.218  READ DMA EXT
  25 00 03 00 08 00 00 01 29 25 c0 41 00  6d+20:53:19.214  READ DMA EXT

SMART Extended Self-test Log Version: 1 (1 sectors)
Num  Test_Description    Status                  Remaining  LifeTime(hours)  LBA_of_first_error
# 1  Extended offline    Completed: read failure       30%     48290         3018679257

SMART Selective self-test log data structure revision number 1
 SPAN  MIN_LBA  MAX_LBA  CURRENT_TEST_STATUS
    1        0        0  Not_testing
    2        0        0  Not_testing
    3        0        0  Not_testing
    4        0        0  Not_testing
    5        0        0  Not_testing
Selective self-test flags (0x0):
  After scanning selected spans, do NOT read-scan remainder of disk.
If Selective self-test is pending on power-up, resume after 0 minute delay.

SCT Status Version:                  3
SCT Version (vendor specific):       256 (0x0100)
Device State:                        SMART Off-line Data Collection executing in background (4)
Current Temperature:                    42 Celsius
Power Cycle Min/Max Temperature:     37/45 Celsius
Lifetime    Min/Max Temperature:     19/64 Celsius
Under/Over Temperature Limit Count:   0/0

SCT Temperature History Version:     2
Temperature Sampling Period:         1 minute
Temperature Logging Interval:        1 minute
Min/Max recommended Temperature:      0/60 Celsius
Min/Max Temperature Limit:           -40/70 Celsius
Temperature History Size (Index):    128 (126)

Index    Estimated Time   Temperature Celsius
 127    2024-05-13 11:05    42  ***********************
 ...    ..(  5 skipped).    ..  ***********************
   5    2024-05-13 11:11    42  ***********************
   6    2024-05-13 11:12    43  ************************
 ...    ..(  7 skipped).    ..  ************************
  14    2024-05-13 11:20    43  ************************
  15    2024-05-13 11:21    42  ***********************
 ...    ..(  8 skipped).    ..  ***********************
  24    2024-05-13 11:30    42  ***********************
  25    2024-05-13 11:31    41  **********************
  26    2024-05-13 11:32    41  **********************
  27    2024-05-13 11:33    42  ***********************
 ...    ..(  4 skipped).    ..  ***********************
  32    2024-05-13 11:38    42  ***********************
  33    2024-05-13 11:39    43  ************************
  34    2024-05-13 11:40    42  ***********************
 ...    ..( 10 skipped).    ..  ***********************
  45    2024-05-13 11:51    42  ***********************
  46    2024-05-13 11:52    41  **********************
 ...    ..( 15 skipped).    ..  **********************
  62    2024-05-13 12:08    41  **********************
  63    2024-05-13 12:09    42  ***********************
 ...    ..( 14 skipped).    ..  ***********************
  78    2024-05-13 12:24    42  ***********************
  79    2024-05-13 12:25    43  ************************
  80    2024-05-13 12:26    42  ***********************
 ...    ..(  7 skipped).    ..  ***********************
  88    2024-05-13 12:34    42  ***********************
  89    2024-05-13 12:35    41  **********************
 ...    ..( 33 skipped).    ..  **********************
 123    2024-05-13 13:09    41  **********************
 124    2024-05-13 13:10    42  ***********************
 125    2024-05-13 13:11    42  ***********************
 126    2024-05-13 13:12    42  ***********************

SCT Error Recovery Control:
           Read: Disabled
          Write: Disabled

Device Statistics (GP Log 0x04)
Page  Offset Size        Value Flags Description
0x01  =====  =               =  ===  == General Statistics (rev 1) ==
0x01  0x008  4             156  ---  Lifetime Power-On Resets
0x01  0x010  4           48519  ---  Power-on Hours
0x01  0x018  6     94429514100  ---  Logical Sectors Written
0x01  0x020  6      1674501503  ---  Number of Write Commands
0x01  0x028  6   2493972056873  ---  Logical Sectors Read
0x01  0x030  6      5586923931  ---  Number of Read Commands
0x03  =====  =               =  ===  == Rotating Media Statistics (rev 1) ==
0x03  0x008  4           46913  ---  Spindle Motor Power-on Hours
0x03  0x010  4           46913  ---  Head Flying Hours
0x03  0x018  4            1348  ---  Head Load Events
0x03  0x020  4             167  ---  Number of Reallocated Logical Sectors
0x03  0x028  4              76  ---  Read Recovery Attempts
0x03  0x030  4               0  ---  Number of Mechanical Start Failures
0x04  =====  =               =  ===  == General Errors Statistics (rev 1) ==
0x04  0x008  4               6  ---  Number of Reported Uncorrectable Errors
0x04  0x010  4            1445  ---  Resets Between Cmd Acceptance and Completion
0x05  =====  =               =  ===  == Temperature Statistics (rev 1) ==
0x05  0x008  1              42  ---  Current Temperature
0x05  0x010  1              40  N--  Average Short Term Temperature
0x05  0x018  1              33  N--  Average Long Term Temperature
0x05  0x020  1              64  ---  Highest Temperature
0x05  0x028  1              19  ---  Lowest Temperature
0x05  0x030  1              61  N--  Highest Average Short Term Temperature
0x05  0x038  1               0  N--  Lowest Average Short Term Temperature
0x05  0x040  1              53  N--  Highest Average Long Term Temperature
0x05  0x048  1               0  N--  Lowest Average Long Term Temperature
0x05  0x050  4            1410  ---  Time in Over-Temperature
0x05  0x058  1              60  ---  Specified Maximum Operating Temperature
0x05  0x060  4               0  ---  Time in Under-Temperature
0x05  0x068  1               0  ---  Specified Minimum Operating Temperature
0x06  =====  =               =  ===  == Transport Statistics (rev 1) ==
0x06  0x008  4            3085  ---  Number of Hardware Resets
0x06  0x010  4            1623  ---  Number of ASR Events
0x06  0x018  4             294  ---  Number of Interface CRC Errors
                                |||_ C monitored condition met
                                ||__ D supports DSN
                                |___ N normalized value

Pending Defects log (GP Log 0x0c) not supported

SATA Phy Event Counters (GP Log 0x11)
ID      Size     Value  Description
0x0001  2            0  Command failed due to ICRC error
0x0002  2            0  R_ERR response for data FIS
0x0005  2            0  R_ERR response for non-data FIS
0x0009  2            1  Transition from drive PhyRdy to drive PhyNRdy
0x000a  2            1  Device-to-host register FISes sent due to a COMRESET
0x000b  2            0  CRC errors within host-to-device FIS
0x000d  2            0  Non-CRC errors within host-to-device FIS

Dragonfish-24.04.0

I am planning to set up a RAIDZ2, as well. It will consist of 4 12-TB drives. Is that advisable, given hat I only have 4 drive bays in my server?

Does that mean that if one of those fails I will have to pull it out and then set up the replacement drive going into that same drive bay as a spare after the failure?