Problem/Justification
I currently use TrueNAS Scale version 24.10. I installed It in my Dell T5820, which has an 8-core processor and 32 GB of RAM. My issue is: that at this current time, I can only transfer up to 1Gbps of data (max) over my network from TrueNAS through a wire ethernet connection. All of my network devices are upgraded to 2.5 Gbps (router, switches, NIC cards …). I am wondering if there is a tool in the TrueNAS toolkit that allows me to see what is a bottleneck in my hardware (T5820), and from that analysis, I can upgrade my hardware appropriately.
Impact
Benefit: This feature will allow users to see the current bottleneck of their servers and from there allow them to make an informed decision when it comes to the upgrading process.
User Story
For example, my T5820 would need an upgrade, but I don’t know what hardware needs to be replaced to achieve higher transfer speed. Right now, I am just shooting in the dark, but if I have an analysis toolkit built into TrueNAS, I can make a much more informed decision about what I need to do.
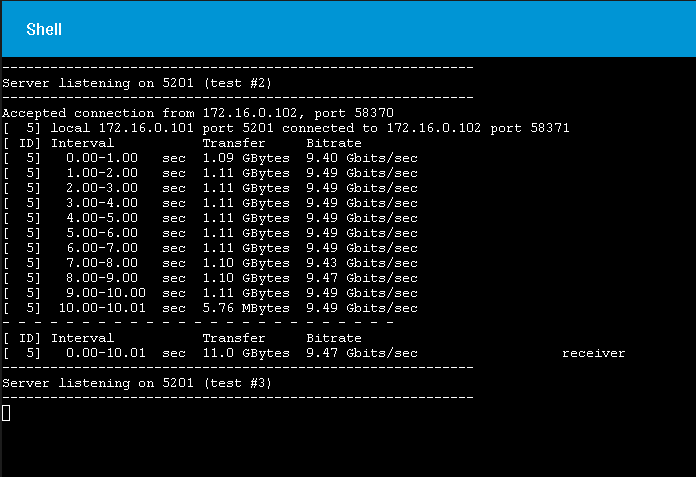
Verify your network speeds using IPERF between computers. There should be threads related to SMB Performance where this is used to diag. It also depends on what you are transfering. Large compressed files are best to test with.
If you are capping at 1Gbps, you test your network to make sure it is working end to end at your stated 2.5Gbps using the IPERF tool. That is the first step and is the point of your thread. Once that has been verified, then you move on to other diag.
My concern is that writing is very slow, but reading is acceptable. How can I check for CMR and SMR information? The hardware is a regular Dell T5820 workstation. Look at the picture for more detail:
That’s nice to try to help solve the problem but this is not the topic: it’s a feature request for a tool allowing to pinpoint the bottleneck in your server. As @Stux said there tools like iperf3 to test network speed, and after you can test your pool speed etc. As I understand (hope I understand…) the request is to have a single tool that show you the bottleneck: for example when you copy a file from the server to your PC via the network display: 80% usage of CPU, 100% disk, 30% network => the disk is the bottleneck, instead of having to use multiple individual tools.