
MB: X10SRi-F
PCIe 3 slot 5 x8
My setup has two pools:
Data pool is comprised of 4x 4TB HDD in RAIDZ2
- 2x Seagate IronWolf ST4000VN006-3CW104
- 1x WDC WD40EFPX-68C6CN0
- 1x WDC WD40EFZX-68AWUN0
machines pool is comprised of 2x 240GB NVMe M.2 on PCIe converter card in x8 slot bifurcated in BIOS in mirror:
- SAMSUNG MZVPW256HEGL-000L7
- Patriot M.2 P300 256GB
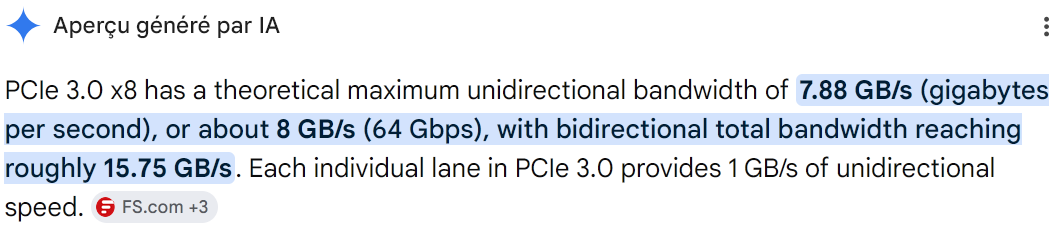
I ran some tests and unless I am mistaken, the HDD pool gives significant write performance than the SSD pool and HDD reads as fast as the SSD pool, maxing theoritical SATA 6GB
How is this possible ?
HDD pool write
truenas_admin@truenas[/mnt/Bassin/testpool]$ sudo fio --ramp_time=5 --gtod_reduce=1 --numjobs=1 --bs=1M --size=100G --runtime=60s --readwrite=write --name=testfile
testfile: (g=0): rw=write, bs=(R) 1024KiB-1024KiB, (W) 1024KiB-1024KiB, (T) 1024KiB-1024KiB, ioengine=psync, iodepth=1
fio-3.33
Starting 1 process
testfile: Laying out IO file (1 file / 102400MiB)
Jobs: 1 (f=1): [W(1)][100.0%][w=235MiB/s][w=235 IOPS][eta 00m:00s]
testfile: (groupid=0, jobs=1): err= 0: pid=2899517: Wed Jul 29 12:25:45 2026
  write: IOPS=254, BW=255MiB/s (267MB/s)(14.9GiB/60015msec); 0 zone resets
   bw (  KiB/s): min=34816, max=362496, per=100.00%, avg=260829.66, stdev=68093.48, samples=120
   iops        : min=   34, max=  354, avg=254.59, stdev=66.47, samples=120
  cpu          : usr=0.97%, sys=9.30%, ctx=15619, majf=0, minf=37
  IO depths    : 1=100.0%, 2=0.0%, 4=0.0%, 8=0.0%, 16=0.0%, 32=0.0%, >=64=0.0%
     submit    : 0=0.0%, 4=100.0%, 8=0.0%, 16=0.0%, 32=0.0%, 64=0.0%, >=64=0.0%
     complete  : 0=0.0%, 4=100.0%, 8=0.0%, 16=0.0%, 32=0.0%, 64=0.0%, >=64=0.0%
     issued rwts: total=0,15280,0,0 short=0,0,0,0 dropped=0,0,0,0
     latency   : target=0, window=0, percentile=100.00%, depth=1

Run status group 0 (all jobs):
  WRITE: bw=255MiB/s (267MB/s), 255MiB/s-255MiB/s (267MB/s-267MB/s), io=14.9GiB (16.0GB), run=60015-60015msec
HDD pool read
truenas_admin@truenas[/mnt/Bassin/testpool]$ sudo fio --ramp_time=5 --gtod_reduce=1 --numjobs=1 --bs=1M --size=100G --runtime=60s --readwrite=read --name=testfile
testfile: (g=0): rw=read, bs=(R) 1024KiB-1024KiB, (W) 1024KiB-1024KiB, (T) 1024KiB-1024KiB, ioengine=psync, iodepth=1
fio-3.33
Starting 1 process
Jobs: 1 (f=1): [R(1)][90.9%][r=6560MiB/s][r=6559 IOPS][eta 00m:02s]
testfile: (groupid=0, jobs=1): err= 0: pid=2903196: Wed Jul 29 12:27:17 2026
  read: IOPS=6082, BW=6083MiB/s (6378MB/s)(85.6GiB/14406msec)
   bw (  MiB/s): min= 2924, max= 6675, per=99.83%, avg=6072.30, stdev=1205.59, samples=28
   iops        : min= 2924, max= 6675, avg=6072.21, stdev=1205.65, samples=28
  cpu          : usr=0.77%, sys=99.19%, ctx=85, majf=0, minf=39
  IO depths    : 1=100.0%, 2=0.0%, 4=0.0%, 8=0.0%, 16=0.0%, 32=0.0%, >=64=0.0%
     submit    : 0=0.0%, 4=100.0%, 8=0.0%, 16=0.0%, 32=0.0%, 64=0.0%, >=64=0.0%
     complete  : 0=0.0%, 4=100.0%, 8=0.0%, 16=0.0%, 32=0.0%, 64=0.0%, >=64=0.0%
     issued rwts: total=87626,0,0,0 short=0,0,0,0 dropped=0,0,0,0
     latency   : target=0, window=0, percentile=100.00%, depth=1

Run status group 0 (all jobs):
   READ: bw=6083MiB/s (6378MB/s), 6083MiB/s-6083MiB/s (6378MB/s-6378MB/s), io=85.6GiB (91.9GB), run=14406-14406msec
SSD pool write
truenas_admin@truenas[/mnt/machines/testpool]$ sudo fio --ramp_time=5 --gtod_reduce=1 --numjobs=1 --bs=1M --size=100G --runtime=60s --readwrite=write --name=testfile
[sudo] password for truenas_admin:
testfile: (g=0): rw=write, bs=(R) 1024KiB-1024KiB, (W) 1024KiB-1024KiB, (T) 1024KiB-1024KiB, ioengine=psync, iodepth=1
fio-3.33
Starting 1 process
testfile: Laying out IO file (1 file / 102400MiB)
Jobs: 1 (f=1): [W(1)][100.0%][w=215MiB/s][w=215 IOPS][eta 00m:00s]
testfile: (groupid=0, jobs=1): err= 0: pid=2909168: Wed Jul 29 12:31:46 2026
  write: IOPS=184, BW=185MiB/s (194MB/s)(10.8GiB/60090msec); 0 zone resets
   bw (  KiB/s): min=133120, max=233939, per=100.00%, avg=189280.16, stdev=25145.60, samples=120
   iops        : min=  130, max=  228, avg=184.77, stdev=24.54, samples=120
  cpu          : usr=0.76%, sys=6.74%, ctx=11367, majf=0, minf=38
  IO depths    : 1=100.0%, 2=0.0%, 4=0.0%, 8=0.0%, 16=0.0%, 32=0.0%, >=64=0.0%
     submit    : 0=0.0%, 4=100.0%, 8=0.0%, 16=0.0%, 32=0.0%, 64=0.0%, >=64=0.0%
     complete  : 0=0.0%, 4=100.0%, 8=0.0%, 16=0.0%, 32=0.0%, 64=0.0%, >=64=0.0%
     issued rwts: total=0,11107,0,0 short=0,0,0,0 dropped=0,0,0,0
     latency   : target=0, window=0, percentile=100.00%, depth=1

Run status group 0 (all jobs):
  WRITE: bw=185MiB/s (194MB/s), 185MiB/s-185MiB/s (194MB/s-194MB/s), io=10.8GiB (11.6GB), run=60090-60090msec
SSD pool read
truenas_admin@truenas[/mnt/machines/testpool]$ sudo fio --ramp_time=5 --gtod_reduce=1 --numjobs=1 --bs=1M --size=100G --runtime=60s --readwrite=read --name=testfile
testfile: (g=0): rw=read, bs=(R) 1024KiB-1024KiB, (W) 1024KiB-1024KiB, (T) 1024KiB-1024KiB, ioengine=psync, iodepth=1
fio-3.33
Starting 1 process
Jobs: 1 (f=1): [R(1)][90.5%][r=6543MiB/s][r=6543 IOPS][eta 00m:02s]
testfile: (groupid=0, jobs=1): err= 0: pid=2913140: Wed Jul 29 12:33:28 2026
  read: IOPS=6505, BW=6505MiB/s (6821MB/s)(85.3GiB/13430msec)
   bw (  MiB/s): min= 4889, max= 6632, per=100.00%, avg=6507.02, stdev=333.38, samples=26
   iops        : min= 4889, max= 6632, avg=6506.96, stdev=333.53, samples=26
  cpu          : usr=0.59%, sys=99.38%, ctx=34, majf=0, minf=37
  IO depths    : 1=100.0%, 2=0.0%, 4=0.0%, 8=0.0%, 16=0.0%, 32=0.0%, >=64=0.0%
     submit    : 0=0.0%, 4=100.0%, 8=0.0%, 16=0.0%, 32=0.0%, 64=0.0%, >=64=0.0%
     complete  : 0=0.0%, 4=100.0%, 8=0.0%, 16=0.0%, 32=0.0%, 64=0.0%, >=64=0.0%
     issued rwts: total=87367,0,0,0 short=0,0,0,0 dropped=0,0,0,0
     latency   : target=0, window=0, percentile=100.00%, depth=1

Run status group 0 (all jobs):
   READ: bw=6505MiB/s (6821MB/s), 6505MiB/s-6505MiB/s (6821MB/s-6821MB/s), io=85.3GiB (91.6GB), run=13430-13430msec