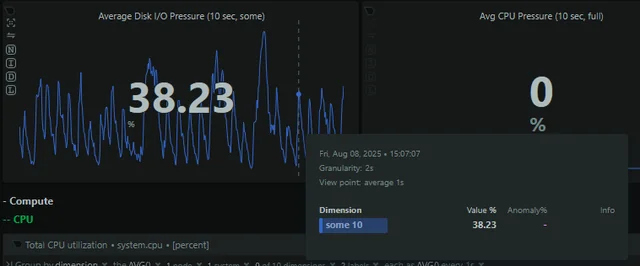
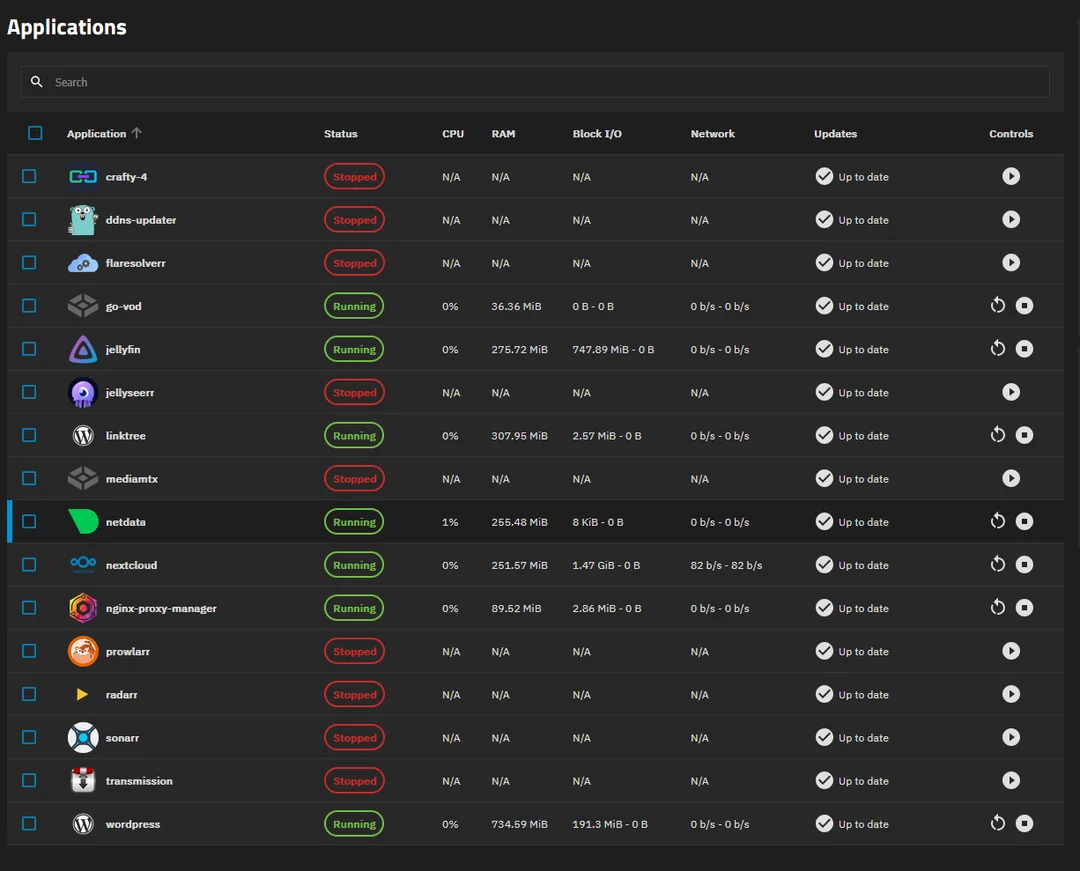
I have met with a weird issue which comes to me every so often causing me to reinstall TrueNAS completely. At the moment I have issue with incredibly high io wait and pressure on my system which I makes containers slow. I don’t have a lot of them and in fact I disabled most of them leaving only the important ones.
Even if I disable of my containers I still have 20-40% pressure and io wait present and I do not know how to get rid of it except reinstalling the system. What baffling me the most is that I use NVMe drives (Lexar 2TB M.2 PCIe NVMe NM620) which should not suffer of this problem at all yet they do. I have extended SMARTs setup on them and they come out clean.
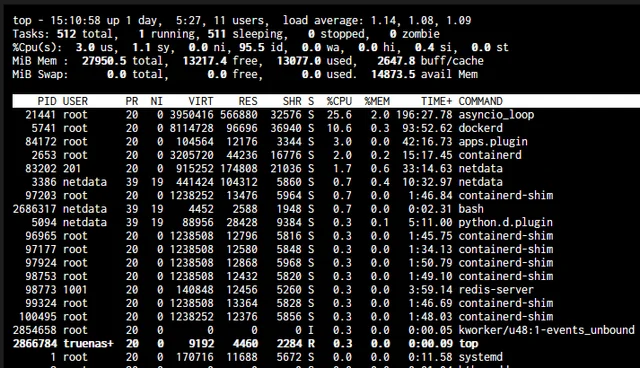
I noticed in htop that asyncio_loop and dockered do consume a lot of cpu. I have 5600G so I believe it shouldnt be a bottleneck for it. I do believe that those processes causes high IO usage but I dont know how to fix that
App Service also will fail to start after a system restart because docker simply times out. It was happening back on Eel 24.10 and now on 25.04 and I can’t go and reinstall truenas on my server every few month to resolve this issue so I hope I can find some help with that
How is this being performed?
Can you provide a list of hardware? You mentioned a few things but missed a lot. I don’t know if it could be a hardware issue or not.
What is your boot drive and how it is connected to the computer?
Oh yea absolutely.
The SMART is setup through truenas data protection page set to extended periodic every week with short ones daily
As of Hardware
2 Lexar drives setup in mirror. 2TB M.2 PCIe NVMe NM620
The boot drive is just a simple GOODRAM SATA SSD CX40
CPU: Ryzen 5600G
RAM: Kingston FURY 32GB (2x16GB)
All NVMe drives are connected to the motherboard since it has two slots for them and boot drive just connected to SATA 6Gb port
Have you actually examined the SMART test results? When you do, pay attention to the Power On Hours. If you find out that tests are actually being conducted, please post the output of smartctl -a /dev/nvme0 so we can see if it is true. While I have not changed to 24.05.2, I can say that 24.05.1 and all earlier SCALE releases do not actually test the NVMe drives, and there is a reason. I just wish the GUI said it is not operational yet as it leaves people to believe it is protecting them. But if you can prove me wrong, you would actually make me very happy. It would be a step in the correct direction.
This is the reason I asked. If you want to test NVMe drives, the easiest way is to look into running Multi-Report. Multi-Report is in the resources section and one of my links, if you find you need it.
It looks like the SMART does run. I will try to run that multireport too
=== START OF INFORMATION SECTION ===
Model Number:                       Lexar SSD NM620 2TB
Serial Number:                      NJK577R002038P110N
Firmware Version:                   SN11665
PCI Vendor/Subsystem ID:            0x1e4b
IEEE OUI Identifier:                0xcaf25b
Total NVM Capacity:                 2,048,408,248,320 [2.04 TB]
Unallocated NVM Capacity:           0
Controller ID:                      0
NVMe Version:                       1.4
Number of Namespaces:               1
Namespace 1 Size/Capacity:          2,048,408,248,320 [2.04 TB]
Namespace 1 Formatted LBA Size:     512
Namespace 1 IEEE EUI-64:            caf25b 03300000f3
Local Time is:                      Sun Aug 10 10:50:36 2025 CEST
Firmware Updates (0x1a):            5 Slots, no Reset required
Optional Admin Commands (0x0017):   Security Format Frmw_DL Self_Test
Optional NVM Commands (0x001f):     Comp Wr_Unc DS_Mngmt Wr_Zero Sav/Sel_Feat
Log Page Attributes (0x02):         Cmd_Eff_Lg
Maximum Data Transfer Size:         128 Pages
Warning  Comp. Temp. Threshold:     90 Celsius
Critical Comp. Temp. Threshold:     95 Celsius

Supported Power States
St Op     Max   Active     Idle   RL RT WL WT  Ent_Lat  Ex_Lat
 0 +     6.50W       -        -    0  0  0  0        0       0
 1 +     5.80W       -        -    1  1  1  1        0       0
 2 +     3.60W       -        -    2  2  2  2        0       0
 3 -   0.7460W       -        -    3  3  3  3     5000   10000
 4 -   0.7260W       -        -    4  4  4  4     8000   45000

Supported LBA Sizes (NSID 0x1)
Id Fmt  Data  Metadt  Rel_Perf
 0 +     512       0         0

=== START OF SMART DATA SECTION ===
SMART overall-health self-assessment test result: PASSED

SMART/Health Information (NVMe Log 0x02)
Critical Warning:                   0x00
Temperature:                        38 Celsius
Available Spare:                    100%
Available Spare Threshold:          10%
Percentage Used:                    15%
Data Units Read:                    9,863,736 [5.05 TB]
Data Units Written:                 83,786,651 [42.8 TB]
Host Read Commands:                 69,277,304
Host Write Commands:                1,412,936,804
Controller Busy Time:               8,581
Power Cycles:                       49
Power On Hours:                     11,697
Unsafe Shutdowns:                   25
Media and Data Integrity Errors:    0
Error Information Log Entries:      0
Warning  Comp. Temperature Time:    0
Critical Comp. Temperature Time:    0
Temperature Sensor 1:               38 Celsius
Temperature Sensor 2:               52 Celsius

Error Information (NVMe Log 0x01, 16 of 64 entries)
No Errors Logged

Self-test Log (NVMe Log 0x06)
Self-test status: No self-test in progress
Num  Test_Description  Status                       Power_on_Hours  Failing_LBA  NSID Seg SCT Code
 0   Extended          Completed without error                8624            -     -   -   -    -
 1   Extended          Completed without error                8622            -     -   -   -    -
 2   Extended          Completed without error                8622            -     -   -   -    -
Update: This is what multireport have given to me
2025/08/10,11:16:54,sda,SSD,G2P052343,PASSED,33,11714,97,---,---,---,---,---,---,---,---,---,---,0,---,4296228,2003104
2025/08/10,11:16:54,nvme0,NVM,NJK577R002038P110N,PASSED,40,11697,85,---,---,---,---,---,---,---,---,---,---,---,---,42899096,5050233
2025/08/10,11:16:54,nvme1,NVM,NJK577R004100P110N,PASSED,45,11682,87,---,---,---,---,---,---,---,---,---,---,---,---,43099588,5667392```Your NVMe drive is based on standard version 1.4 so it does support SMART testing. However TrueNAS does not as indicated by the data you provided.
There is a discrepancy of 3,073 hours from the time the last SMART test was run.
Glad you installed Multi-Report, it has just performed a test at hour 11697 and thankfully it tells you that it passed.
You should have received a nice email with a chart and much other data. This is to help you monitor your drives. The subject line should always end with “All is Good”. If it does not, let me know and we can identify what is going on as you would probably need to make a compensation/adjustment but it is not anything difficult.
Never get use to an error message, fix it so that when you do have an error, you react to is vice teling yourself it is the same old problem. It will bite people in the end.
And I realize this is not the topic of the thread but when I saw that you (and likely many others) are expecting TrueNAS to run this test on NVMe drives, I know it doesn’t. Not yet. Maybe in 25.10?
No I didn’t get the email. I guess I have set the email part of it incorrectly
But yes my main issue is with I/O usage which comes out of nowhere and I am ready to go for jira if no one has the answer
Read the Quick Start Guide, it has the info you are probably lacking. If that fails, send me a message and we will get it solved I think you will find the email informative.