Maybe a version or two ago, there was a link to what appeared to be a plugin that did reporting in TrueNAS Scale, where it gave a LOT of detail. Something about “reporting done right” - where did that go / is it coming back? Maybe it’s there but hidden? TBH, I didn’t notice when it disappeared exactly…as reporting is generally good when you’re in the process of troubleshooting things and, to be thankful, that isn’t needed.
The existing reports in Scale 25.04 leave a lot to be desired, even compared to TrueNas 13; things like L2ARC levels, IOPS for each disk; that added reporting certainly let me nerd out when I wanted to.
1 Like
Netdata is an APP in the catalog now. It was moved or removed for security. It should be in the release notes
The built-in Netdata UI, accessible from the Netdata button on the Reporting screen in TrueNAS 24.04 and 24.10, is removed in TrueNAS 25.04 (and later) for security hardening. Users wishing to continue using the Netdata UI to monitor system reports can install the Netdata application.
@jenksdrummer I know what you mean and agree completely. IMO at the very least it should also display read/write IOPs. I also come from Truenas Core 13 and the decrease in reporting functionality and quality makes Scale feel like it’s an unpolished demo rushed out the door to meet deadlines as apposed to a company with the mentality that we won’t ship it until it’s almost perfect.
Btw you should tag this post as SCALE so it’s also shown in that tag group.
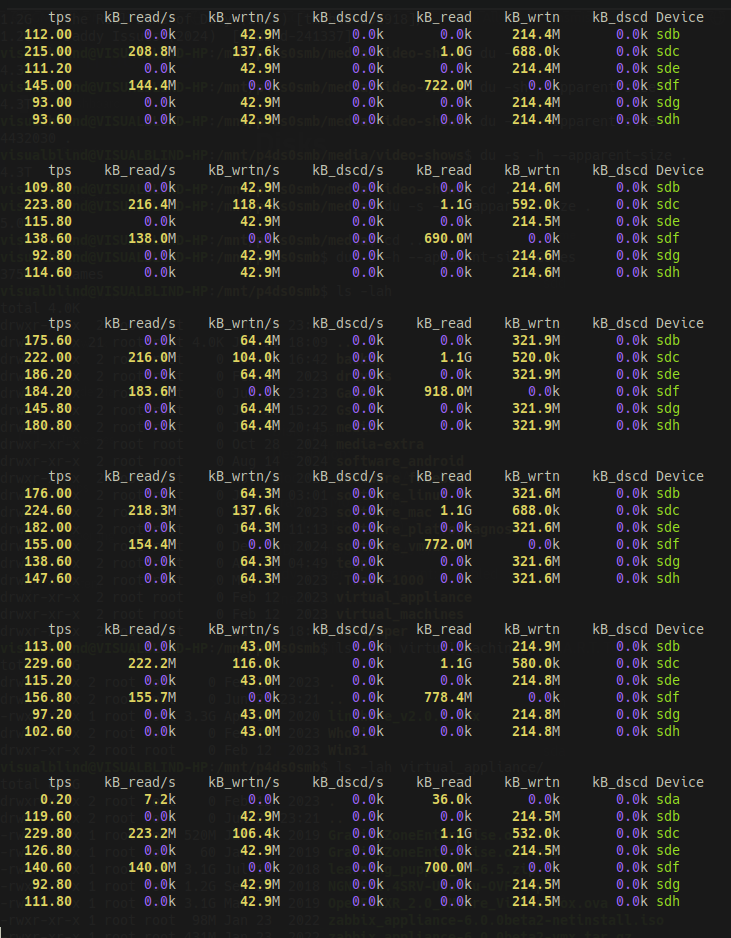
In addition to that it even reports incorrect numbers randomly, so I cannot even trust what I’m seeing. Forces me to go to the CLI for real numbers.
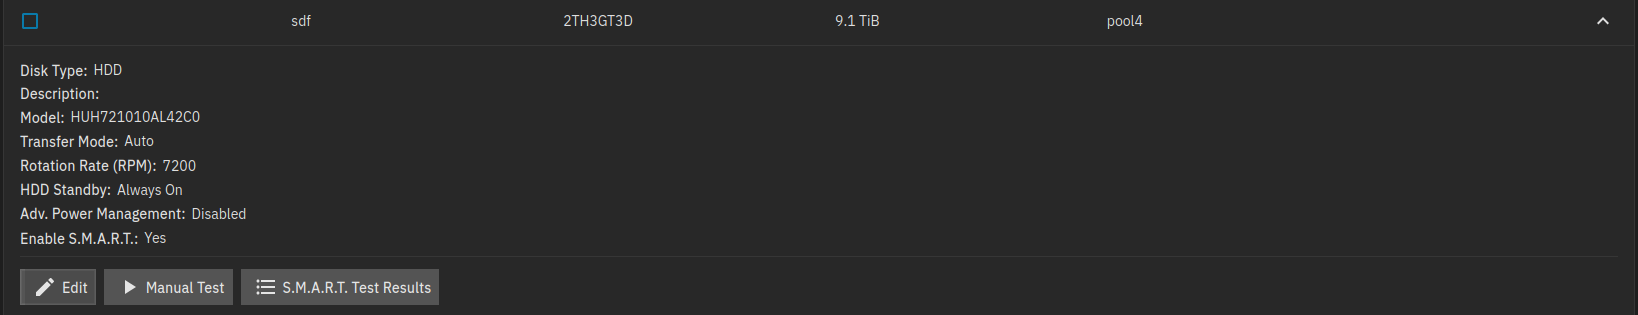
Here are some screenshots which report my mechanical HDD reading at almost 2 GiB/s while a simultaneous iostat is reporting read rate around ~200 MiB/s:
2 Likes