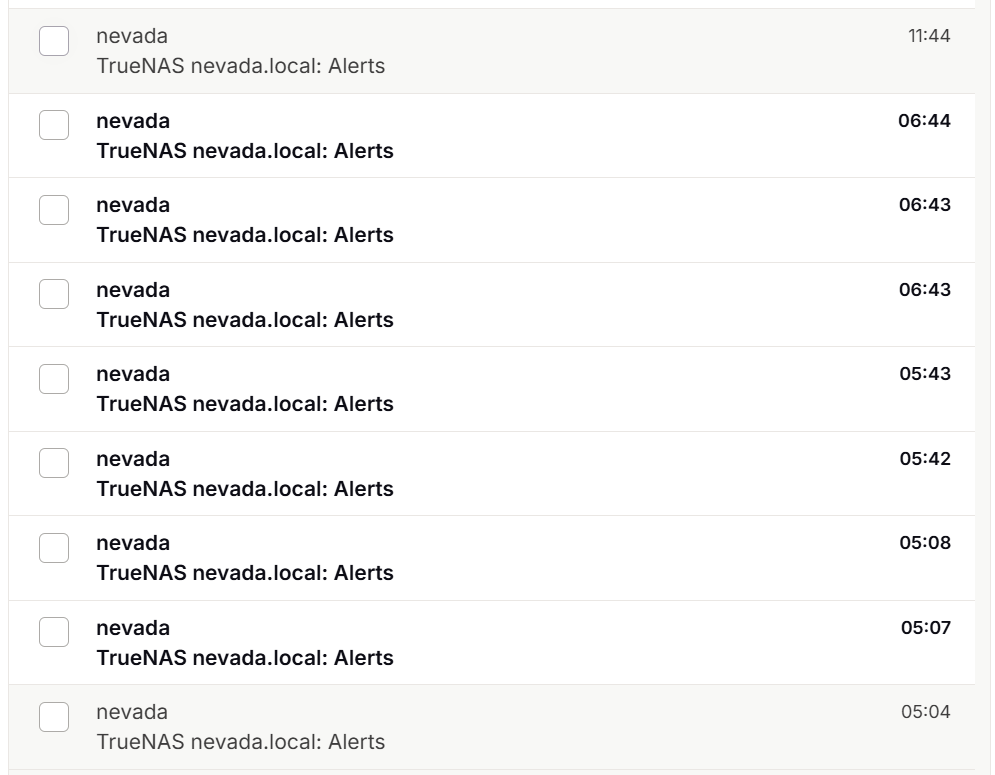
One of my boxes (TrueNAS-24.10.2.1) probably has a wonky cable or a broken drive (or two), but what surprised me is the way TrueNAS reports about this. For starters, this is my infra inbox for past few days:
Anyway, OK, intermittent error, could be, I’m rather being told than not and then complaining about TrueNAS trying to somehow filter or throttle reporting. Fine. But look at this:
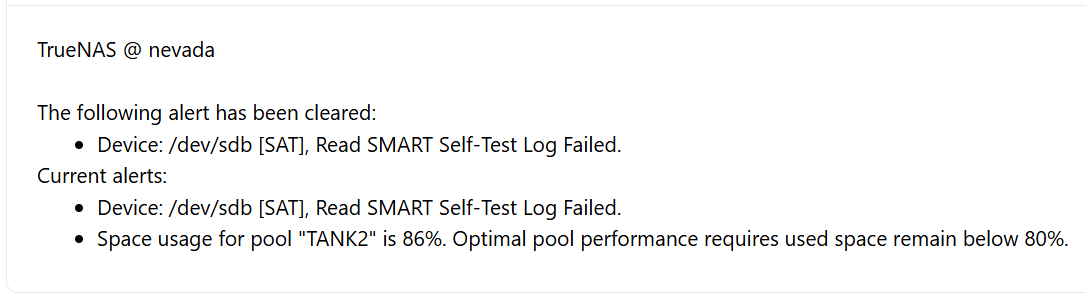
So SMART test has failed, but also fail has been cleared? How does that make any sense. More:
I am getting errors left and right:
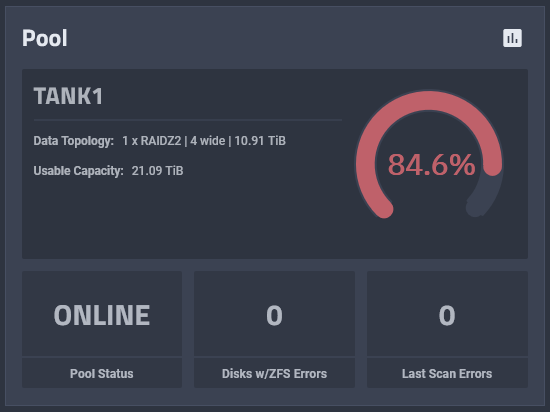
For two days, I’m getting errors about disk failures, degraded states, resilverings being initiated, etc. This is what I see when I log in: No errors or problems displayed in widget.
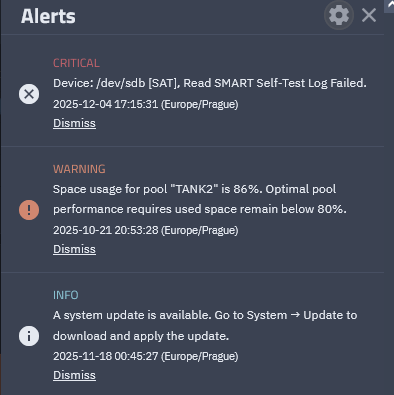
Nothing major in alerts either:
Full disk health even:
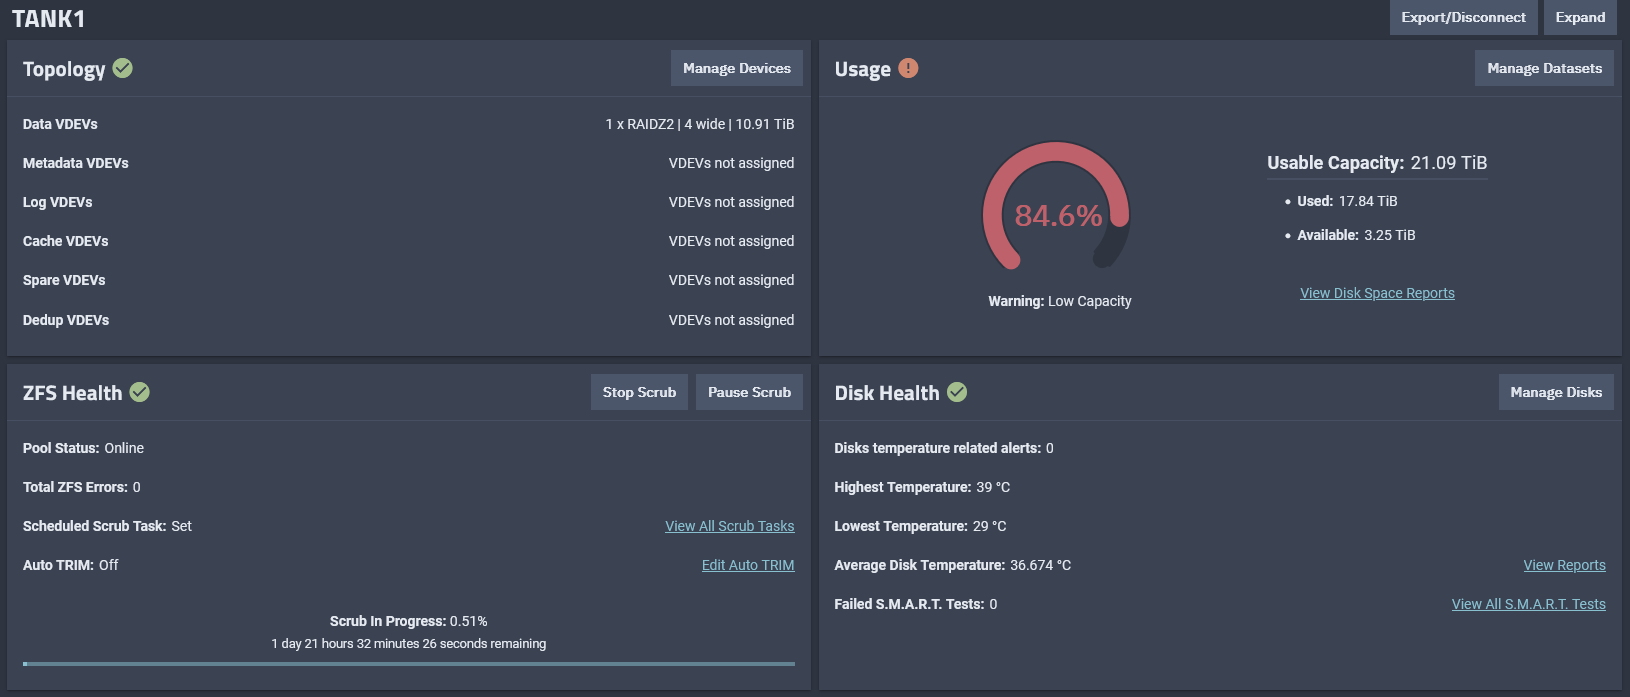
All I see is green checkmarks, while I’m getting bombarded with emails about failures and degraded state. Even non existing hardware is failing on me, look:
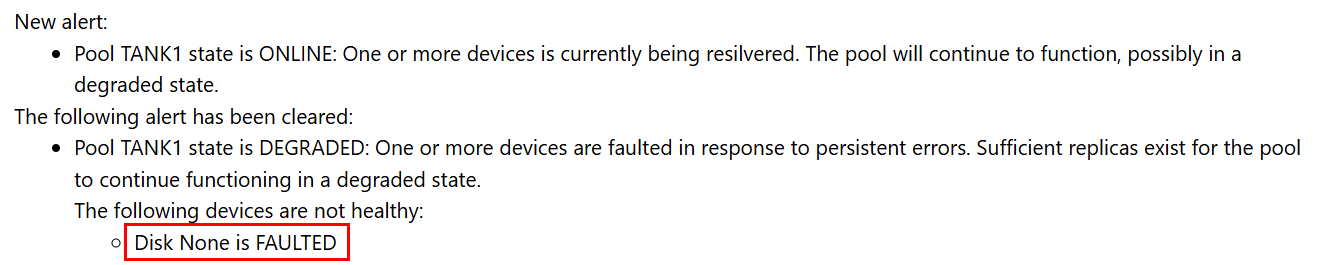
What am I doing wrong here? What am I not seeing?