Hello, was looking around, my CPU usage and temperature are not displaying any information. it was working before. i deleted the widget and added it back again, but no luck on displaying the information. I can see the information in the reporting tab.
1 Like
Same here. TrueNAS SCALE ElectricEel-24.10.1 on a ZimaCube Pro (i5-1235U) fresh install this morning on a 1TB NVMe boot drive.
2 Likes
I installed the fangtooth nightly on a new install and have neither memory widget information or cpu information.
Currently on TrueNAS-SCALE-25.04.0-MASTER-20250107-005622 although the initial install was from a few days ago.
Widgets having issues are :
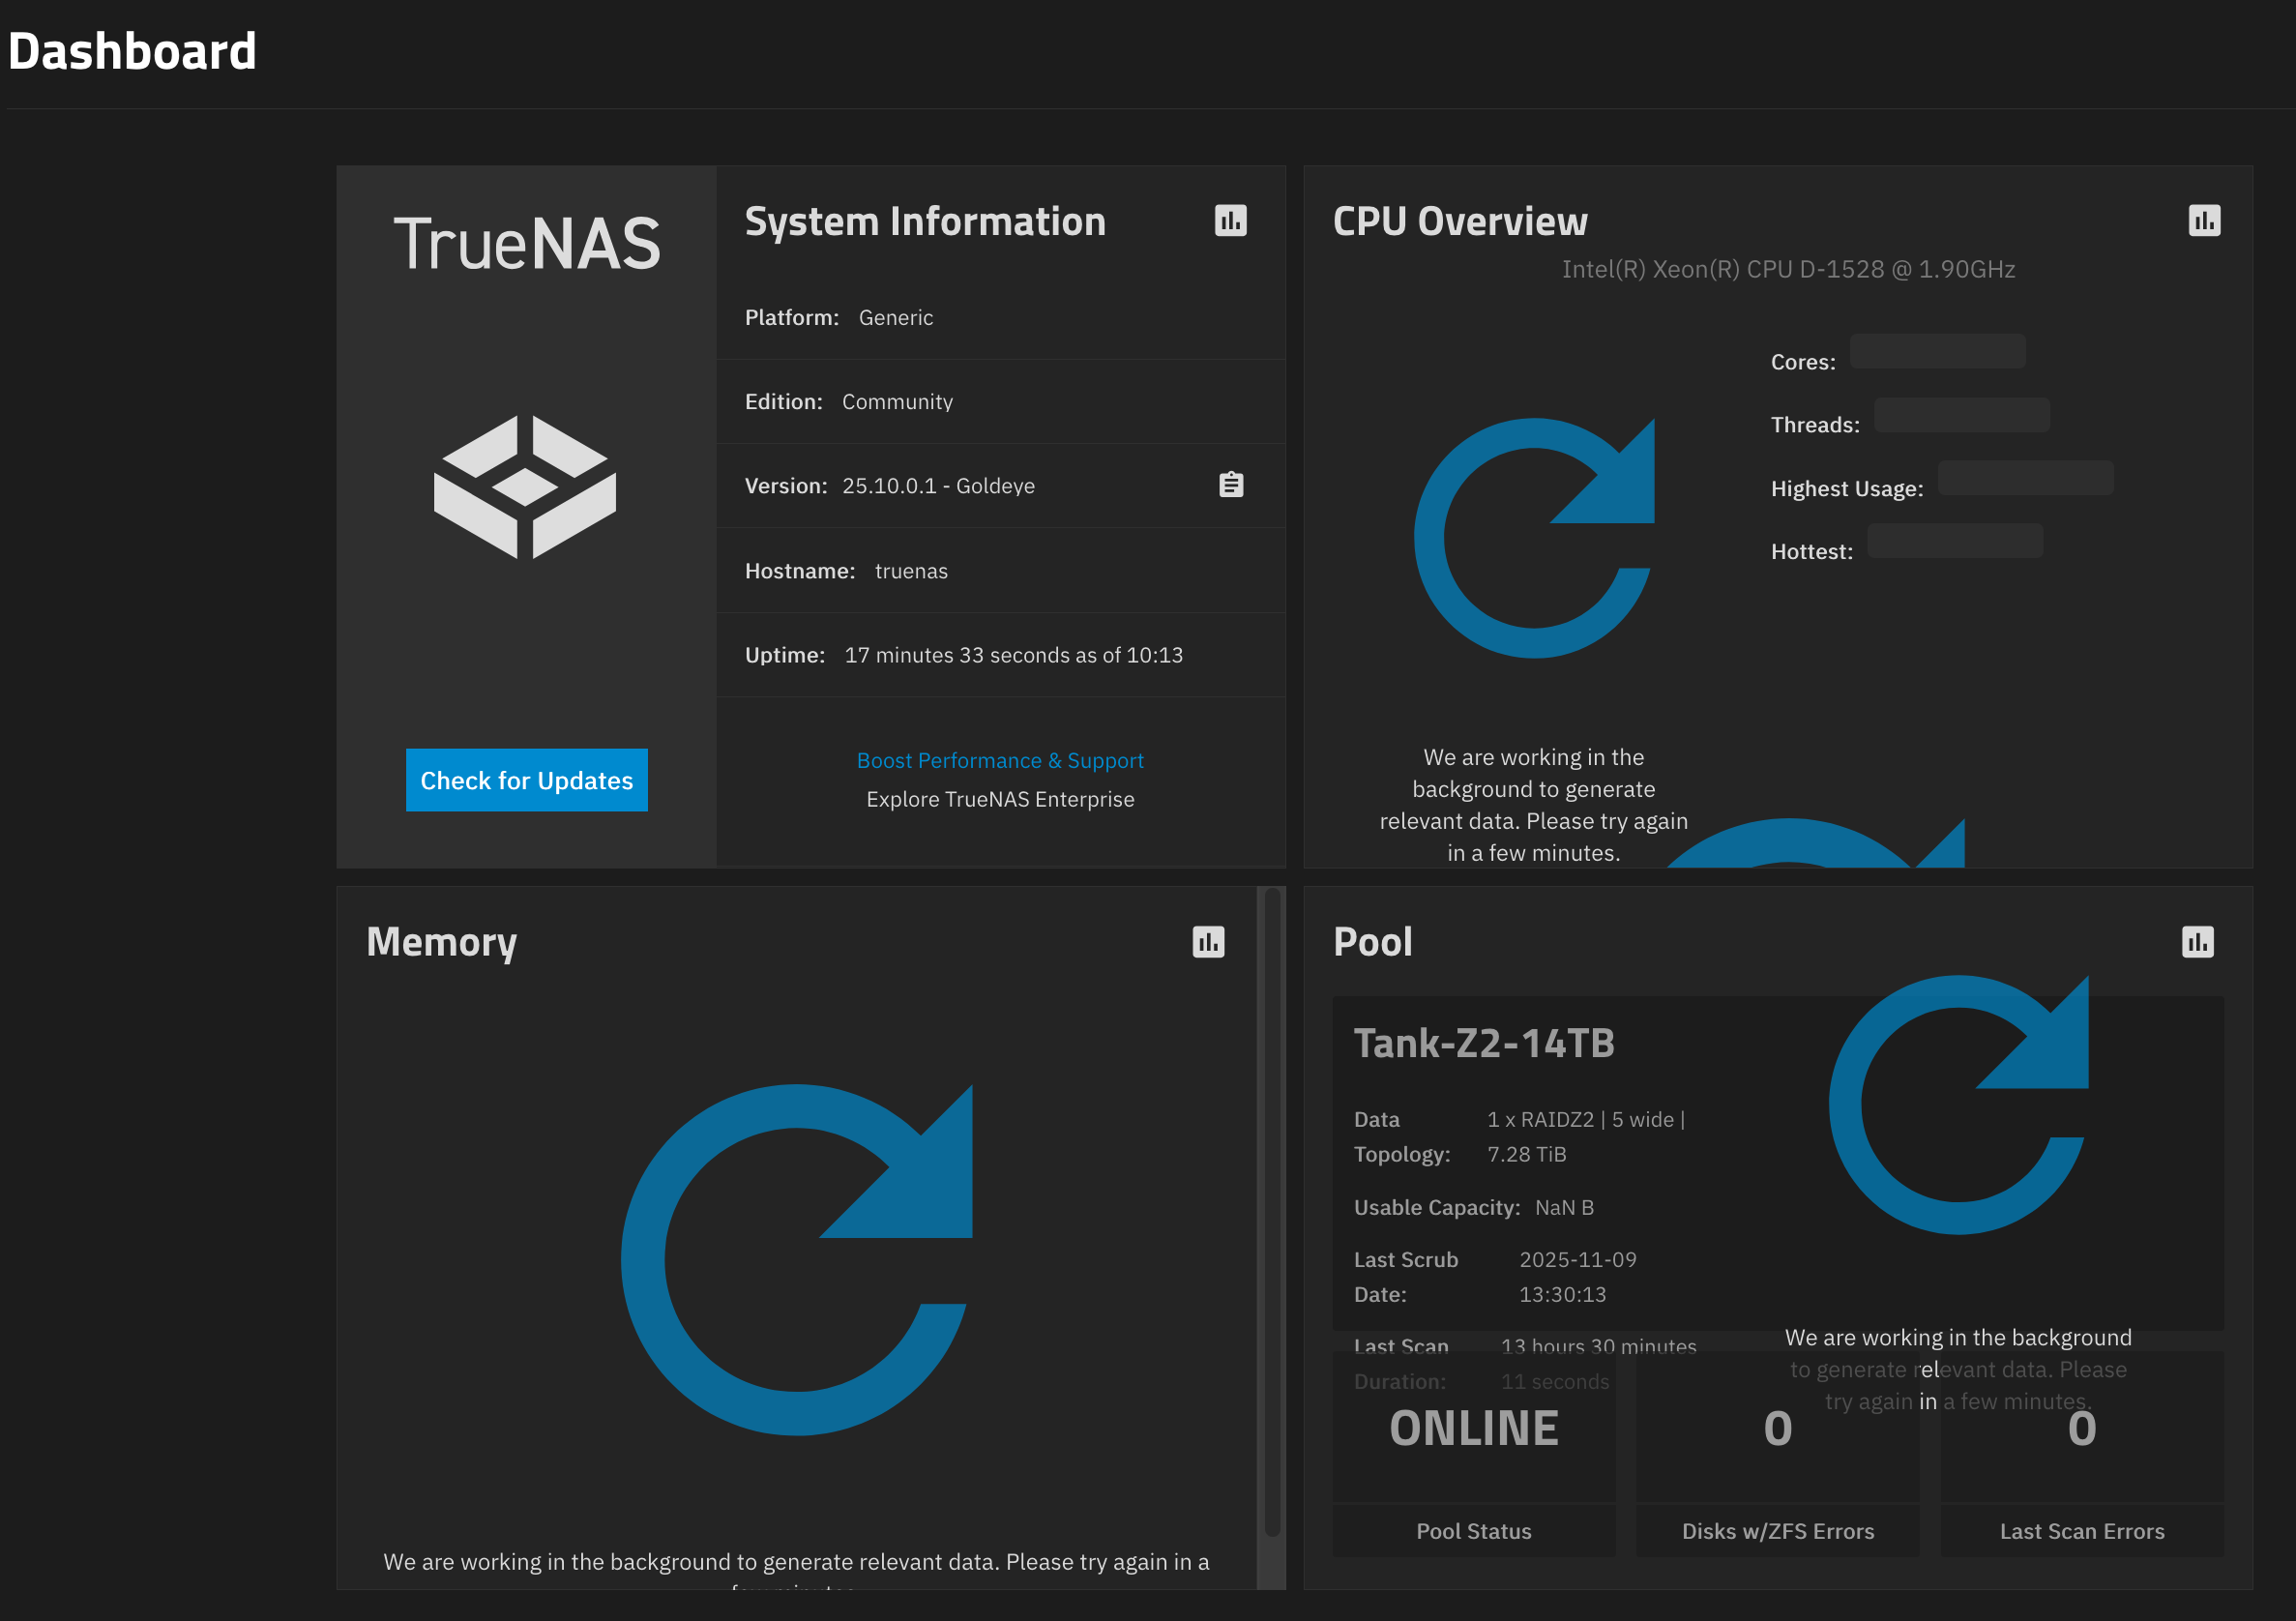
System Information
CPU Usage Per Core
CPU Temperature Per Core
CPU Usage
Memory
Resetting the widgets didnt help at all and present on Edge Chrome and also Safari and chrome on mobile ios. Inprivate browser sessions and clearing the cache dont do anything.
I have an i7 6700 with 64gb of ddr4 ram and os is running from a 1tb nvme. It a re purposed Dell precision. ![]()
localisations are set to GMT/English and 24 hour clock but I have changed this to see if this did anything so tried 12 hour format and 24 hour and change to US etc. Ive also tried removing all but one ofthe failed widgets to see if this did anyting following a resolution for a similar problem where someone removed the system information widget and resolved the problem.
I have also tried turning it off and on again.
Can see a lot of errors on the page which just keep climbing the longer you are on it
Access to fetch at '**************** has been blocked by CORS policy: No ‘Access-Control-Allow-Origin’ header is present on the requested resource. If an opaque response serves your needs, set the request’s mode to ‘no-cors’ to fetch the resource with CORS disabled.Understand this errorAI
store/:1
Failed to load resource: net::ERR_FAILEDUnderstand this errorAI
instrument.js:114 TypeError: Cannot read properties of undefined (reading ‘usage’)
at e.parseCpuData (cpu-core-bar.component.ts:125:32)
at Object.computation (cpu-core-bar.component.ts:42:23)
4 Likes
I have the same widget failure issues, through 3-4 OS updates now. My MOBO is a Supermicro X10SDV. The only thing that I found works is doing a full OS wipe and clean setup without restoring settings from a backup. However, as soon as another update comes along, it breaks the widgets again.
The version of TrueNAS you’re running is more useful than your motherboard model.
Just wanted to share a fix I found after struggling for hours with broken dashboard widgets in TrueNAS SCALE 25.04.0.
Problem:
Widgets like “CPU Usage”, “Memory”, “CPU Temperature”, and “System Information” weren’t showing any data. Resetting widgets, clearing cache, using different browsers, nothing helped. I could also see that reporting.get_data calls via midclt failed, and the netdata service kept restarting and crashing.
Root Cause:
Despite iX saying that Netdata is no longer used in SCALE 25, it turns out Netdata is still responsible for dashboard stats like CPU and memory. In my case, it failed to start because the following directory was missing:
/var/db/system/netdata/ix_state
This caused Netdata to crash with a “No such file or directory” error on startup, which broke all dashboard widgets that rely on it.
Solution:
- SSH into your TrueNAS system
- Manually recreate the missing directory:
Run this command:
“sudo mkdir -p /var/db/system/netdata/ix_state” - Restart the Netdata service:
Run this command:
“sudo systemctl restart netdata”
Immediately after doing this, all the CPU and memory widgets came back online, and the Netdata service stayed running.
Conclusion:
Even though Netdata isn’t exposed as clearly in the UI in newer SCALE versions, it’s still an essential component behind the dashboard stats. If you’re seeing blank widgets and can’t figure out why, it’s worth checking the status of the Netdata service (sudo systemctl status netdata) and scanning the journal for errors.
Hope this helps someone else avoid hours of frustration!
5 Likes
Tried this and wasn’t able to get my widget working. I’m on a fresh install of Truenas (25.04.2.4). When I checked the status of the netdata service in the command line it showed as “disabled”. Not sure where to proceed from here. Any ideas?
Edit: Rebooted my system after attempting the above fix and now the widgets are working. I had tried rebooting already, so it seems like the above fix was the solution, I just needed to reboot.
1 Like
I checked this and even though my directory exists, it shows disabled through status via SSH and I’ve restarted, the widgets don’t work.
Has anyone been able to figure this out?
I had the same issue on the dashboard, in logs I had form journalctl -b -0:
zed[191709]: eid=5757 class=data pool='apps' priority=0 err=52 flags=0x1008081 bookmark=283:133:0:26
Jan 10 12:31:17 truenas systemd[1]: netdata.service: Scheduled restart job, restart counter is at 927.
Jan 10 12:31:17 truenas systemd[1]: Started netdata.service - netdata - Real-time performance monitoring.
Jan 10 12:31:17 truenas netdata[191719]: CONFIG: cannot load cloud config '/var/lib/netdata/cloud.d/cloud.conf'. Running with internal defaults.
Jan 10 12:31:17 truenas netdata[191719]: 2026-01-10 12:31:17: netdata INFO  : MAIN : CONFIG: cannot load cloud config '/var/lib/netdata/cloud.d/cloud.conf'. Running with internal defaults.
Jan 10 12:31:17 truenas zed[191869]: eid=5758 class=data pool='apps' priority=0 err=52 flags=0x1008081 bookmark=283:133:0:26
Jan 10 12:31:17 truenas zed[191874]: eid=5759 class=data pool='apps' priority=0 err=52 flags=0x1008081 bookmark=283:133:0:26
Jan 10 12:31:17 truenas zed[191878]: eid=5760 class=data pool='apps' priority=0 err=52 flags=0x1008081 bookmark=283:133:0:26
Jan 10 12:31:17 truenas zed[191882]: eid=5761 class=data pool='apps' priority=0 err=52 flags=0x1008081 bookmark=283:133:0:26
Jan 10 12:31:17 truenas zed[191886]: eid=5762 class=data pool='apps' priority=0 err=52 flags=0x1008081 bookmark=283:133:0:26
Jan 10 12:31:17 truenas systemd[1]: netdata.service: Main process exited, code=exited, status=1/FAILURE
Jan 10 12:31:17 truenas systemd[1]: netdata.service: Killing process 191722 (netdata) with signal SIGKILL.
Jan 10 12:31:17 truenas systemd[1]: netdata.service: Failed with result 'exit-code'.
Jan 10 12:31:17 truenas zed[191891]: eid=5763 class=data pool='apps' priority=0 err=52 flags=0x1008081 bookmark=283:133:0:26
Jan 10 12:31:19 truenas systemd[1]: netdata.service: Scheduled restart job, restart counter is at 928.
Jan 10 12:31:19 truenas systemd[1]: Started netdata.service - netdata - Real-time performance monitoring.
Jan 10 12:31:19 truenas netdata[191938]: CONFIG: cannot load cloud config '/var/lib/netdata/cloud.d/cloud.conf'. Running with internal defaults.
Jan 10 12:31:19 truenas netdata[191938]: 2026-01-10 12:31:19: netdata INFO  : MAIN : CONFIG: cannot load cloud config '/var/lib/netdata/cloud.d/cloud.conf'. Running with internal defaults.
Jan 10 12:31:19 truenas zed[192089]: eid=5764 class=data pool='apps' priority=0 err=52 flags=0x1008081 bookmark=283:133:0:26
Jan 10 12:31:19 truenas zed[192093]: eid=5765 class=data pool='apps' priority=0 err=52 flags=0x1008081 bookmark=283:133:0:26
Jan 10 12:31:19 truenas zed[192097]: eid=5766 class=data pool='apps' priority=0 err=52 flags=0x1008081 bookmark=283:133:0:26
Jan 10 12:31:19 truenas zed[192101]: eid=5767 class=data pool='apps' priority=0 err=52 flags=0x1008081 bookmark=283:133:0:26
Jan 10 12:31:19 truenas zed[192105]: eid=5768 class=data pool='apps' priority=0 err=52 flags=0x1008081 bookmark=283:133:0:26
Jan 10 12:31:19 truenas systemd[1]: netdata.service: Main process exited, code=exited, status=1/FAILURE
Jan 10 12:31:19 truenas systemd[1]: netdata.service: Killing process 191941 (netdata) with signal SIGKILL.
Jan 10 12:31:19 truenas systemd[1]: netdata.service: Failed with result 'exit-code'.
Jan 10 12:31:19 truenas zed[192109]: eid=5769 class=data pool='apps' priority=0 err=52 flags=0x1008081 bookmark=283:133:0:26
and my pool had errors:
errors: Permanent errors have been detected in the following files:

        /var/db/system/netdata/netdata-meta.db
        /var/db/system/netdata/netdata-meta.db-wal
I am having some issues with my system, so corruptions on my pool was possible. I have stopped netadata, removed the db files and started netdata again:
systemctl stop netdata
rm /var/db/system/netdata/netdata-meta.db
rm /var/db/system/netdata/netdata-meta.db-wal
systemctl start netdata
Now it works and there are no errors from netdata