TLDR: Started getting Errors. During a scrub, I cleared the errors and ran another scrub during which power loss happened, and all drives got removed from the Pool. I reimported them and solved that problem, and got rid of errors. On the next scrub got errors again. Did memtest and found bad memory. I have replaced the memory now. (and Power supply, and have reseated all the cables to make sure nothing is loose) However, on scrub I get 16 Chksum Errors as soon as a scrub starts. (within the first 2 mins of the scrub) Which marks the pool as bad.
Originally it did list a faulty file. Which I deleted, (it was a journal file in but now this is the is the output of zpool status I am getting after a scrub. If i zpool clear i can get rid of the errors but they come back soon as i run another scrub.
pool: HDDs
state: ONLINE
status: One or more devices has experienced an error resulting in data
corruption. Applications may be affected.
action: Restore the file in question if possible. Otherwise restore the
entire pool from backup.
see: Message ID: ZFS-8000-8A — OpenZFS documentation
scan: scrub repaired 0B in 04:16:39 with 2 errors on Fri Jul 24 01:24:17 2026
expand: expanded raidz1-0 copied 11.5T in 11:38:55, on Sun Feb 15 15:54:57 2026
config:
In the old thread, 2 people asked you how the HBA is cooled. It seems you still rely on “the excellent airflow from a former gaming mini ITX case”.
This is not enough. There needs to be a fan directly strapped onto the heatsink of the HBA.
Same number of checksum errors on all drives point to a common denominator. You replaced bad RAM, PSU, reseated cables, but it seems you did not change the cooling of the HBA:
Also what does HexOS support say, since you paid them 199 USD ?
I have two 140MM fans blowing straight across the HBA. (it is a full ATX case not Mini ITX) The HBA does not feel uncomfortably hot to the touch. I will add another fan closer to the HBA now to get more cooling on it. However, I am pretty sure my problems were related to the bad RAM, which I have resolved. I think something was corrupted by that, and that has caused these errors.
That would be the next step to be sure. However, I am not sure these are real errors. I think a file somewhere is corrupted from the bad ram. When i did memtest on it it was a wall of read instantly. but zpool status is not giving me the file name. I get no other Errors at all apart from these 16 checksum errors right at the start of a scrub. (they all show up within the first 30seconds to a min of a scrub. Other than that, no other errors show up over the whole scrub.
Are there any logs i can look through to find details of what these checksum errors could be?
AFAIK, checksum errors, are just that, an error. ZFS will try to repair it. If that fails, it will show you there:
errors: Permanent errors have been detected in the following files:
IMHO, if your system really is healthy and there were just some errors at the start, you can just zfs clear and run the scrub again without any errors.
I have done a clear. But as soon as i run a scrub same thing the same 16 chksum errors in the first 30 second then the rest of the scrub goes fine and 0bytes repaired at the end.
I am currently running 2nd scrub of 2 back to back as i read a forum post on here that mentioned that can clear problems. Will see if that makes any differnce (i have cleared after each scrub previously, not tried back to back without a clear in the middle before)
That is exactly what i am thinking. I did have a higher number originally when i started having problems about 3k errors. But scrub repaired them. These 16 dont seem to want to go away.
Yes i am using -v
pretty much the scrub shows 2 errors (chksum count is 16. if i keep running status during the beginning scrub it goes to 8 then 16. so guesing these are the two errors.
Currently this is what i get from status after running 2 scrubs back to back without clearing (showing 32 chksums since it did 2 passes.
pool: HDDs
state: ONLINE
status: One or more devices has experienced an error resulting in data
corruption. Applications may be affected.
action: Restore the file in question if possible. Otherwise restore the
entire pool from backup.
see: Message ID: ZFS-8000-8A — OpenZFS documentation
scan: scrub repaired 0B in 04:23:38 with 2 errors on Fri Jul 24 12:10:56 2026
expand: expanded raidz1-0 copied 11.5T in 11:38:55, on Sun Feb 15 15:54:57 2026
config:
It does not show what files have the errors from this, Is there a more detailed log somewhere i can look at that may show me what files have these errors.
If i clear them i dont seem to get any errors unless i do a reboot or run a scrub.
I dont have snapshots turned on at the moment. Unless there are some background ones that i do not know about.
Thanks for all the help
Steve
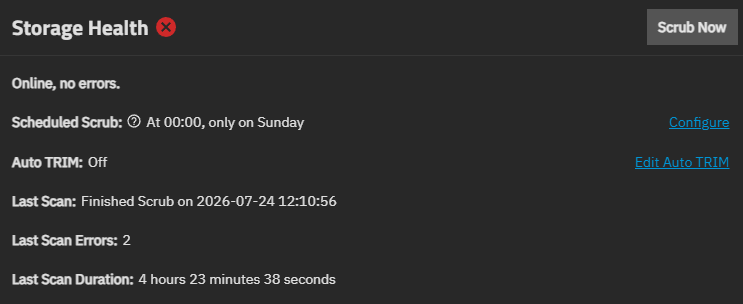
This is what the dashboard shows as the result of the last scrub
You can check the kernel messages to see if it hints at something.
You said that when you start a new scrub, the same errors immediately hit 8 and then 16? How soon does this happen?
Run a new scrub. Once you see it hits the first error, run this: journalctl -k --since "5 minutes ago"
See if anything lines up with hitting the first error. You will have to increase it to more than 5 minutes if you don’t catch the error soon enough. You don’t want too many messages, since you want to see if there’s anything that the kernel complains about around the time the scrub hits an error on the pool.
Hi, I tried that command and got this response, so tried again with sudo and got No entries
journalctl -k --since “5 minutes ago”
Hint: You are currently not seeing messages from other users and the system.
Users in groups ‘adm’, ‘systemd-journal’ can see all messages.
Pass -q to turn off this notice.
No journal files were opened due to insufficient permissions.
truenas_admin@LlanelwyNAS[~]$ sudo journalctl -k --since “5 minutes ago”
– No entries –
AFAIK corrupted files would show up in the ‘Permanent errors’ listing; these READ/WRITE/CKSUM in pool status are from the drive system (read/write from the drives themselves, checksum possibly from the backplane/cables/controller).
How long are your cables? Do you have other cables, preferably shorter (50 cm or less) to use instead?
Otherwise I suggest long SMART tests on all drives.
And sas2flash -list to check the status of the HBA.
sas2flash -list
LSI Corporation SAS2 Flash Utility
Version 20.00.00.00 (2014.09.18)
Copyright (c) 2008-2014 LSI Corporation. All rights reserved
    No LSI SAS adapters found! Limited Command Set Available!
    ERROR: Command Not allowed without an adapter!
    ERROR: Couldn't Create Command -list
    Exiting Program.
I have run full smart on all the drives and they come back clean.
They cables are the ones that came with the HBA I think they are under 50cm
I have output. But no idea what i am looking at though lol
log
1784903955 ffff99fa6406b300 dsl_scan.c:4533:dsl_scan_sync(): finish scan clearing for HDDs
1784903955 ffff99fa6406b300 dsl_scan.c:4569:dsl_scan_sync(): doing scan sync for HDDs txg 9869947; bm=1683/55858/0/1792
1784903960 ffff99fa6406b300 dsl_scan.c:2861:dsl_scan_visitds(): scanned dataset 1683 (HDDs/Media-Archive) with min=1 max=9869352; suspending=1
1784903970 ffff99fa6406b300 dsl_scan.c:4600:dsl_scan_sync(): scan visited 4292049 blocks of HDDs in 14692ms (1 os’s, 1159331 holes, 0 < mintxg, 0 in ddt, 0 > maxtxg)
1784903970 ffff99fa6406b300 bptree.c:226:bptree_iterate(): bptree index 0: traversing from min_txg=1 bookmark -1/0/0/1024
1784903970 ffff99fa6406b300 bptree.c:226:bptree_iterate(): bptree index 1: traversing from min_txg=-1 bookmark 0/0/0/0
1784903970 ffff99fa6406b300 bptree.c:226:bptree_iterate(): bptree index 2: traversing from min_txg=-1 bookmark 0/0/0/0
1784903970 ffff99fa6406b300 bptree.c:226:bptree_iterate(): bptree index 3: traversing from min_txg=-1 bookmark 0/0/0/0
1784903970 ffff99fa6406b300 bptree.c:226:bptree_iterate(): bptree index 4: traversing from min_txg=-1 bookmark 0/0/0/0
1784903970 ffff99fa6406b300 dsl_scan.c:4529:dsl_scan_sync(): begin scan clearing for HDDs
1784903975 ffff99fa6406b300 dsl_scan.c:4641:dsl_scan_sync(): scan issued 39117 blocks for HDDs (1 segs) in 5084ms (avg_block_size = 154171, avg_seg_size = 6034694144)
1784903975 ffff99fa6406b300 bptree.c:226:bptree_iterate(): bptree index 0: traversing from min_txg=1 bookmark -1/0/0/1024
1784903975 ffff99fa6406b300 bptree.c:226:bptree_iterate(): bptree index 1: traversing from min_txg=-1 bookmark 0/0/0/0
1784903975 ffff99fa6406b300 bptree.c:226:bptree_iterate(): bptree index 2: traversing from min_txg=-1 bookmark 0/0/0/0
1784903975 ffff99fa6406b300 bptree.c:226:bptree_iterate(): bptree index 3: traversing from min_txg=-1 bookmark 0/0/0/0
1784903975 ffff99fa6406b300 bptree.c:226:bptree_iterate(): bptree index 4: traversing from min_txg=-1 bookmark 0/0/0/0
1784903980 ffff99fa6406b300 dsl_scan.c:4641:dsl_scan_sync(): scan issued 38266 blocks for HDDs (1 segs) in 5082ms (avg_block_size = 154438, avg_seg_size = 5912256512)
1784903981 ffff99fa6406b300 bptree.c:226:bptree_iterate(): bptree index 0: traversing from min_txg=1 bookmark -1/0/0/1024
1784903981 ffff99fa6406b300 bptree.c:226:bptree_iterate(): bptree index 1: traversing from min_txg=-1 bookmark 0/0/0/0
1784903981 ffff99fa6406b300 bptree.c:226:bptree_iterate(): bptree index 2: traversing from min_txg=-1 bookmark 0/0/0/0
1784903981 ffff99fa6406b300 bptree.c:226:bptree_iterate(): bptree index 3: traversing from min_txg=-1 bookmark 0/0/0/0
1784903981 ffff99fa6406b300 bptree.c:226:bptree_iterate(): bptree index 4: traversing from min_txg=-1 bookmark 0/0/0/0
1784903986 ffff99fa6406b300 dsl_scan.c:4641:dsl_scan_sync(): scan issued 39000 blocks for HDDs (2 segs) in 5087ms (avg_block_size = 154503, avg_seg_size = 3013324800)
1784903986 ffff99fa6406b300 bptree.c:226:bptree_iterate(): bptree index 0: traversing from min_txg=1 bookmark -1/0/0/1024
1784903986 ffff99fa6406b300 bptree.c:226:bptree_iterate(): bptree index 1: traversing from min_txg=-1 bookmark 0/0/0/0
1784903986 ffff99fa6406b300 bptree.c:226:bptree_iterate(): bptree index 2: traversing from min_txg=-1 bookmark 0/0/0/0
1784903986 ffff99fa6406b300 bptree.c:226:bptree_iterate(): bptree index 3: traversing from min_txg=-1 bookmark 0/0/0/0
1784903986 ffff99fa6406b300 bptree.c:226:bptree_iterate(): bptree index 4: traversing from min_txg=-1 bookmark 0/0/0/0
1784903991 ffff99fa6406b300 dsl_scan.c:4641:dsl_scan_sync(): scan issued 36838 blocks for HDDs (1 segs) in 5086ms (avg_block_size = 154685, avg_seg_size = 5700780032)
1784903991 ffff99fa6406b300 bptree.c:226:bptree_iterate(): bptree index 0: traversing from min_txg=1 bookmark -1/0/0/1024
1784903991 ffff99fa6406b300 bptree.c:226:bptree_iterate(): bptree index 1: traversing from min_txg=-1 bookmark 0/0/0/0
1784903991 ffff99fa6406b300 bptree.c:226:bptree_iterate(): bptree index 2: traversing from min_txg=-1 bookmark 0/0/0/0
1784903991 ffff99fa6406b300 bptree.c:226:bptree_iterate(): bptree index 3: traversing from min_txg=-1 bookmark 0/0/0/0
1784903991 ffff99fa6406b300 bptree.c:226:bptree_iterate(): bptree index 4: traversing from min_txg=-1 bookmark 0/0/0/0
1784903996 ffff99fa6406b300 dsl_scan.c:4641:dsl_scan_sync(): scan issued 38002 blocks for HDDs (1 segs) in 5164ms (avg_block_size = 154724, avg_seg_size = 5881913344)
1784903997 ffff99fa6406b300 bptree.c:226:bptree_iterate(): bptree index 0: traversing from min_txg=1 bookmark -1/0/0/1024
1784903997 ffff99fa6406b300 bptree.c:226:bptree_iterate(): bptree index 1: traversing from min_txg=-1 bookmark 0/0/0/0
1784903997 ffff99fa6406b300 bptree.c:226:bptree_iterate(): bptree index 2: traversing from min_txg=-1 bookmark 0/0/0/0
1784903997 ffff99fa6406b300 bptree.c:226:bptree_iterate(): bptree index 3: traversing from min_txg=-1 bookmark 0/0/0/0
1784903997 ffff99fa6406b300 bptree.c:226:bptree_iterate(): bptree index 4: traversing from min_txg=-1 bookmark 0/0/0/0
If i understand that is where one scrub finished and another started. I may have to rerun it after the next scrub finished to get the start of the scrub properly