
Quick intro: I’m a random guy, a long-time TrueNAS user and i made this thing that the comunity might benefit from
Current features:
-
CPU average/max clock
-
Per-thread clock display
-
CPU temperature
-
GPU utilization, clocks, VRAM, power and temperature
-
Disk temperatures with health coloring
-
Runs in a lightweight Docker container on TrueNAS SCALE and gathers telemetry over SSH.
It’s still an early prototype and currently tested only on my own TrueNAS SCALE system (Ryzen + NVIDIA GPU). I’m gradually removing hardware-specific assumptions so it can adapt to different systems. but getting past this without test systems is likely beyond my ability. i will try tho! checkout what i built for my personal machine tho:
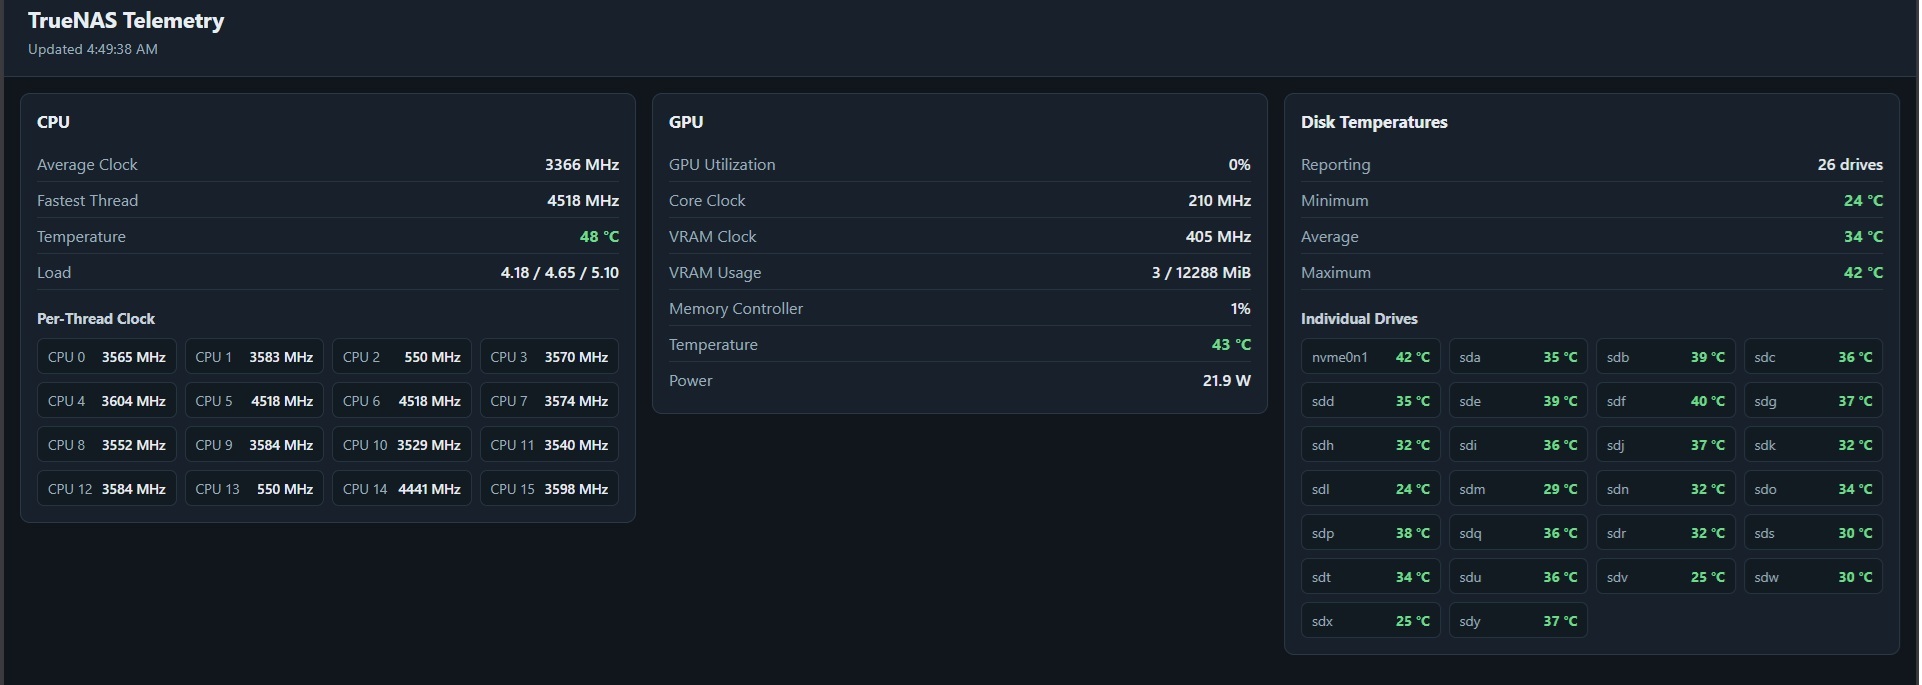
all of my drives are healthy temp and i have no intention of making them hot to demo - but the thesholds are as such:
Disks
-
 < 45°C
 -
 45–49°C
 -
 50°C+
50°C+
CPU/GPU
-
< 50°C
-
50–70°C
-
71°C+