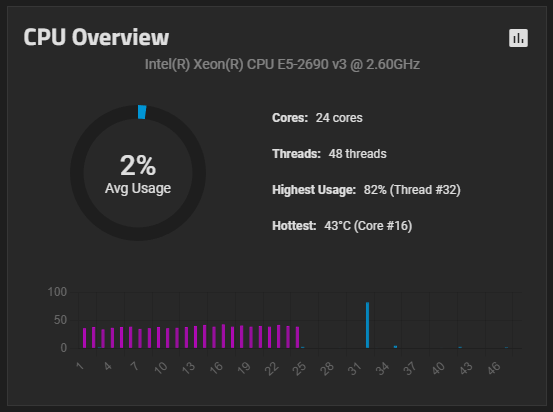
I just updated to 24.10.2 and now the CPU Overview widget only shows temperatures across half of the diagram. Load is shown for all cores/threads, but temperature stops half-way. This is new, it was perfectly fine before updating.
I would assume this is because there’s 24 cores in reality, but 48 threads… still, it’s confusing. So far, temperature was shown for each “vcore”.
There are many ways to tackle an issue like this UX-wise, but this isn’t one of the valid ones. This is confusing and borderline doesn’t make sense.
If the threads were grouped in groups of however-many you have per core and there was a single temperature reading for the group, that would be OK. But now, as it is currently, the graph makes no sense.
In my screenshot, you see thread 33 (is it 33?) peaking. Which core is that? How hot is that core? There’s no way to tell.
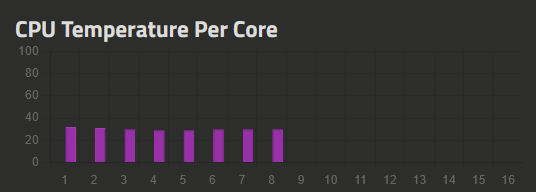
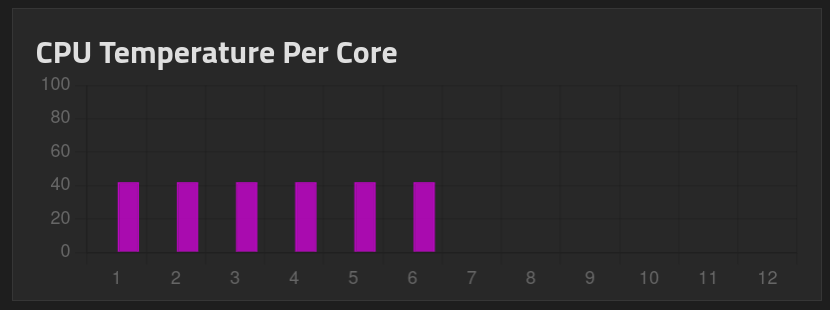
I see what you mean. I was going to suggest you just use separate widgets for temp and usage but when I checked “CPU Temperature Per Core” it still shows the number of threads… I’d have to agree that it doesn’t make much sense.
I think the “easiest” way for iX to fix this would just be to double the temperatures across every thread for clarity, otherwise they’d have to find a way to double up the thread usage per core in the graph and that might be more complicated.
Your screenshot is showing the info right above for Highest Usage & Hottest. Thread #32 and Core #16.
Also, have you tried mousing over the graph to see if you get any tool tip with the info? You can do that for the ZFS graph and see info for the graph. I don’t have a Scale machine to test on.
I understand that with some forensics and investigation, I can probably figure out what is what in there, but that shouldn’t be the way to use a chart… A chart should make information easily readable and readily available. I too can come up with all kinds of explanations, but that would not make this chart any more useful.
If there is only one temp reading per core/thread pair, then either the info should be duplicated (as it probably was until now) or these should be grouped in groups of three (bar for core, bar for thread belonging to core and temperature)… There are several ways of doing it right. This is not one of them.
Go to your TrueNAS GUI and in the upper right corner find the Smile icon. It’s Feedback / Submit A Bug. You can use that to give feedback to iX Systems.
Actually you’re absolutely right… Thank you! I was under the false impression that they would somehow look in here for issues, but you’re 100% right. Thanks for pointing this out!
Well. What runs across the x axis? The axis has no label but the chart title says ”temp per core”. So you’d be forgiven to believe it represents cores. Except it doesn’t (threads). Except threads don’t have temperatures. Fairly obvious that it doesn’t make sense I think - strictly speaking - even though most will be able to see through it and understand what the GUI is trying to show although executed badly.
Thanks for the quick reply pmh. Before the last update, the temperature was shown on all 16 threads. Why is the graph showing all 16 threads if it is only showing core temp? Cheers!