Cannot saturate disk IO or CPU on writes

Hello,

TL;DR:
Why RAIDZ2 write performance peaks while leaving 20% idle time on HDDs and well over 50% idle CPU? In other words, what prevents local large sequential writes from hitting 100% utilization on HDDs (or CPU)?

Configuration:

  • TrueNAS CORE 13.0-U6.4
  • Supermicro X10SDV-4C-TLN2F
  • Intel Xeon D-1521 @ 2.40GHz, 4C/8T, AES-NI
  • 64GB ECC DDR4 RAM
  • 6x 10TB WD101EFBX (WD RED Plus)
  • RAIDZ2, SHA512, GELI encryption, no compression, no dedup, no atime
  • pool is healthy
  • HDDs are thoroughly tested and fine

Testing write speed locally on NAS via ssh gives me roughly 220MiB/s with no substantial difference between single- and multi-threaded performance.

#Single-threaded (~70% disk busy time), before 12:55 on charts
dd if=/dev/zero of=test.tmp bs=1G count=1024

#Multi-threaded (~80% disk busy time), after 12:55 on charts
for i in {1..8}; do dd if=/dev/zero of=test${i}.tmp bs=1G count=1024 & done;

CPU can be saturated to 100% by running (easily above 10GiB/s of combined throughput)

for i in {1..8}; do dd if=/dev/zero of=/dev/null bs=1G count=1024 & done;

HDDs can be briefly saturated by reading temp files created earlier. This gives me well over 700MiB/s of total combined read throughput.

#Multi-threaded read-saturation, after 13:42 on the chart
for i in {1..8}; do dd if=test${i}.tmp of=/dev/null bs=1G count=1024 & done;

Thanks!

P.S. Apparently, I cannot post images so no charts this time. :frowning:

Might be RAM capacity, might be the drives themselves. I am not too familiar with dd.
Try running solnet-array-test | TrueNAS Community as a way to standardize the test (or go with fio).

Thank you for suggestion, I will take a look at it.
however, as stated in the description to solnet-array-test:

Note that the only things that touch the disks are “dd” and they’re all structured as “dd if=/dev/${disk}”.

So it does use dd under the hood.

Please also note that I am not asking “why my array is slow”. I am asking why TrueNAS CORE / OpenZFS is not using 100% of system resources available to it to reach maximum write performance (whatever it might be). An observed 80% disk busy cap for writes looks to me like a some sort of an artificial throttling policy rather than a natural system bottleneck.

Since I’m not familiar with dd, using a standard test as reference is useful to rule out issues in the artificial benchmark.

Under the right circumstances my drives reach 100% of their declared performance, so I think the issue may lay in the benchmark.

Which results are you expecting? Please read iX's ZFS Pool Layout White Paper.

Given an infinite supply of ideally formatted and locally-presented work (large sequential writes driven by dd, be that single or multi-threaded), I would expect the system to settle into a steady state where either its CPU or HDDs are busy doing work at least 99% of time. In case of any RAID, I would settle for 99% busy time on any one HDD (the slowest one for whatever reasons), which clearly is not what I see. Note that “100% busy” is not the same as reaching 100% of manufacturer’s advertised peak throughput. It merely means that the drive is never idle, “doing its best”. So if I do not see a single drive being close to 100% busy, that implies that the system had not given it any work to do. Typically that would mean that the CPU (chunking, hashing, encoding, encrypting, etc) cannot keep up with the drives. Except in that case the CPU would be pegged to 100% (system+user+interrupts+etc), which is far from being the case here.

Hence the question: if an infinite supply of ideal work is presented to the system, why does the system chooses not to use all of the otherwise idle time available to process it?

As for dd… well, it is the simplest most basic IO tool, had been part of Unix since 1974 dd (Unix) - Wikipedia.

Due to how ZFS works, you might be capped by your RAM size. Note this is a possibility that should be verified through testing.

Please cd into /mnt/hddpool and run the following, then post the output.

fio --name TEST --eta-newline=5s --ioengine=posixaio --rw=write --size=150g --io_size=650g --blocksize=128k --iodepth=16  --numjobs=8 
--runtime=120 --group_reporting

After that, remember to delete the spawned file in order to avoid wasting space.


Do note that GELI encryption is no longer supported by TN since 12.0-U1. Storage Encryption | TrueNAS Documentation Hub
@winnielinnie do you think this could be the cause of the performance gap?

Highly doubtful. GELI uses AES acceleration, just like LUKS and native ZFS encryption.

1 Like

@sliakh how are you connceting the drives to the motherboard?

Correct. I’ve been using it since 2017, and it had been (and still is) available and fully supported on FreeBSD since v6, released in 2005. At this point, it is just as solid as any other part of BSD Kernel itself.

Even if it did not use AES-NI for whatever reason, it would do everything in pure software. In that case I would see very high CPU usage and that would have created a potential bottleneck. But the issue is that CPU is not the bottleneck in this case, so GELI or not AES-NI or not is irrelevant.

6x onboard SATA3 (6Gbps) ports via SoC

The issue is NOT with the drives, nor how they are connected (they’ve been tested separately and do deliver performance pretty close to what WD claims). The issue is that IO scheduler makes a decision not to schedule enough IO for the drives to stay above 80% HDD duty cycle.

It cannot be RAM either. 64GB is way more than enough, considering that OpenZFS recommends 2GB, FreeBSD recommends 4GB “for comfortable use”, and TrueNAS documentation states that 8 is enough for stable operation in NAS capacity.

Further, if it were RAM, then we would see a CPU thrashing at 100% as it would have to constantly shuffle around data in much smaller chunks, processing them, freeing, and zeroing out as part of new allocation for next small block. The CPU is more than 50% idle.

Note that OpenZFS (upstream of TrueNAS) does not recommend native ZFS encryption in combination with send/recv. Until that issue is addressed (Linux and BSD, mind you), I’ll stay on GELI, thank you very much. :wink:

Further, as I understand, whole CORE is about to become unsupported. But that does not mean it will suddenly stop working.

# fio --name TEST --eta-newline=5s --ioengine=posixaio --rw=write --size=150g --io_size=650g --blocksize=128k --iodepth=16  --numjobs=8 

TEST: (g=0): rw=write, bs=(R) 128KiB-128KiB, (W) 128KiB-128KiB, (T) 128KiB-128KiB, ioengine=posixaio, iodepth=16
...
fio-3.28
Starting 8 processes
TEST: Laying out IO file (1 file / 153600MiB)
Jobs: 8 (f=8): [W(8)][0.1%][w=237MiB/s][w=1899 IOPS][eta 03h:49m:22s]
Jobs: 8 (f=8): [W(8)][0.1%][w=294MiB/s][w=2355 IOPS][eta 04h:20m:58s] 
Jobs: 8 (f=8): [W(8)][0.1%][w=319MiB/s][w=2551 IOPS][eta 04h:38m:08s] 
Jobs: 8 (f=8): [W(8)][0.1%][w=313MiB/s][w=2500 IOPS][eta 04h:44m:16s] 
Jobs: 8 (f=8): [W(8)][0.2%][w=333MiB/s][w=2665 IOPS][eta 04h:40m:17s] 
Jobs: 8 (f=8): [W(8)][0.2%][w=329MiB/s][w=2632 IOPS][eta 04h:40m:48s] 
...
Jobs: 8 (f=8): [W(8)][3.1%][w=346MiB/s][w=2771 IOPS][eta 04h:45m:50s] 
Jobs: 8 (f=8): [W(8)][3.1%][w=323MiB/s][w=2581 IOPS][eta 04h:45m:41s] 
Jobs: 8 (f=8): [W(8)][3.2%][w=274MiB/s][w=2194 IOPS][eta 04h:45m:31s] 
Jobs: 8 (f=8): [W(8)][3.2%][w=302MiB/s][w=2413 IOPS][eta 04h:45m:20s] 
Jobs: 8 (f=8): [W(8)][3.2%][w=302MiB/s][w=2416 IOPS][eta 04h:45m:11s] 
Jobs: 8 (f=8): [W(8)][3.3%][w=324MiB/s][w=2589 IOPS][eta 04h:44m:57s] 
Jobs: 8 (f=8): [W(8)][3.3%][w=262MiB/s][w=2096 IOPS][eta 04h:45m:20s] 
Jobs: 8 (f=8): [W(8)][3.3%][w=291MiB/s][w=2326 IOPS][eta 04h:45m:10s] 
...

Disk Busy: ~75%
CPU usage: ~45%

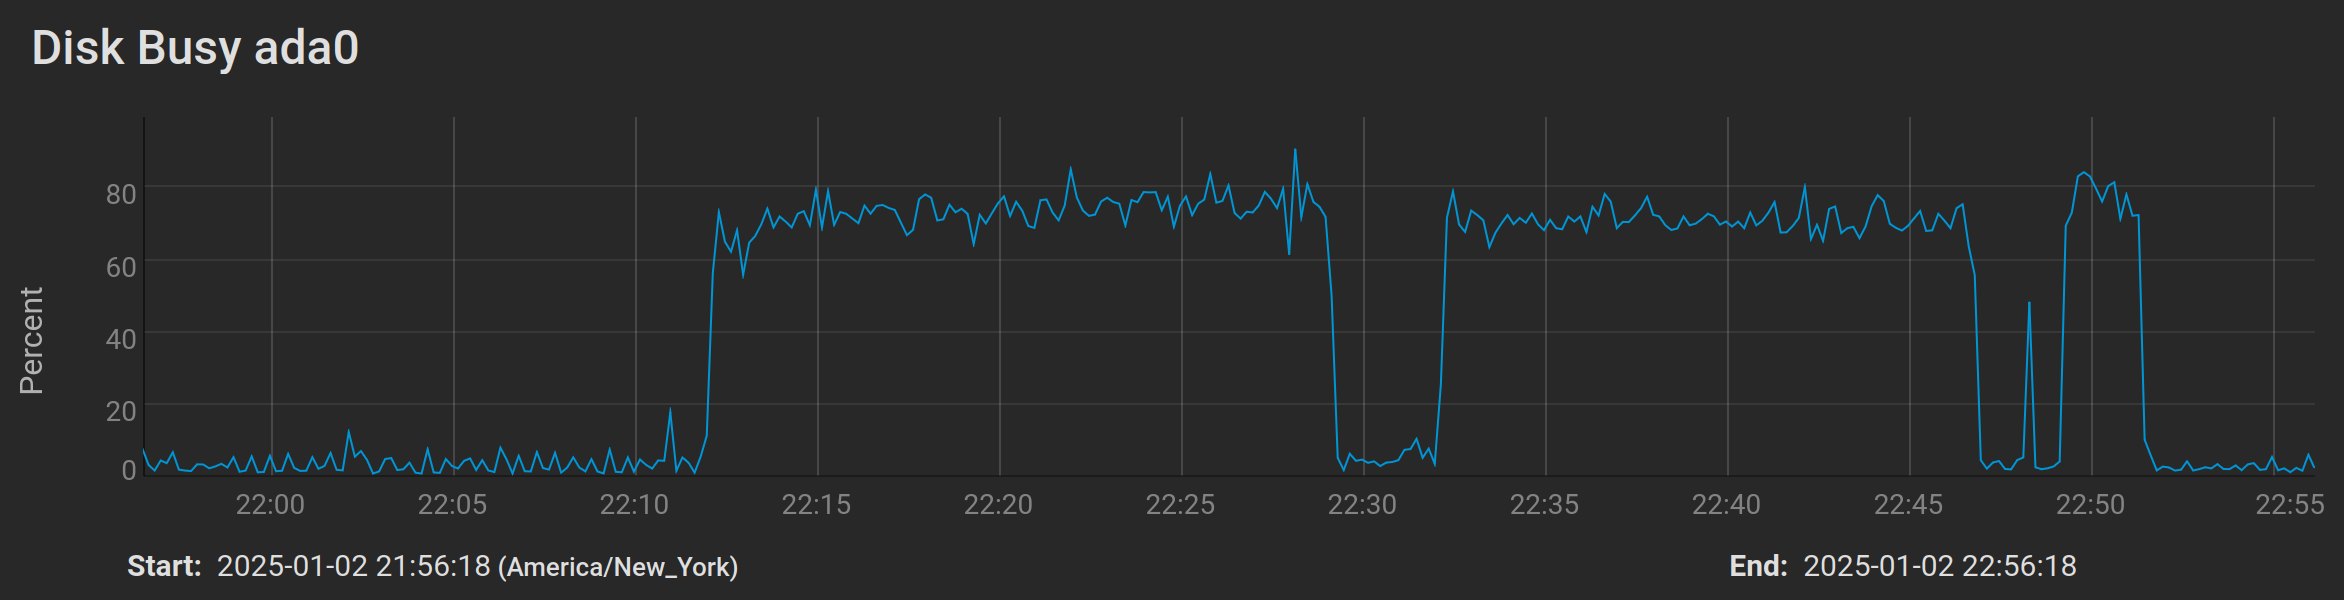
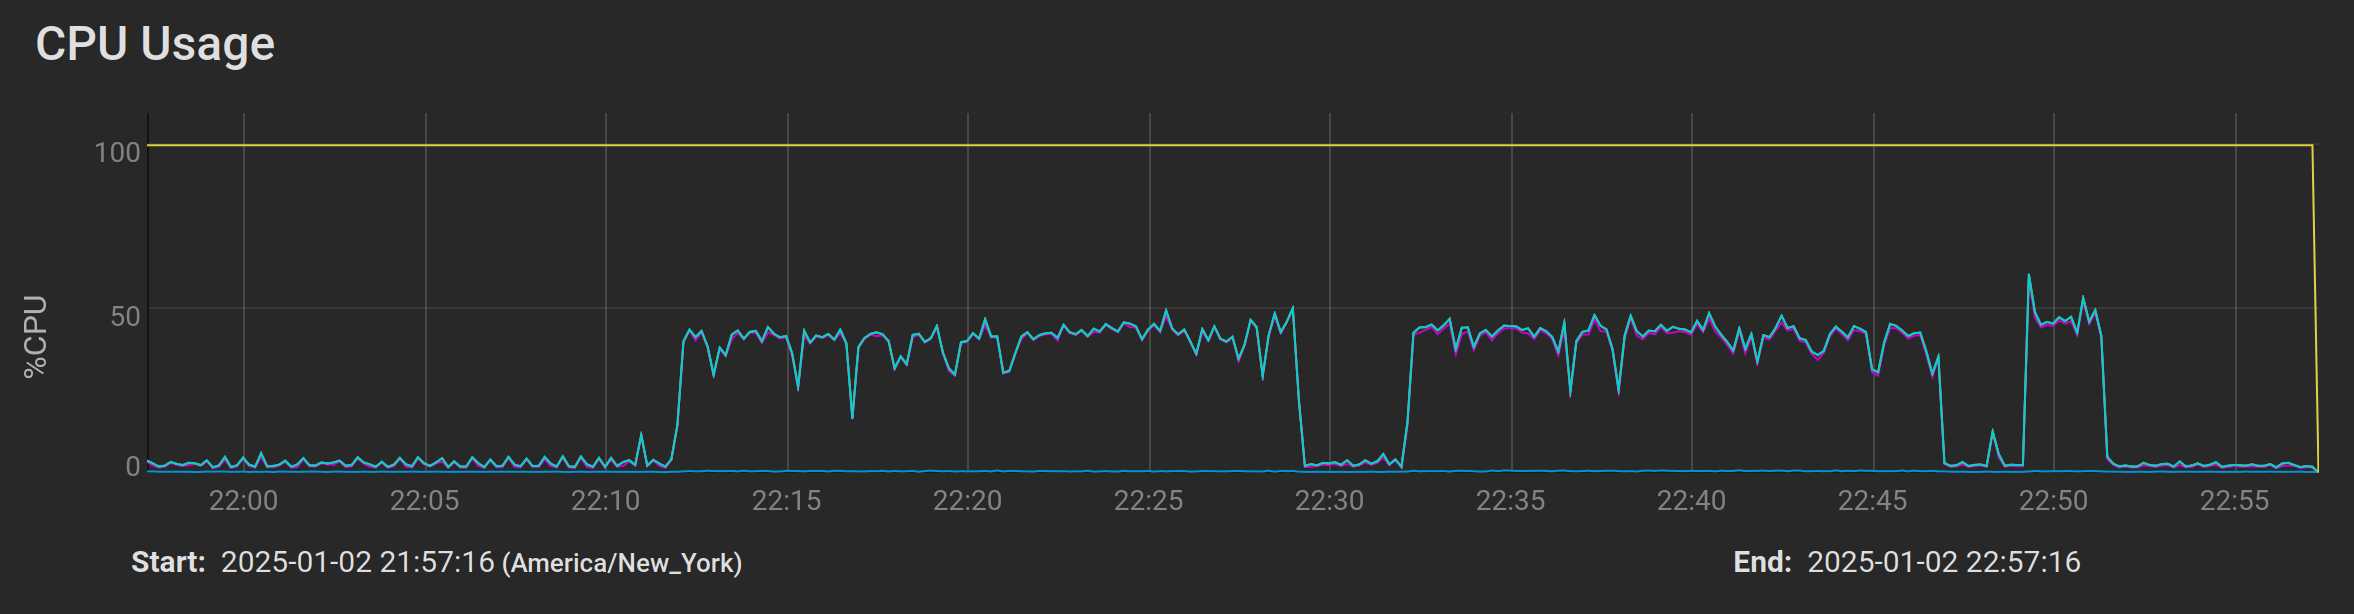
and here is the short 2-minute run

# fio --name TEST --eta-newline=5s --ioengine=posixaio --rw=write --size=150g --io_size=650g --blocksize=128k --iodepth=16  --numjobs=8  --runtime=120 --group_reporting
TEST: (g=0): rw=write, bs=(R) 128KiB-128KiB, (W) 128KiB-128KiB, (T) 128KiB-128KiB, ioengine=posixaio, iodepth=16
...
fio-3.28
Starting 8 processes
TEST: Laying out IO file (1 file / 153600MiB)
Jobs: 8 (f=8): [W(8)][5.8%][w=305MiB/s][w=2437 IOPS][eta 01m:53s]
Jobs: 8 (f=8): [W(8)][10.0%][w=325MiB/s][w=2599 IOPS][eta 01m:48s]
Jobs: 8 (f=8): [W(8)][15.0%][w=379MiB/s][w=3030 IOPS][eta 01m:42s] 
Jobs: 8 (f=8): [W(8)][20.0%][w=252MiB/s][w=2018 IOPS][eta 01m:36s] 
Jobs: 8 (f=8): [W(8)][25.0%][w=294MiB/s][w=2349 IOPS][eta 01m:30s] 
Jobs: 8 (f=8): [W(8)][30.0%][w=333MiB/s][w=2660 IOPS][eta 01m:24s] 
Jobs: 8 (f=8): [W(8)][35.0%][w=355MiB/s][w=2843 IOPS][eta 01m:18s] 
Jobs: 8 (f=8): [W(8)][40.0%][w=301MiB/s][w=2409 IOPS][eta 01m:12s] 
Jobs: 8 (f=8): [W(8)][45.0%][w=273MiB/s][w=2181 IOPS][eta 01m:06s] 
Jobs: 8 (f=8): [W(8)][49.2%][w=306MiB/s][w=2445 IOPS][eta 01m:01s] 
Jobs: 8 (f=8): [W(8)][53.3%][w=312MiB/s][w=2496 IOPS][eta 00m:56s] 
Jobs: 8 (f=8): [W(8)][58.3%][w=312MiB/s][w=2499 IOPS][eta 00m:50s] 
Jobs: 8 (f=8): [W(8)][63.3%][w=366MiB/s][w=2924 IOPS][eta 00m:44s] 
Jobs: 8 (f=8): [W(8)][68.3%][w=355MiB/s][w=2840 IOPS][eta 00m:38s] 
Jobs: 8 (f=8): [W(8)][72.5%][w=298MiB/s][w=2384 IOPS][eta 00m:33s] 
Jobs: 8 (f=8): [W(8)][76.7%][w=334MiB/s][w=2673 IOPS][eta 00m:28s] 
Jobs: 8 (f=8): [W(8)][81.7%][w=372MiB/s][w=2972 IOPS][eta 00m:22s] 
Jobs: 8 (f=8): [W(8)][85.8%][w=319MiB/s][w=2550 IOPS][eta 00m:17s] 
Jobs: 8 (f=8): [W(8)][90.8%][w=269MiB/s][w=2150 IOPS][eta 00m:11s] 
Jobs: 8 (f=8): [W(8)][95.0%][w=381MiB/s][w=3051 IOPS][eta 00m:06s] 
Jobs: 8 (f=8): [W(8)][100.0%][w=293MiB/s][w=2342 IOPS][eta 00m:00s]
TEST: (groupid=0, jobs=8): err= 0: pid=28963: Thu Jan  2 22:51:10 2025
  write: IOPS=2887, BW=361MiB/s (378MB/s)(42.3GiB/120049msec); 0 zone resets
    slat (usec): min=3, max=650093, avg=33.68, stdev=2127.44
    clat (usec): min=10, max=654127, avg=44138.23, stdev=15499.71
     lat (usec): min=49, max=654271, avg=44171.90, stdev=15602.61
    clat percentiles (usec):
     |  1.00th=[   178],  5.00th=[  1237], 10.00th=[ 38011], 20.00th=[ 40633],
     | 30.00th=[ 41681], 40.00th=[ 43779], 50.00th=[ 45876], 60.00th=[ 47449],
     | 70.00th=[ 49546], 80.00th=[ 52167], 90.00th=[ 55313], 95.00th=[ 59507],
     | 99.00th=[ 69731], 99.50th=[ 76022], 99.90th=[139461], 99.95th=[185598],
     | 99.99th=[337642]
   bw (  KiB/s): min=210793, max=5100288, per=100.00%, avg=370128.81, stdev=55663.71, samples=1905
   iops        : min= 1642, max=39846, avg=2888.48, stdev=434.90, samples=1905
  lat (usec)   : 20=0.22%, 50=0.12%, 100=0.24%, 250=0.81%, 500=1.29%
  lat (usec)   : 750=0.96%, 1000=0.68%
  lat (msec)   : 2=1.59%, 4=0.35%, 10=0.37%, 20=0.53%, 50=64.87%
  lat (msec)   : 100=27.74%, 250=0.20%, 500=0.01%, 750=0.01%
  cpu          : usr=0.50%, sys=0.36%, ctx=256099, majf=0, minf=8
  IO depths    : 1=0.3%, 2=0.8%, 4=2.5%, 8=58.9%, 16=37.5%, 32=0.0%, >=64=0.0%
     submit    : 0=0.0%, 4=100.0%, 8=0.0%, 16=0.0%, 32=0.0%, 64=0.0%, >=64=0.0%
     complete  : 0=0.0%, 4=95.6%, 8=3.2%, 16=1.3%, 32=0.0%, 64=0.0%, >=64=0.0%
     issued rwts: total=0,346596,0,0 short=0,0,0,0 dropped=0,0,0,0
     latency   : target=0, window=0, percentile=100.00%, depth=16

Run status group 0 (all jobs):
  WRITE: bw=361MiB/s (378MB/s), 361MiB/s-361MiB/s (378MB/s-378MB/s), io=42.3GiB (45.4GB), run=120049-120049msec

And here are the graphs.
Left to right: first hump is 8 copies of dd bs=1M. Second one is longer run of fio above. The last one is the 2-minute fio.

Note that disk is busy only 70-80% in all three cases, while CPU is consistently 45-50%. The “Disk Busy” graph is essentially the same for all 6 HDDs, so only one is posted here.

Will look at the results in a few days. Can you post the ARC graph as well?

Is the system dataset on the HDD pool?

No. It is in the boot-pool, which is on an NVMe.

I’m sorry, I meant the Memory (RAM) graph in order to evaluate the pressure during the test.

here you go.

Using over 800 MiB of swap… on TrueNAS Core? :hushed:

I’ve consistently had 0% swap usage from the first day I installed FreeNAS all the way through TrueNAS Core 13.3.

1 Like

there is a jail and a bhyve instance. None of that is relevant to the question though, as any of it would be pushing CPU/disk usage up, not down.

Remember, the question is NOT why it is slow (which it is not). The question is why does it not want to push disk busy time beyond 80% on writes.